The Mathematical Model and Applications of
Coded Structured Light System for Object
Detecting
Xiaojun Jia
1 1College of Mathematics and Information Engineering, Jiaxing University, Jiaxing, China Email: [email protected]
Guangxue Yue
1,2, Fang Mei
1 1College of Mathematics and Information Engineering, Jiaxing University, Jiaxing, China 2
College of computer & communication, Hunan University, Changsha,, China Email: {guangxueyue, fangmei}@163.com
Abstract—According to the sensing principle of coded structured light, and the characteristics of broad complication and high parameters request, a new coded structured light mathematics model and measurement method is proposed, which can simply and quickly obtain depth information of targets. Model is simulated by computer. It can gain the offset and deformation of pattern images based on different model parameters. For the deformation of images, system parameters can be changed correspondingly. So, whole system can be fixed on using optimal system parameters. The experiment results reveal that the method of structured light model and simulation proposed are reasonable and effective, which have important theoretical value and practical signification.
Index Terms—coded structure light, model, object detecting, reconstruction
I. INTRODUCTION
Coded structured light sensing system [1-3] usually consists of a light source and a camera(CCD). The light source device projects a pattern or a set of patterns to scene, and through analyzing the pattern deformations that appear in grabbed images of every projection with CCD, 3D information of the object surface can be calculated based on the triangle principle and decoding algorithm.
In coded structured light sensing system, sensing precision and vision scope highly depend on several key parameters of system structure: distance between CCD and light source device, visual angle of CCD, visual angle of light source, distance between pattern and light source and distance between image plane and CCD. These parameters must be preprocessed, which is also an extremely tedious process. References [4-6] have given
usual models of structured light sensing system and generic methods of gaining depth information. However, these methods whose derived relations are complex, and errors are high. This paper presents a new structured light mathematical model based on the luminous spot position both pattern and image plane to calculate goal depth information, which is simple and quick. In order to confirm system parameters, model simulation beforehand using the computer is processed. With system parameters changing, pattern image grabbed will displace and distort. According to the deformation of the image’s situation, the optimum system parameters will be obtained, and the model can be finally finalized.
II. STRUCTUREDLIGHTSYSTEMMODEL
Figure 1. Structured light system's pinhole model
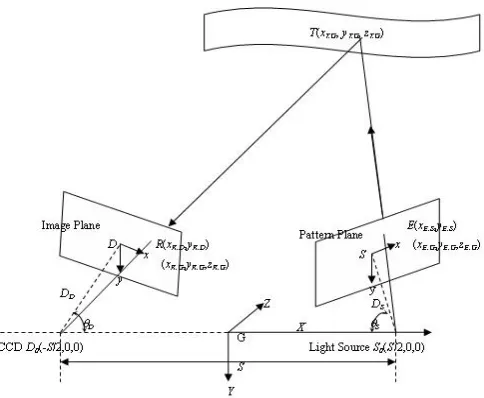
Ideal structured light sensing system model shown in Figure 1 includes spot light sourceS0(S/2,0,0), CCD
) 0 , 0 , 2 / (
0 S
D , pattern planeS, image planeD. 3D world coordinates system is established whose coordinates’
This work is partially supported by the Research Foundation of Science and Technology Bureau of Jiaxing (No:2008AY2014), and the Natural Science Foundation of Zhejiang Province of China under grant( No:Y1080901).
origin is the center point of segment between light source and CCD optical center point. The Z axis plumps paper surface and it points to inner. The coordinates system conforms to the right-hand rule. PlaneSexpresses pattern image. Line through both plane S geometric center and light source S0 is vertical to plane S, whose included
angle to X axis isTS, and the distance isDS. Plane Dis object image plane. Line through both planeDgeometric center and CCD optical center is vertical to plane D, whose included angle to X axis isTD, and the distance isDD. T is goal point in 3D scene. Supposed that the intersection between spatial lineTS0and planeSisE, and
the intersection of spatial line TD0 and plane D is R.
According to the model, depth information of T can be calculated based on triangle principle.
The intersection between spatial linesTS0 andTD0 is
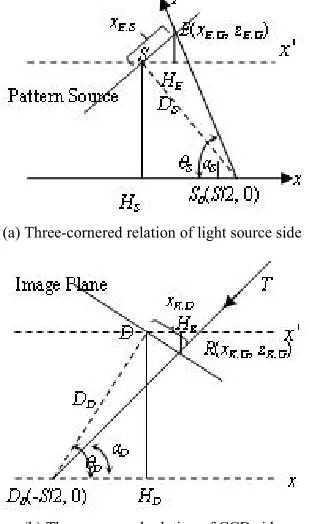
3D coordinates of T. In order to analyze the structured light system, supposed that the system satisfies pinhole model. Projecting Figure 1 to plane XGZ, and the projection is separated into two sub-images shown in Figure 2(a) and (b) for light source side and CCD side respectively. At the side of light source shown in Figure 2(a),SHSis vertical toxaxis, andHS is the intersection.
'
x axis is parallel toxaxis, andSis the intersection.EHE is vertical to x' axis, andHEis the intersection. DS is the included angle from TS0 to x axis. At the side of CCD,
shown in Figure 2(b),DHDis vertical to x axis, andHD
is the intersection. x' axis is parallel to xaxis, and Dis the intersection.RHRis vertical to x' axis, andHRis the
intersection.DD is the included angle fromTD0toxaxis.
Using the triangle geometry relations, a series of equations can be expressed as fellow.
(a) Three-cornered relation of light source side
(b) Three-cornered relation of CCD side
Figure 2. Three-cornered relation of projection
A. Coordinate Transformation Relations
At the side of light source, we suppose that the coordinates of E are (xE.S,yE.S) in plane S coordinate system, and its coordinates in 3D coordinate system G are(xE.G,yE.G,zE.G). According to Figure 1 and Figure 2(a), triangleSHEEis similar to triangleSHsS0, which can
be expressed as:
° ¯ ° ® u u u u S S E S S G E S E G E S S E S S G E x D z y y x D S x T T T T cos sin sin cos 2 / . . . . . . (1)
Likewise, at the side of CCD, we can obtain planar point R(xR.D,yR.D)of spatial point T(xR.G,yR.G,zR.G) in image. According to Figure 1 and Figure 2(b), triangle DRHRis similar to triangleDD0HD. Comparing with (1),
its equation is:
° ¯ ° ® u u u u D D R D D G R D R G R D D R D D G R x D z y y x D S x T T T T cos sin sin cos 2 / . . . . . . (2)
B. Depth Information Calculation
We observe that coordinates of R(xR.D,yR.D) in image plane corresponds to D coordinate. Through decoding algorithm, and point E(xE.S,yE.S) in pattern corresponds to pointR. According to the above, we may calculate spatial coordinates of targetTas follows:
°¯ ° ® ) / ( ) / ( . 1 . 1 D D R D D S S E S S D x tg D x tg T D T D (3) And: D G T S G
T ctg z ctg
z
S . u D . u D (4) Combining (1) and (2), zT.G is expressed by the equation: ) sin( sin sin . D S D S G T S z D D D D u u (5) And: ) sin( ) sin( 2 / 2 / . . D S D S S G T G T S ctg z S x D D D D D u u (6)
In addition, in theYGDplane, there is:
° ° ° °
¯ °° ° °
®
u u
u u u
u u u
u
) sin(
sin sin
) cos sin
( ) sin(
) sin (sin
) sin(
) sin( 2 /
.
. . .
.
D S
D S G
T
S S E S S S D
S E D S G
T
D S
D S G
T
S z
x D
y S
y S x
D D
D D
T T
D D
D D D D
D D
(9)
III. SYSTEMSIMULATIONEXPERIMENTS
Before applying the structured light model to practical scene, it is necessary that the system optimal parameters should be decided to finalize the sensing system. We develop a set of software system to adjust model parameter based on Borland C++ Builder 6.0 and Intel OpenCV computer vision library.
At fist, we must choose experiment parameters and their expression methods. The distance of light source and CCD: S; The distance between light source and pattern:DS, included angle:S_Degree; The distance between CCD and image plane: DD , included angle:D_Degree;Depth information:Z.
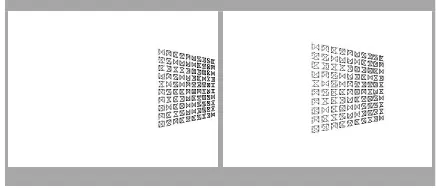
In experiments, to clearly display displacement and distortion pattern in image, partial pattern is put into projecting. In fact, the experimental results have nothing to do with the projection pattern, even if the pattern consists of Chinese character or other small sub-image, the similar experimental results can be obtained. Projection pattern is shown in Figure 3, whose size is 121 ×121 pixels. The image plane size is 640×400 pixels. The unit of length is millimeter (mm), and the unit of angle is degree (°).
Figure 3. Projection pattern (Enlargement)
A. The Fist Simulation Experiment
Sޔ DS ޔ DD ޔ S_Degree and D_Degree are invariable, but Z changes gradually. We take 20 values separately to observe the change of image, such as 1000, 1200, 1400, 1800, 2000, 3000, and so on. Two experimental results are shown in Figure 4.
(a)The image at 1000mm (b)The image at 2000mm
Figure 4. Images under differentZvalues
With theZchanging from small to big, the image will gradually shift from right go left in the image plane, and it will grow big. At the same time, it does not maintain consistent with primitive image’s position and size. IfZis big enough, the image will arrive at the boundary of image plane. Theoretically, the bigger the depth, the bigger symbols in the pattern will increase in the scene. Because of included angles of light source side and CCD side, images don’t keep consistent result with primitive image’s position and size even though depth Z changes big. Experimental result shows that even if the depth value is very big under determinate SޔDS ޔDD ޔ
Degree
S_ and D_Degree, the pattern image may also be observed in image plane. Certainly, once Z is big enough, such as 50000mm, because of counting error, the image will become fuzzy, and cross the border of image plane.
B. The Second Simulation Experiment
SǃDSǃDDand Z are invariable, but D_Degreeis variable. To simplify the experiment parameters,
Degree
S_ and D_Degreeare assigned same value. In fact, they can be different value. The angles assign 45, 60, 65, 75, 80, 89, 89.9 degrees and so on. Two experiment results are shown in Figure 5.
(a)The image at 60 degree (b)The image at 80 degree
Figure 5. Images with S_Degreeand D_Degreechanging
Different angles have a crucial influence to image size. When the angle is small, the change of depth of scene changes is small. When the angle gradually approaches to 90 degrees, image likely reaches the primitive pattern's size. Although we may theoretically obtain the image whose size is same with original pattern, if pattern is too big to observe whole image. Because there is certain distance between light source and CCD, which names invisible region, therefore, we must adopt the suitable angles to avoid this situation occurring.
C. The Third Simulation Experiment
SޔS_DegreeޔD_Degreeand Z are invariable, but S
different images are obtained. There are two images shown Figure 6.
(a) The image at 50mm (b) The image at 80mm
Figure 6. Images with DS and DDchanging
S
D and DD have the crucial role to influence on image size. The smaller its value is, the more serious the deformation of the image is. The bigger its value is, the closer approaches to the primitive pattern. However, the scene depth and area inevitably influence pattern's size and request the bigger image plane, which contravenes the actual request. Suitable DS and DD may satisfy not only the image request but also making the pattern small. It can achieve measurement request.
D. The Fourth Simulation Experiment S
D ޔ DD ޔ S_Degree ޔD_Degree and Z are invariable, but S changes. 30 different values are chosen to use, such as 400mm, 800mm, 1400mm, 1800mm and so on. Two images are shown in Figure 7.
(a) The image at 800mm (b) The image at 1200mm
Figure 7. Images withSchanging
Different S has tremendously influences to the image position and distortion. The smallerSvalue is, the fiercer deformation of the image is. The bigger S value is, the closer approaches to primitive pattern. At the same time, the image will be reformatting seriously. Theoretically, the structured light sensing principle is based on trigonometry. When one side of triangle changes, the distance form its opposite angle apex to the side will badly change. In practical application, we usually need to consider the size and portability of model Therefore. So theSis not too big.
E. Simulation Experiment Conclusions
Comparing with and analyzing different experiment results, we may summarize for the system parameters as follows:
y DS and DD have the key roles. Even if they are small, the image will have serious distortion.
y S_Degree and D_Degree have crucial influences to sense depth information, and because of them, invisible region may appear. y S has a key role influences to image
deformation. Thinking about the serviceability of installment, it is necessary for us to change suitable S.
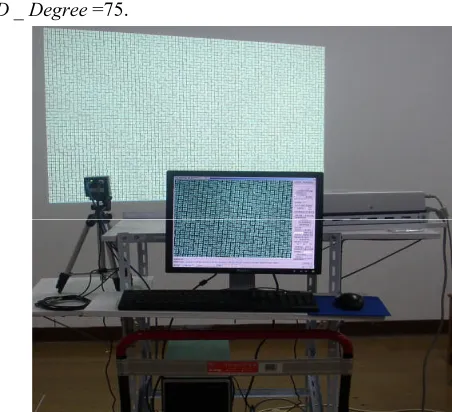
Figure 8 shows the established experiment platform which based on the following group of parameters: S=900mm, DS and DD =65mm, S_Degree and
Degree D_ =75.
Figure 8. Structured light sensing platform
IV. MODELAPPLICATIONS
Using the established experiment platform to detect the objects in scene, we propose the code pattern, the codification and the three dimensional reconstruction. A. Code Pattern
window. But it should be made sure the color-coding is feasible. Spoelder et al.[12] evaluated the accuracy and the robustness on color-coded PRBA’s. Good results were obtained by using a 65*63 PRBA pattern with window size of 6*2. Petriu et al.[13] also proposed a grid light pattern of 15-by-15 with multi-valued color codification. But the colors used in the proposed pattern were not fixed. This approach generally suited for static sense since it assumed the objects kept stationary during the experiment.
PRSA has a very important window characteristic when a k1×k2 sub-window is moving through in n1×n2 windows㧔k1<=n1 and k2<=n2㧕.The mall sub-windows can be recognized uniquely. We bespread a 1024×768 projector plate with code points which occupy 11×11 pixels and spaced by 2 pixel. There will be 79×59 code points on the plate and 4661 code words are produced for global unique codification. And, only are 10 code bits and a minimum sub-window size of 2×2 required to generate such a large number of code words while utilizing monochrome illumination. In order to make best use of symbol’s horns and intersections, we choose 10 special symbols. The symbols chosen to be the elements of M array have three characteristics. First, the symbols’ size is 11×11, which satisfies the measuring accuracy. Second, the symbols can not be affected by translating, revolving and scaling, so have the high measuring accuracy. Third, the turning points and the intersections of each symbol have provided as far as possible many characteristic point to support to obtain the restructuring data. Figure 9 shows partial image we grabbed by a digital camera based on COMS structure with resolution of 2048×1536 while we projected sub-patterns onto a stair with a projector with resolution of 1024×768.
Figure 9. Partial grabbed image
B. Key Points Identification
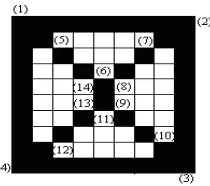
Horns and intersections of symbols are settled in sub-pattern acting as key points and we realized that these points, such as point 1, 2, 3, 4 and so on shown in Figure 10, have large angle variations.
Figure 10. Key points definition
Because there are only several kinds of angle variation, such as 0, 45, 90, 135, 180, 225, 270 and 315 degrees, we take place of evaluating angle variation by its direct conjunct neighbors. We defined the angle variation at one point, point p in Figure 11 for an example, as follow.
Figure 11. Angle variation
Giving an integer r, and assumeIpis the index of point p in contour sequence. Two points a and b can by created at coordinates of equation (10) respectively.
¦ ¦
¦
¦
r Ip
Ip
i i
y r
b y r
Ip Ip
i i
x r
b x
Ip r Ip
i i
y r
a y Ip
r Ip
i i
x r
a x
1 1
; 1 1
1 1 ;
1 1
(10)
Where xiand yi are the coordinates of the point with index ofiin contour sequence.
Defines vectors apand pb as
) , ( )
, (
) , ( )
, (
p p b
b
a a p
p
y x complex y
x complex pb
y x complex y
x complex ap
(11)
Angle variation at point p can be computed as ) ( )
(pb angle ap angle
p
T (12)
So, if we always arrange contour sequence at one direction, say clockwise, the angle variations at key points (KPfor short)1, 2, 3, 4, 5, 7, 10 and 12 will have positive peak values, while the angle variations at points 6, 8, 9, 11, 13 and 14 get negative peak values as shown in Figure 12 and Figure 13.
(a)Symbol’s outer contour sequence
(b)Symbol’s inner contour sequence
Figure 12. Angle variation under given integer(r=17)
(a)Symbol’s outer contour sequence
(b)Symbol’s inner contour sequence
Figure 13. Angle variation under given integer(r=10)
Figure 12 and Figure 13 show angle variations under different given integer r. X-axis is point index in contour sequence. Y-axis is the angle variation of each point. r equals 17 and 10 respectively in Figure 12 and Figure 13.
Angle variations related closely with the given integer r. A small value ofris capable of view detail information of the chain and a large value of ris helpful to perceive general shape of the chain. We can find in Figure 12 and Figure 13, there would be one negative peak between two successive positive peaks. At the key point, angle variation is larger than other point’s. These key spots have the high locating accuracy, which may be seen as the measuring point.
C. 5.3 Symbol Identification and Code Mapping Different symbols has different angle variation, and there are remarkable difference of the position of positive and negative peaks between different random two symbols At the same time, the sum of positive and negative peaks has difference among these 10 symbols. Because of above features, we may identify robustly 10 kinds of symbols.
We greatly shrunk unknown region in a symbol by the identification of key points. Subsequently, we map unidentified symbols, one by one, to positions in the standard pattern model. We make use of the sub-window global unique characteristic of PRSA to identify symbols and key points 1 to 14 act as reference points through mapping process. Two nearest reference points are
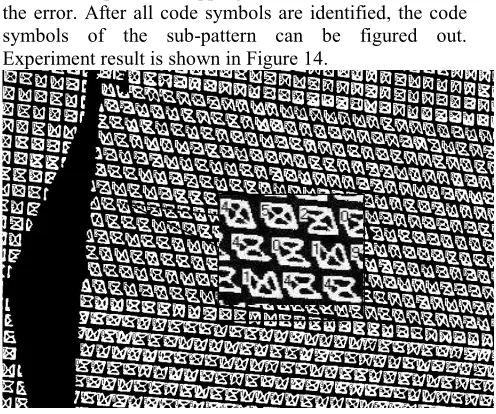
chosen to implement mapping action in order to minimize the error. After all code symbols are identified, the code symbols of the sub-pattern can be figured out. Experiment result is shown in Figure 14.
Figure 14. Experimental decoding results on partial image
The program can only cope with integrated sub-patterns at current stage. Figure 14 displays the experimental result while applying above recognition algorithm on partial image of stair. The result shows the algorithm works correctly for integrated sub-patterns. D. Three Dimensional Reconstruction
Using establishment model, the designed pattern is projected to the object in scene. The CCD grabs scene image. The process of identification of sub-pattern means the establishment of relation between distorted sub-pattern and normal sub-sub-pattern. Using this information, based on the structured light sensing principle [15-16], we can reconstruct 3D outline of objects.
(a) Reconstruction plane
(b) Reconstruction ladder
Figure 15. Reconstruction results
(5) (7) (10) (12) (5)
(6) (8)(9) (11) (13)(14)
(1) (2) (3) (4) (1)
(5) (7) (10) (12) (5)
Figure 15(a) and (b) are the reconstruction results of two objects. There are some cavities and burrs. The reasons are: First, because of scene depth influence, partial pattern symbols are broken and incomplete, so decoding algorithms can’t recognize them. Second, after symbol image pro-processing, as a result of noise disturbance, partial symbols’ contour is broken, which disturbs symbol recognition. Third, there are lost judgment and misjudgment symbols in the course of recognition
We defined two formulas to calculate the recognition rate of symbols and the erroneous judgment rate of sub-window as follow.
% 100 * _
_ _
_
sum S
sum ES sum S rate
R ˉ (13)
Where R_rate is the recognition rate of symbols, sum
S_ and ES_sum are the sum of symbols and the sum of erroneous or omissive judgment symbols respectively.
% 100 * _
_ _
sum W
sum EW rate
E (14)
Where E_rate is the erroneous judgment rate, sum
EW_ and W _sum are the sum of erroneous or omissive judgment windows and the sum of sub-windows respectively.
Using equations (13) and (14), we have calculated the recognition rate and sub-window erroneous judgment rate of a plane and a ladder shown in Table 1.
TABLE1. THE R_rate AND E_rate OF OBJECTS
Objects R_rate E_rate
Plane 99.51% 1.61%
Ladder 98.13% 6.34%
Some valuable conclusions can be obtained from Table 1. The character recognition rate is above 95%, the sub-window erroneous judgment rate is below 7%, which can achieve the basic recognition requirement. Future works will focus on the integration of broken patterns caused by discontinuous surface. With the changing of scene depth, the image of a certain pattern will shift along a certain path. So fractals of the pattern are unlikely to appear in the image unrestrictedly. And with the help of horns in the pattern, which can be used as indicators of fractals, fractals might be scrabbled up and then be submitted to decoding process discussed above.
V. CONCLUSIONS
Recently, the structured light technology is becoming research hot spot in 3D detecting technologies. Structured light technique is a deformation of stereovision, which projects a coded pattern light. It overcomes the question of pixel matching, and its detection is simple, rapid and high efficient. It is an ideal approach of 3D sensing. Structured light detecting technique has extensive requirement and applicative potential in the fields of robot navigation, reversion engineering, object
recognition, industrial automation, object tracking, etc.. This paper proposes a simple mathematical model, and simulates using computer. The optimal system parameters are obtained in the experiments, which will support for the structured light technology further application. The 3D reconstruction experiment results show the partial superiority of structured light. So structured light technique research is both of theoretical and applicative value.
REFERENCES
[1] Dalit Caspi, Nahum Kiryati, Joseph Shamir, “Range Imaging with Adaptive Color Structured Light”, IEEE Transactions on Pattern Analysis and Machine Intelligence, Vol. 20 , NO. 5(May 1998), pp. 470-480.
[2] Jordi Pagès, Joaquim. Salvi, Carles Matabosch, “Implementation of a Robust Coded Structured Light Technique for Dynamic 3D Measurements”, IEEE International Conference on Image Processing, ICIP 2003, vol. 1, Barcelona, Spain(Sep. 2003), pp. 1073-1076. [3] Jordi Pagès, Assisted Visual Serving by Means of
Structured Light. European thesis for the University of Girona and French thesis for the University of Rennes I. Viva: November the 25th, 2005.
[4] Zhong-hai HE, Bao-guang WANG, “Model and Imaging Formula of the Line Structured Light Sensor”, Optics and Precise Engineering, Vol. 9, No. 3, 2001, pp. 269-272.
[5] Guo-zhi TAO, Wen LIU, Sheng-hua YE, “The
Mathematical Model and Measurement Method of Single Line Structured Light Transducer”, Journal of Astronautic Metrology and Measurement, Vol. 19, No. 6, 1999, pp. 51-54.
[6] Guang-jun ZHANG, Jun-ji HE, “Mathematic Model of Inner Surface 3D Vision Inspection Based on Circle Structured Light”, Chinese Journal of Scientific Instrument, Vol. 25, No. 4, 2004, pp. 481-484.
[7] Ali A., Halijak C A. “The pseudorandom sequence of arrays”, System Theory, 1989. Proceedings., Twenty-First Southeastern Symposium on. 1989,pp. 138-140.
[8] Morita H, Yajima K and Sakata S. “Reconstruction of surfaces of 3-d objects by m-array pattern projection method”. Computer Vision, 1988. Second International Conference on, 1988,pp. 468-473.
[9] Kiyasu S, Hoshino H, Yano K, et al. “Measurement of the 3-d shape of specular polyhedrons using an m-array coded light source”. Instrumentation and Measurement, IEEE Transactions on,Vol. 44, No. 3, 1995, pp. 775-778. [10] Vuylsteke, P. A. Oosterlinck, “Range image acquisition
with a single binary-encoded light pattern”. Pattern Analysis and Machine Intelligence, IEEE Transactions on. Vol.12, No.2 1990, pp.148–164.
[11] Morano, R. Ozturk C., Conn R., Dubin S., Zietz S., Nissano J, “Structured light using pseudorandom codes. Pattern”, Analysis and Machine Intelligence, IEEE Transactions on. Vol.20, No. 3, 1998, pp. 322–327. [12] Spoelder J., Vos F., Petriu E., Croen F., “A study of the
robustness of pseudorandom binary-array-based surface characterization”, Instrumentation and Measurement, IEEE Transactions on. Vol.47, No.4, 1998, pp. 833–838. [13] Petriu E. M., Sakr Z., H. J.W. Spoelder, “A. Moica: Object
recognition using pseudo-random color encoded structured light”, Instrumentation and Measurement Technology Conference, 2000. IMTC 2000. Proceedings of the 17th IEEE. 2000, pp. 1237–1241.
[14] Joaquim Salvi, Jordi Pagès, Joan Batlle. “Pattern Codification Strategies in Structured Light Systems”, Pattern Recognition, The Journal of the Pattern Recognition Society, Oct. 2, 2003, pp. 1-23.
Patterns”. 17th International Conference on Pattern Recognition, (ICPR’04)-Volume 4, 2004, pp. 284-287. [16] Qing-cang Yu, Xiao-jun Jia, Jian Tao, Yun Zhao, “An
Encoded Mini-Grid Structured Light Pattern for Dynamic Scenes”. Lecture Notes in Computer Science, v3644. Part I, pp. 126-135.
Xiaojun Jia received his B.E degree from University of Electronic Science and Technology of China in 1999 and M.S degree from Zhejiang Sci-Tech University in 2007. His research focus is computer vision, digital image processing, detecting online and computer education. He has published 10 papers in both technical and educational fields.
Guangxue Yue received her M.S degree from Hunan University, China . Currently, he is working towards the Ph.D. degree in College of computer & communication, Hunan University. His research focus is networking and distributed computing, embedded computation, detecting online and computer education.