Attainment of Course Outcomes and Program
Outcomes: A Case Study in an Engineering
Course
Pravin G. Kulkarni Ami R. Barot
Assistant Professor Assistant Professor
Department of Mechanical Engineering Department of Mechanical Engineering
PVG’s College of Engineering & Technology, Pune, India PVG’s College of Engineering & Technology, Pune, India
Abstract
Quality assurance and improvement process is about determining whether the set educational objectives meet a general standard of quality. Emphasis of outcome based education (OBE) system is on quantifying what the students are capable of doing and learning outcomes of the students is one of the key components. Course Outcomes are the statements indicating knowledge and skills the student is expected to acquire at the end of a course. Program outcomes represent the knowledge, skills and attitudes the students should have at the end of program. Program outcomes can be directly measured through course outcomes. The outcome based education model is based on defining various parameters called as Graduates Attributes. In this paper, an approach for measuring program outcomes attainment through course outcomes is presented. Course outcomes are attained based on assigning two step weights depending upon the nature of course and mapping of various exam heads with respect to course outcomes. The proposed method provides the result of course outcome attainment and program outcome attainment. The results are obtained through a program in MS Excel.
Keywords: Course Outcomes, Outcome based education, Program Outcomes, Weights
________________________________________________________________________________________________________
I. INTRODUCTION
Course Outcomes are statements indicating knowledge and skills the student acquires at the end of a course. Program outcomes represent the knowledge, skills and attitudes the students should have at the end of program and are as mentioned below:
1) Engineering knowledge: Apply the knowledge of mathematics, science, engineering fundamentals, and an engineering specialization to the solution of complex engineering problems.
2) Problem analysis: Identify, formulate, review research literature, and analyze complex engineering problems reaching substantiated conclusions using first principles of mathematics, natural sciences, and engineering sciences.
3) Design/development of solutions: Design solutions for complex engineering problems and design system components or processes that meet the specified needs with appropriate consideration for the public health and safety, and the cultural, societal, and environmental considerations.
4) Conduct investigations of complex problems: Use research-based knowledge and research methods including design of experiments, analysis and interpretation of data, and synthesis of the information to provide valid conclusions.
5) Modern tool usage: Create, select, and apply appropriate techniques, resources, and modern engineering and IT tools including prediction and modeling to complex engineering activities with an understanding of the limitations.
6) The engineer and society: Apply reasoning informed by the contextual knowledge to assess societal, health, safety, legal and cultural issues and the consequent responsibilities relevant to the professional engineering practice.
7) Environment and sustainability: Understand the impact of the professional engineering solutions in societal and environmental contexts, and demonstrate the knowledge of, and need for sustainable development.
8) Ethics: Apply ethical principles and commit to professional ethics and responsibilities and norms of the engineering practice. 9) Individual and team work: Function effectively as an individual, and as a member or leader in diverse teams, and in
multidisciplinary settings.
10) Communication: Communicate effectively on complex engineering activities with the engineering community and with society at large, such as, being able to comprehend and write effective reports and design documentation, make effective presentations, and give and receive clear instructions.
11) Project management and finance: Demonstrate knowledge and understanding of the engineering and management principles and apply these to one’s own work, as a member and leader in a team, to manage projects and in multidisciplinary environments.
Outcome Based Education (OBE) model has potential to measure the learning outcomes. Various attributes such as knowledge, skill, values, attitude must be given due importance. The students should successfully demonstrate these attributes at the end of program. Quality of teaching must be judged from quality of learning. Hence each program must have intended outcomes. For each course, course outcome statements are formed which have linking with program outcomes. The various steps in outcome based education are:
Setting the objectives and outcomes Defining outcome based process Designing outcome based curriculum Outcome based delivery and learning Assessment and evaluation of outcomes
In this paper, a method for Course Outcome attainment is presented based on two step weights and based on course outcomes, program outcome attainment is measured. Setting a target value during attainment of course outcomes is an important step.
II.FRAMEWORK OF OBE
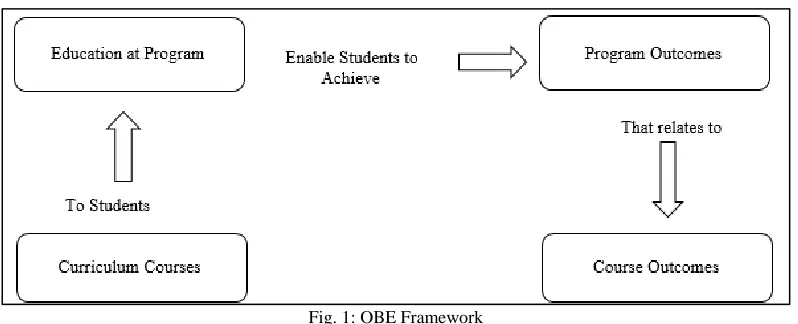
Fig. 1: OBE Framework
Fig.1 shows framework of Outcome Based Education (OBE). OBE is an educational process which is based on making an endeavor to achieve certain specified outcomes in terms of student learning. The three components that encompass an outcome-based approach to learning are:
An explicit statement of learning intent expressed as outcomes
Approach to enable the intended learning to be achieved and demonstrated (curriculum, teaching, learning, assessment and support and guidance methods)
Criteria for assessing learning aligned to the intended outcomes
Course Outcomes (COs) are broad statements of what a student should be able to demonstrate upon completion of a course. COs are the measurable, achievable, realistic attributes and are based on Bloom’s Taxonomy. Each course outcome must be mapped to program outcomes POs. The extent to which each CO correlates with respective PO can be expressed as low, medium or high. Collective COs for all courses in a curriculum must address all POs and PSOs.
III. METHODOLOGY
This section describes in detail the methodology adopted for the attainment of the course outcomes for an engineering course in Mechanical program.
Fig. 2: Teaching-Learning process cycle
Fig. 2: shows Teaching-Learning process cycle. Firstly, the course objectives and course outcomes are set for the course. Different assessment tools are planned along with the schedule. In the next phase, course contents are delivered as per the prepared lesson plan and based on the assessment tools, assessment is carried out. In the third phase, based on the marks obtained by students, analysis and evaluation of course outcomes is done along with planning of steps for continuous improvement.
Table – 1
Database for an Engineering Course (for Direct CO attainment)
Course External Assessment Internal Assessment
Roll
No. Name of Student
INSEM (30) UNIT 1, 2, 3 Each 10 Max
Marks ENDSEM (70) UNIT 1 to 6 TW (25) UNIT 1 to 6
OR (50) UNIT 1 to 6
Class Test (30) UNIT 1, 2, 3 Each 10 Max
Marks
Assignment (30) UNIT
1 to 6
COS CO1 CO2 CO3 TOTAL ALL COS ALL
COS ALL
COS CO1 CO2 CO3 TOTAL ALL COS
1 STUDENT 1 5 8 8 21 66 18 44 6 8 9 23 20
2 STUDENT 2 9 8 6 23 59 24 32 7 7 8 22 22
3 STUDENT 3 8 7 8 23 64 23 42 8 6 9 23 27
4 STUDENT 4 7 8 6 21 48 21 41 8 7 7 22 22
5 STUDENT 5 6 8 6 20 44 22 43 9 5 7 21 21
6 STUDENT 6 8 6 7 21 45 23 42 8 8 8 24 23
7 STUDENT 7 8 6 4 18 65 20 38 6 7 6 19 25
8 STUDENT 8 9 8 4 21 59 24 44 8 7 8 23 24
9 STUDENT 9 8 9 9 26 62 22 43 6 7 6 19 28
10 STUDENT 10 5 7 9 21 64 23 42 7 5 7 19 20
Table 1 shows the external assessment and internal assessment tools along with the mapped respective course outcomes. This database prepared in MS excel shows student wise marks for each exam head along with the COs that are mapped. The tools for CO attainment are external and internal. The external assessment tools are given 80% weightage and 20 % weightage is given to internal assessment tools. Total CO attainment is calculated as:
CO Attainment = 80 % of external assessment + 20 % of internal assessment
In the next phase of CO attainment calculations, two stage weights are given. Depending on the evaluation scheme such as Theory/Practical/Oral/Term work, the courses can be categorized as A, B, C, D and Weight W1 is assigned accordingly. The course under study has Theory, Oral and Term work and the weights are assigned as per the Table 2.
Table – 2
Weight W1 as per the evaluation scheme Category A
TH OR TW
0.5 0.3 0.2
The next weight W2 corresponds to each Course Outcome and its correlation with the respective examination head as shown in Table 3. This is based on marks assigned for each question (Course wise) in the previous question paper.
Table – 3
Weight W2 for each CO w.r.t evaluation scheme Distribution of Cos based on last 2 yrs. TH,OR,TW
Engineering Course Course Outcomes
CO1 CO2 CO3 CO4 CO5 CO6
TH 0.15 0.15 0.15 0.15 0.15 0.25
OR 0.1 0.3 0.1 0.2 0.2 0.1
TW 0.2 0.25 0.1 0.1 0.1 0.25
This is an important parameter since change in a particular weight results in altogether different value of CO attainment which in turn affects actions to be proposed. External ENDSEM total marks are diffused into CO1 to CO6 marks using following formula: CO1 = W1*W2*ENDSEM Mark + W1*W2*ORAL MARK+W1*W2*TERM WORK MARK (1) In the similar way, CO2 to CO6 marks are calculated and Table 4 is prepared shown below.
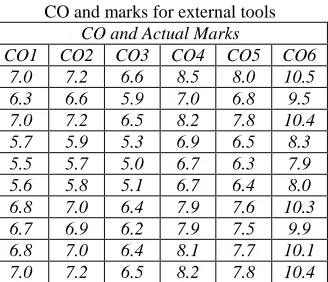
Table – 4
CO and marks for external tools CO and Actual Marks
CO1 CO2 CO3 CO4 CO5 CO6
7.0 7.2 6.6 8.5 8.0 10.5 6.3 6.6 5.9 7.0 6.8 9.5 7.0 7.2 6.5 8.2 7.8 10.4 5.7 5.9 5.3 6.9 6.5 8.3 5.5 5.7 5.0 6.7 6.3 7.9 5.6 5.8 5.1 6.7 6.4 8.0 6.8 7.0 6.4 7.9 7.6 10.3 6.7 6.9 6.2 7.9 7.5 9.9 6.8 7.0 6.4 8.1 7.7 10.1 7.0 7.2 6.5 8.2 7.8 10.4
for the same course in earlier years. This can be done by taking into account average marks for last two years. Based on this, the target is fixed for attaining course outcomes for the course under discussion.
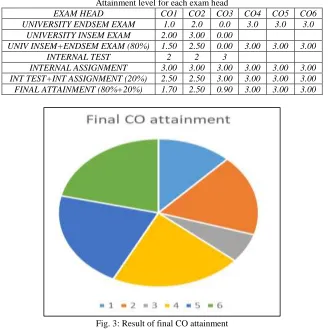
Finally attainment levels are to be fixed based on what population of students score above the target mark. For higher population scoring more than target value, the attainment level is marked as 3 and accordingly. The attainment levels for each exam head is tabulated in Table 5. Result of final CO attainment is plotted in Fig. 3.
Table – 5
Attainment level for each exam head
EXAM HEAD CO1 CO2 CO3 CO4 CO5 CO6
UNIVERSITY ENDSEM EXAM 1.0 2.0 0.0 3.0 3.0 3.0
UNIVERSITY INSEM EXAM 2.00 3.00 0.00
UNIV INSEM+ENDSEM EXAM (80%) 1.50 2.50 0.00 3.00 3.00 3.00
INTERNAL TEST 2 2 3
INTERNAL ASSIGNMENT 3.00 3.00 3.00 3.00 3.00 3.00 INT TEST+INT ASSIGNMENT (20%) 2.50 2.50 3.00 3.00 3.00 3.00 FINAL ATTAINMENT (80%+20%) 1.70 2.50 0.90 3.00 3.00 3.00
Fig. 3: Result of final CO attainment
After measuring CO attainment for a course, CO-PO mapping table will give Program Outcome attainment levels. A typical CO-PO mapping table for the course under discussion is shown below:
Table – 6 CO-PO Mapping
PO1 PO2 PO3 PO4 PO5 PO6 PO7 PO8 PO9 PO10 PO11 PO12
CO1 3 3 3 3 3 3 3 1 2 2 1 2
CO2 3 3 1 1 1 1
CO3 3 3 2 1 1 1
CO4 3 3 1 2 1 1
CO5 3 3 3 3 3 3 3 1 2 2 1 2
CO6 3 3 3 3 3 3 3 1 2 2 1 2
Based on final attainment of Course Outcomes shown in Table 5 and mapping of each Course Outcome with Program Outcomes, final attainment of Program Outcomes is measured. Table 7 shows the result of Program Outcomes attainment based on CO direct attainment.
Table – 7 PO direct attainment
PO1 PO2 PO3 PO4 PO5 PO6 PO7 PO8 PO9 PO10 PO11 PO12
CO1 1.7 1.7 1.7 1.7 1.7 1.7 1.7 0.6 1.1 1.1 0.6 1.1
CO2 2.5 2.5 0.8 0.8 0.8 0.8
CO3 0.9 0.9 0.6 0.3 0.3 0.3
CO4 3 3.0 1.0 2.0 1.0 1.0
CO5 3 3.0 3.0 3.0 3.0 3.0 3.0 1.0 2.0 2.0 1.0 2.0
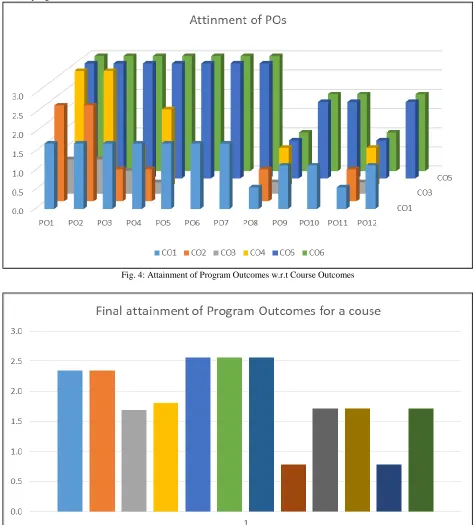
The values of each PO attainment with respect to course outcomes are shown and represented graphically in Fig. 4. Finally at the course level Program Outcome attainment is measured as shown in Fig.5 which can further be used to measure Program Outcomes at program level.
Fig. 4: Attainment of Program Outcomes w.r.t Course Outcomes
Fig. 5: Final attainment of Program Outcomes for a course
IV. CONCLUSION
The work presented in the paper proposes a method based on assigning weights best suited to the evaluation scheme of a course and their mapping with Cos. One of the key aspects in the process of CO attainment is fixing the target value. The proposed method takes into account the major population of students for setting the target. The paper basically focuses on direct attainment of Course Outcomes based on which attainment of Program Outcomes can be measured. The result of program outcome attainment for all courses can be plotted which will indicate the program outcomes which are attained to the fullest possible extent. The program outcomes which are remotely attained forms the basis for planning of action for continuous improvement in the subsequent years.
REFERENCES
[1] Shivkumar Ramchandra, Samita Maitra and K MallikarjunaBabu, “Method for estimation of Attainment of Program Outcome through Course Outcome for Outcome based Education”, 2014 IEEE Conference on MOOC, Innovation and Technology in Education (MITE) 7-12.
[2] Izham Zainal Abidin, Adzly Anua and Norshah Hafeez Shuaib, “Assessing The Attainment of Course Outcomes (CO) For An Engineering Course”, Proceedings of the 2nd International Conference of Teaching and Learning INTI University College, Malaysia (ICTL 2009).
[3] Kiran B. Malagi, Kumar Swamy V., B. S. Anami, “A Novel Method for Attainment Measurement of COs and POs for Tier-II Institutions” Journal of Engineering Education Transformations, Special Issue, eISSN 2394-1707.
[4] D. R. Kalbande, S. S. Rathod, “Software development for Course and Program Outcome Attainment”, Journal of Engineering Education Transformations, Special Issue, eISSN 2394-1707.
[5] Sushama Kolhe, Vidya Palve, Sagar Vetal, Yogen Lohite, “Attainment of Course Outcomes For Microcontroller Course by Using Direct-Indirect Method”, International Journal of Innovative Research in Science, Engineering and Technology, Vol. 5, Issue 12, December 2016.
[6] Swarna M. Patra, Ramakanth Kumar P., “Academic Excellence Through Attainment of Course Outcomes a case Study On Engineering Chemistry”, Journal of Educational Research & Medical Teacher,2016, 4(1),09-19.
[7] Dr. A. Kavitha, K. Immanuvel Arokia James, K. A. Harish and Dr. V. Rajamani, “A Empirical Study On CO-PO Assessment & Attainment For NBA TIER-II Engineering Accreditation Towards Empowering The Students Through Outcome Based Education”, International Journal of Pure and Applied Mathematics, Volume 118 No. 20 2018, 2615-2624.
[8] Varsha T. Lokare, Prakash M. Jadhav, “Course Outcomes Attainment for Data Structure Course Using Direct and Indirect Methods”, Journal of Engineering Education Transformations, Special Issue, eISSn 2394-1707.