EEG Signal Classification using K-Means and
Fuzzy C Means Clustering Methods
Nitin Narahari Hegde Prof. M. S. Nagananda
M. Tech Student Professor and HOD
Department of Medical E & IE Department of Medical Electronics Engineering RVCE, Bangalore DSCE, Banglore
Mr. Harsha
Assistant Professor Department of E & IE
RVCE, Bangalore
Abstract
The Electroencephalogram (EEG) signal is a voltage signal arising from synchronized neural activity. EEG can be used to classify different mental states and to find abnormalities in neural activity. To check the abnormality in neural activity, EEG signal is classified using classifiers. In this project k-means clustering and fuzzy c means (FCM) clustering is used to cluster the input data set to Neural network. NeuroIntelligence is a neural network tool used to classify unknown data points. The non linear time series (NLTS) data set is initially clustered into Normal or Abnormal categories using k-means or FCM clustering methods. This clustered data set is used to train neural network. When an unknown EEG signal is taken, first NLTS measurements are extracted and input to trained neural network to classify the EEG signal. This method of classification proposed is unique and is very easy to classify EEG signals.
Keywords: EEG, Classifiers, k-Means Clustering, Fuzzy C Means Clustering, Neural Network Classifiers, Neurointelligence
________________________________________________________________________________________________________
I.
I
NTRODUCTIONThe Electroencephalogram (EEG) signal is a voltage signal arising from synchronized neural activity. EEG is produced due to coordinated activity of millions of neurons in the brain. EEG is measured by non-invasively in two ways. One way is to place an electrode on or near the scalp, and other is by implanting an electrode in the skull. Synchronized neural activity varies according to development, mental state, and cognitive activity, and hence causing variations in EEG signal. So EEG can be used to classify different mental states and to find abnormalities in neural activity. To check the abnormality in neural activity, EEG signal is classified using classifiers. In this paper, some of the classifiers are discussed to classify EEG.
Classifiers are categorised into two types. Supervised learning classifiers and unsupervised classifiers (also called as clustering). Linear discriminant analysis, Neural networks and Naive Bayes classifiers are supervised classifiers where as k-means clustering and Fuzzy c k-means (FCM) classifiers are some of the unsupervised classifiers or clustering methods. Supervised classifiers require prior knowledge about the data to be classified. Supervised classifiers are trained with data input and when the unknown data point is input to the classifiers, it classifies the data point into a particular class based on training. In clustering there is no need of prior knowledge about the data. So clustering is generally used prior to classifiers to prepare training data set for classifiers.
The Neural network is a widely used supervised classifier. Here an input data set is used to train the network. In this project k-means clustering and FCM is used to cluster the input data set to Neural network. NeuroIntelligence is a neural network tool used to classify unknown data points.
II.
L
ITERATURE REVIEWThis project has hardware and software section. Design and development of EEG active electrode for signal acquisition is a hardware task. Classification and mental state decoding from EEG is a software task. In this paper we are discussing about some of the classifiers used in classifying EEG signal.
k-means Clustering: A.
centroids, serving as a prototype of the cluster. The clustering is done by minimizing the Euclidean distance between data and the corresponding cluster centroid. In this way k-mean clustering classifies the data into k clusters.
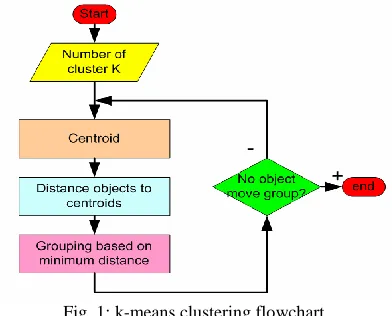
The method follows a simple and easy approach to classify a given data with n observations into k number of clusters as fixed initially. First, k centroids are defined one for each cluster. Initially centroids are assumed to be at a distance far from each other. Each point belonging to the given dataset is taken and associated with the nearest centroid. This step is repeated for each data point to obtain first level clustering. Now k new centroids are calculated. They are barycentre of the clusters resulting from the step before. After these k new centroids are obtained, a new iteration is done between the same data set points and the nearest new centroid. Due to the loop generated, one can notice that the k centroids change their location step by step until no more changes in centroid location occur.
Flowchart: 1)
Fig. 1: k-means clustering flowchart.
Algorithm: 2)
Iterative refinement technique The most common algorithm uses an. It is often called the k-means algorithm and also referred to as Lloyd's algorithm. Below are the steps for clustering:
1) Determine k initial centroid coordinates.
2) Obtain the distance between objects to the centroids by Euclidean distance method.
3) Find the closest centroid for each data point. Group the data point based on minimum Euclidean distance. 4) Iterate step 2 and 3 until no object move group.
5) If no of clusters is more than objects then each object coordinates are cluster centroids.
Fuzzy c-means clustering: B.
Fuzzy clustering is a classifier where data elements can belong to more than one cluster, and each element is associated with a set of membership levels. The membership values indicate the strength of the association between that data element and a particular cluster. Membership values are always between zero and one. Fuzzy clustering is a process of allotment of membership levels, and using them to assign data elements to one or more clusters. The Fuzzy C-Means (FCM) Algorithm is one of the widely used fuzzy clustering algorithms. It is developed by Dunn in 1973 and improved by Bezdek in 1981. It is frequently used in pattern recognition. The algorithm works by assigning membership to each data point corresponding to each cluster center on the basis of distance between the cluster and the data point. If the data is near to the cluster center its membership value is large. Summation of membership value of each data point should be equal to one. The algorithm is based on minimization of the following objective function:
∑ ∑ ‖ ‖
Where
m : Any real number greater than 1
uij : The degree of membership of xi in the cluster j
xi : The ith of dimensional measured data
cj : The d-dimension center of the cluster.
‖ ‖ : Norm expressing the similarity between any measured data and the center.
This iteration will stop when, maxij {| |} , where is a termination criterion between 0 and 1, whereas k are the
iteration steps. This procedure converges to a local minimum or a saddle point of Jm.
Fuzzy c-means has been a very important tool for image processing in clustering objects in an image. It is also used for cluster analysis of Plant and animal ecology, Transcriptomics, Human genetics. It is also used in the field of robotics and climatology.
NeuroIntelligence: C.
NeuroIntelligence is a neural networks software application designed to assist neural network, data mining, pattern recognition, and predictive modelling experts in solving real-world problems. It features only proven neural network modelling algorithms and neural net techniques; software is fast and easy-to-use. It can support all stages of neural net design and application. Software can be used to:
1) Analyze and pre-process datasets 2) Find the best neural network architecture 3) Train, test and optimize neural networks 4) Apply the designed neural net to new data
Steps for Classification: 1)
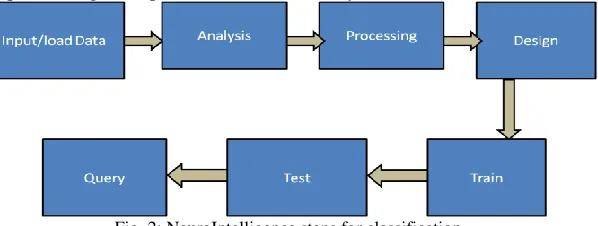
The usual sequence of steps to create and use a new network is as follows:
Click Open to load input dataset from a text file or Excel sheet.
Click Analyze to analyze dataset. In the Analysis window inspect results of automatic data analysis. Select Target column. If necessary, change data analysis options and analyze again or manually change column types and accept or reject columns or rows. In Analysis window inspect data partition results. If necessary, change data partition options and make automatic partition again or partition dataset manually.
Fig. 2: NeuroIntelligence steps for classification
Click Pre-process to perform data pre-processing. In the Pre-processing window inspect pre-processing results. If necessary, change pre-processing options and pre-process again.
Click Search Architecture to run automatic search for the best network architecture. In the Design window inspect the results of the architecture search. If necessary, change architecture search options and search again or manually select the desired number of hidden layers and units along with activation and error functions.
Click Train to train thoroughly the found network. In the Training windows inspect the training graph and in the Testing window inspect testing results. If necessary, jog weights or change training parameters and train again until acceptable results will be achieved. Save network and project, if you plan to use them later.
Click Query or Load Query File to query network with new data. In the Query window inspect querying results. Save querying results.
III.
C
ASE STUDYFig. 3: Sample recording of EEG Signal one each from set A and E
Nonlinear Time Series Measurements: A.
EEG is a nonlinear signal. So the non linear time series (NLTS) parameters are calculated. The parameters are approximate Entropy, Sample entropy, Fractal dimension and Hurst Exponent. Table 1 indicates the values some of the values extracted from EEG signal. The
Table1
Non linear parameters extracted from EEG signal
SubNo SaEn ApEn FD HE
Sub 1 0.426 0.262 1.162 0.445
Sub 2 0.690 0.334 1.208 0.521
Sub 3 0.573 0.315 1.214 0.432
Sub 4 0.583 0.249 1.108 0.402
Sub 5 0.488 0.256 1.000 0.479
Sub 6 0.949 0.402 1.241 0.627
Sub 7 0.862 0.365 1.219 0.685
Sub 8 1.030 0.437 1.262 0.677
Sub 9 1.020 0.435 1.328 0.711
Sub 10 0.915 0.389 1.244 0.642
Classification: B.
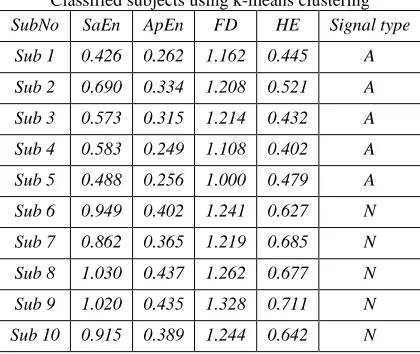
The obtained parameters are classified using k-means clustering method and fuzzy c means clustering methods mentioned above. The classification is done for 2 classes. They are “Normal (N)” and “Abnormal (N)”. Generally NTLS parameters decrease for abnormal signal. So a database for subject condition is created as in Table 2.
Table 2
Classified subjects using k-means clustering SubNo SaEn ApEn FD HE Signal type
Sub 1 0.426 0.262 1.162 0.445 A
Sub 2 0.690 0.334 1.208 0.521 A
Sub 3 0.573 0.315 1.214 0.432 A
Sub 4 0.583 0.249 1.108 0.402 A
Sub 5 0.488 0.256 1.000 0.479 A
Sub 6 0.949 0.402 1.241 0.627 N
Sub 7 0.862 0.365 1.219 0.685 N
Sub 8 1.030 0.437 1.262 0.677 N
Sub 9 1.020 0.435 1.328 0.711 N
Sub 10 0.915 0.389 1.244 0.642 N
IV.
R
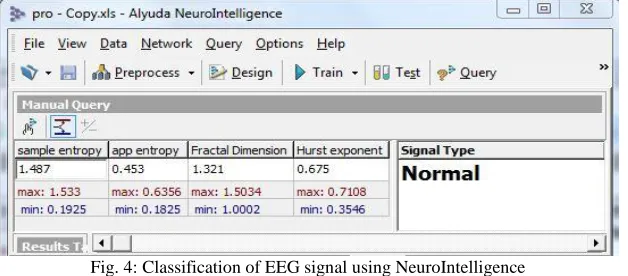
ESULTS AND CONCLUSIONAn unknown EEG signal is taken. The NLTS parameters are extracted using MATLAB code. The parameters are input to trained neural network in NeuroIntelligence query. The signal is classified whether it is normal or abnormal and output is displayed as shown in the fig 4. The Neural network is a widely used supervised classifier. The NLTS data set is clustered as Normal or Abnormal using k-means or FCM clustering methods. This clustered data set (shown in Table 2) is used to train neural network. When an unknown EEG signal is taken, first NLTS measurements are extracted and input to trained neural network to classify the EEG signal. This method of classification proposed is unique and is very easy to classify EEG signals.
Fig. 4: Classification of EEG signal using NeuroIntelligence
R
EFERENCE[1] Vairavan Srinivasan, Chikkannan Eswaran, and Natarajan Sriraam “Approximate Entropy-Based Epileptic EEG Detection Using Artificial Neural
Networks” IEEE TRANSACTIONS ON INFORMATION TECHNOLOGY IN BIOMEDICINE, VOL. 11, NO. 3, MAY 2010.
[2] D. Easwaramoorthy & R. Uthayakumar “Estimating the Complexity of Biomedical Signals by Multifractal Analysis” IEEE conference 2010.
[3] Yatindra Kumar, M.L Dewal and R.S Anand “Features Extraction of EEG Signals using Approximate and Sample Entropy” IEEE Conference on
Electrical, Electronics and Computer Science, 2012.
[4] Yuedong Song, Jon Crowcroft and Jiaxiang Zhang “Epileptic EEG Signal Analysis and Identification Based On Nonlinear Features ” IEEE
TRANSACTIONS ON INFORMATION TECHNOLOGY IN BIOMEDICINE, 2012.
[5] Sunita Soni and O.P.Vyas “FUZZY WEIGHTED ASSOCIATIVE CLASSIFIER: A PREDICTIVE TECHNIQUE FOR HEALTH CARE DATA
MINING” International Journal of Computer Science, Engineering and Information Technology, 2012.
[6] Yuan F, Meng Z. H, Zhang H. X and Dong C. R, "A New Algorithm to Get the Initial Centroids," IEEE, 3rd International Conference on Machine Learning
and Cybernetics, August 2004.
[7] Tapas Kanungo,, David M. Mount, Nathan S. Netanyahu, Christine D. Piatko, Ruth Silverman, and Angela Y. Wu, “An Efficient k-Means Clustering
Algorithm: Analysis and Implementation” IEEE TRANSACTIONS ON PATTERN ANALYSIS AND MACHINE INTELLIGENCE, JULY 2002.
[8] Gath, Geva A.B.“Unsupervised optimal fuzzy clustering” IEEE Transactions on Pattern Analysis and Machine Intelligence, 2002.
[9] BizopoulosP.A. Tsalikakis.D.G., Tzallas, A.T., Koutsouris, D.D. Fotiadis.D.I. “EEG epileptic seizure detection using k-means clusteringand marginal spectrum based on ensemble empirical mode decomposition” 2013 IEEE 13th International Conference on Bioinformatics and Bioengineering (BIBE), 2013.
[10] www.alyuda.com