Bagging Based Ensemble Classification Method on
Imbalance Datasets
1 Lukmanul Hakim; 2 Bagus Sartono; 3 Asep Saefuddin
1
Department of Statistics, Bogor Agricultural University Bogor, Indonesia
2
Department of Statistics, Bogor Agricultural University Bogor, Indonesia
3
Department of Statistics, Bogor Agricultural University Bogor, Indonesia
Abstract - In the last few years, the problem of class imbalances is a challenging problem in data mining community. The class imbalance occurs when one of the classes in the data has a larger number than others. That condition causing the classification being not optimum because the larger class gave more influences in the classification. Some cases of class imbalance issues become a very important thing, for example, to detect cheating in banking operations, network trouble, cancer diagnose, and prediction of technical failure. This study conducts a bagging based ensemble method to overcome the problem of class imbalance on 14 datasets. The purpose of this research is to see the ability of some bagging based ensemble methods on overcoming the class imbalance problem. The results obtained by using OverBagging method are more stable than other bagging based methods in various datasets.
Keywords - Ensemble, Boosting, Bagging, Class Imbalance, Classification
1.
Introduction
he last few years, the problem of class imbalances is a challenging problem in data mining community. The class imbalance occurs when one of the classes in the data has a larger number than others, the large number of instances called majority class and the small number of instances called minority classes [1]. For example in a data set consisting of two classes, the ratio of the number of instances in that class is 1: 100, 1: 1000 and or 1: 10,000 [2].
That condition causing the classification being not optimum because the larger class gave more influences in the classification[3]. In some cases, the information on such imbalances becomes very important. For example, detecting cheating in banking operations, detecting network disruptions[4], managing risks and predicting technical equipment failures[5].
There are some handling for imbalance class problems, according to [4], grouped into the three approaches: algorithm level, data level, and cost-sensitive learning. The algorithm level approach is done by creating or modifying the algorithm to account for a positive class or minority class. The data level approach is to add a sampling step
resampling at the preprocessing stage. Resampling balances the distribution of data to reduce the effects of imbalanced class distributions in the modeling process by performing several resampling methods such as oversampling is adding/replicating instances in minority classes or undersampling eliminating instances in the majority class, or a combination of both methods [6]. The cost-sensitive method is the approach done by combining algorithms and level data to incorporate classification cost errors of each class at the training sets [6].
This study focuses on the handling of imbalanced classes by using data level and ensemble learning. The ensemble is a method that combines several single classifications in order to obtain a more accurate classification model [6]. The Ensemble method is designed to improve the accuracy of a single classifier by training several different classifiers, the predicted results in each classifier combined with final predictions by the voting process[7].
process [8]. The following Graph 1 development of research using the method of bagging.
Fig. 1 Scientific work using the method of bagging
Graph 1 represents annually scientific work using the method of bagging always increases. This shows the high interest of someone who applies the bagging method in various cases. Bagging is an ensemble method introduced by Breiman in 1996 that is a combination bootstrap and aggregating, while the Boosting method is an ensemble pursuit method that can reduce variants, this is due to the average refractive effect of the ensemble to reduce the variant of a classification set [9]. According to [4] the level of data and ensemble learning is divided into three groups: Boosting-Based, Bagging-Based and the last Hybrid. This paper is a literature review that discusses imbalanced classes using bagging-based methods such as UnderBagging, OverBagging, UnderOverBagging, SMOTEBagging, Roughly Balanced Bagging and Bagging Ensemble Variation
2.
Sampling Technique
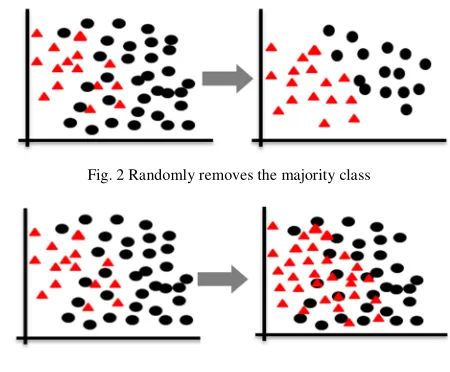
The sampling approach is a technique used without having to change the algorithm. This technique is commonly used to deal with unequal class issues. This technique alters the distribution of data or changes the dataset size from imbalanced to balanced [10]. The resampling process is done at the preprocessing stage, before the modeling process [6]. The sampling technique is divided into two parts: under sampling and over sampling [11]. Undersampling randomly removes instances of the majority class to balance the data, the lack of this technique is the loss of information on the data [12]. Figure 2 shows an example of an undersampling technique [5]. While oversampling is to add/replicate minority samples at random to obtain a balanced amount of data. The downside of this technique is that there will be overfitting because of a large amount of data generated [13]. Figure 3 shows an example of Oversampling technique [5].
Fig. 2 Randomly removes the majority class
Fig. 3 Increase the number of minority classes
3.
Bagging Based Ensembles
Bagging is an abbreviation of bootstrap aggregating, with bootstrap or sampling technique on the original data n times with replacement to create training sets [14]. Then each training data is made a classification tree and the aggregate process or the majority vote for the classification case and the average for regression case. Bagging is an ensemble method commonly applied to classification cases, with the aim of improving classification accuracy by combining single classifications, and the results are better than random sampling [15]. Bagging was able to reduce the classification error rate in the classification case with 50 repetitions for classification cases and 25 times for regression cases [16]. Below are some bagging methods combined with resampling techniques:
3.1.
UnderBagging (UB)
The UnderBagging method is a combination method of undersampling and bagging which was first introduced by Barandela [17] . Algorithm of UnderBagging is almost similar to the bagging ensemble algorithm that builds several bag from the training data and then diaggregated classification results. Each dataset contains all minority classes and the majority class is taken at random with or without replacement [18].
3.2.
OverBagging (OB)
algorithm. The difference between OverBagging and UnderBagging methods lies in the sampling of the data. OverBagging increases or adds minority classes using bootstrap process [19], while UnderBagging reduces the majority class by bootstrap process [20].
3.3.
SMOTEBagging (SBAG)
SMOTEBagging is a combination of algorithms from SMOTE and bagging that involves synthesis
generation data [19]. The Synthetic
Minority Oversampling Technique (SMOTE) combined with bagging is one of the first oversampling methods introduced by Chawla [21]. The oversampling method is the resampling method used to replicate / duplicate data randomly. The purpose of adding this data so that the number of minority classes is equivalent to the majority class. SMOTE is an oversampling method that works by creating "synthetic" data or generating artificial data. The resulting artificial data are generated based on the characteristics of the nearest object and k-neighbor (k-nearest neighbor).
3.4.
UnderOverBagging (UOB)
UnderOverBagging is a combination of algorithms from undersampling, oversampling and bagging, but the data generation process is not like the UnderBagging or OverBagging algorithm. The data generation process in UnderOverBagging is similar to SMOTEBagging [19]. This method uses two sampling techniques oversampling and undersampling technique, the resampling rate (a%) is set in each iteration (from 10% to 100%)
3.5.
Bagging Ensembles Variation (BEV)
Bagging ensemble variation is a member of UnderBagging which is a combination of sampling undersampling and bootstrap aggregating. The purpose of bagging ensemble variation is to overcome the difficulties in the process of classification, especially in the class that is not balanced with the various variations in the bag. Bagging ensemble variation was first introduced by Li [22] with the basic idea that maximizing minority class data without creating synthesis data or making changes to the classification system. Example if in a case there is an imbalanced class with a ratio of 20:80 is 20 is a minority class while the 80 is the majority class. The majority class is divided into 4 sections. Then, each section is inserted into a minority class so that the ratio of majority and minority data to 20:20 or 50%: 50%.
Fig. 4 Algorithm Bagging Ensemble Variation
3.1. Roughly Balanced Bagging (RBB)
Roughly balanced bagging is one of the new techniques in handling unbalanced classes. In addition, Roughly Balanced Bagging is part of UnderBagging technique first introduced by Hido and Kashima [23]. This technique is very effective in balancing the average of each class. Roughly Balanced Bagging is different from other bagging techniques. This method involves a negative binomial distribution to balance the class on imbalanced data, although basically the number of each class is different but is balanced on average. Basically, the Roughly Balanced Bagging method is part of the UnderBagging method so that minority sampling still adopts the principle of UnderBagging that takes the entire minority class. Then in the majority class is taken following a negative binomial distribution.
4.
Comparative Study
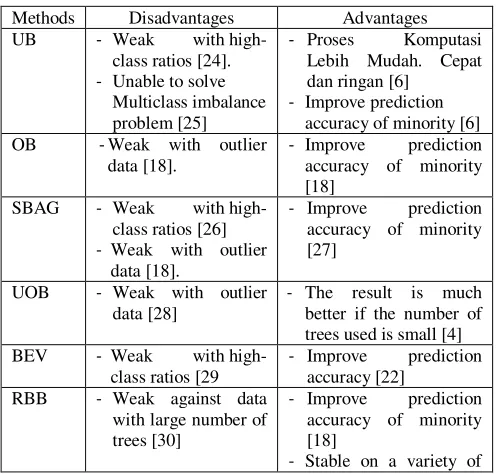
Table 1: describes the advantages and disadvantages of bagging-based methods derived from several scientific papers
Methods Disadvantages Advantages UB - Weak with
high-class ratios [24].
- Unable to solve Multiclass imbalance problem [25]
- Proses Komputasi Lebih Mudah. Cepat dan ringan [6]
- Improve prediction accuracy of minority [6] OB -Weak with outlier
data [18].
- Improve prediction accuracy of minority [18]
SBAG - Weak with high-class ratios [26]
- Weak with outlier data [18].
- Improve prediction accuracy of minority [27]
UOB - Weak with outlier data [28]
- The result is much better if the number of trees used is small [4] BEV - Weak with
high-class ratios [29
- Improve prediction accuracy [22]
RBB - Weak against data with large number of trees [30]
- Improve prediction accuracy of minority [18]
basic classifier [31]
- Stable at different levels of data diversity [31]
- Strong with outlier data [19]
5.
Methodology
We randomly choose 16 used benchmark data sets from the UCI repository eight extreme class data and eight data are not extreme. The data used are Santimage, Glass, Red Wine, Htru, Thiroyd, Ann Thiroyd, Letter-A, Car, Bank, Shuttle, Adult, Heart, Credit, Transfusion, Pima, White Wine. Extreme data category with majority class ratio of at least 90% while the data category not extreme with the ratio less 90%. The number of classes used in this study as much as 2 classes. Class with a small number used as a minority class or a positive class, while the class with a large number as a majority class or negative class. In a UCI Repository database of classes that are slightly used as a minority class, while the rest made the majority class. In this study the base classifier using classification tree on each method and then dividing data into two parts training sets and testing sets. Each class is taken up with 75% of training sets and 25% testing sets. After the data collected and then analyzed using software R with some packages such as ipred, adabag, rpart, ROSE and caret. Table 2 describes the information about characteristics of datasets.
Table 2: information about characteristics of dataset
Data Intance Attr Ratio Category
Bank 41188 21 89:11 Not Extrime Shuttle 43500 10 78:22 Not Extrime Adult 30162 15 75:25 Not Extrime Liver 583 11 71:29 Not Extrime Credit 30000 24 77:23 Not Extrime Transfussion 748 5 76:24 Not Extrime Pima 768 9 65:35 Not Extrime White wine 178 14 27:73 Not Extrime Santimage 4435 37 91:9 Extrime Red wine 1599 12 95:5 Extrime Thiroyd 2030 29 92:8 Extrime Ann thiroyd 3772 22 92:8 Extrime Letter-A 20000 17 94:6 Extrime Car 1792 5 93:7 Extrime Glass 214 11 96:4 Extrime Htru 17898 9 91:9 Extrime
The first step using undersampling and bagging techniques is UnderBagging, Roughly balanced Bagging and Bagging Ensemble Variation. This technique keeps all minority classes and takes randomly the majority class with the same amount as the minority class. Except on the Roughly Balanced Bagging method that takes the majority class
according to the negative binomial distribution. The second step uses Oversampling and bagging techniques like OverBagging and SMOTEBagging. This technique increases the number of classes in the majority class. The third step combines both Undersampling and Oversampling techniques like UnderOverBagging. This technique adds a majority class and reduces minority classes and the last step using Cart method as a benchmark method.
6.
Result
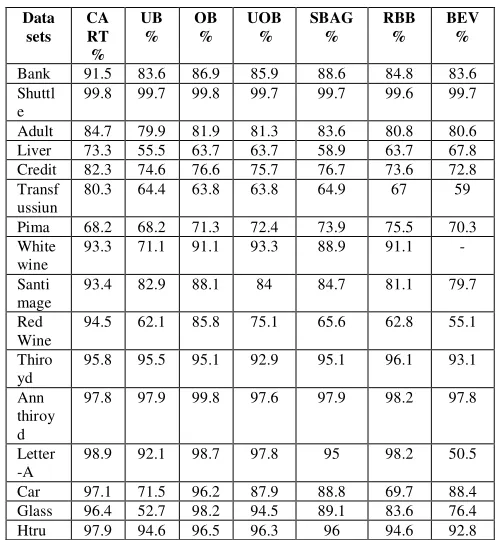
Table 3 shows the accuracy of each method. The highest average overall was found in the CART method and OverBagging method of 90.3% and 87.1%. While the lowest average was found in Bagging Ensemble Variation and UnderBagging method of 77.8% and 77.9%. Besides the UnderOverBagging method is still better if compared with Roughly Balanced Bagging method and SMOTEBagging. In the white wine data Bagging Ensemble Variation method is not able to give the final prediction because the number of trees that formed as much as 2 trees and have the same opportunities. This is a lack of the Bagging Ensemble Variation method. The highest average accuracy in extreme data is found in the CART method and OverBagging, and then Bagging Ensemble Variation method has the lowest average in extreme data. The highest average for not-extreme data is found in the CART method while the bagging method has a similar average.
Table 3: information about prediction accuracy on each data
Data sets
CA RT
% UB
% OB
% UOB
%
SBAG %
RBB %
BEV %
Bank 91.5 83.6 86.9 85.9 88.6 84.8 83.6 Shuttl
e
99.8 99.7 99.8 99.7 99.7 99.6 99.7
Adult 84.7 79.9 81.9 81.3 83.6 80.8 80.6 Liver 73.3 55.5 63.7 63.7 58.9 63.7 67.8 Credit 82.3 74.6 76.6 75.7 76.7 73.6 72.8 Transf
ussiun
80.3 64.4 63.8 63.8 64.9 67 59
Pima 68.2 68.2 71.3 72.4 73.9 75.5 70.3 White
wine
93.3 71.1 91.1 93.3 88.9 91.1 -
Santi mage
93.4 82.9 88.1 84 84.7 81.1 79.7
Red Wine
94.5 62.1 85.8 75.1 65.6 62.8 55.1
Thiro yd
95.8 95.5 95.1 92.9 95.1 96.1 93.1
Ann thiroy d
97.8 97.9 99.8 97.6 97.9 98.2 97.8
Letter -A
98.9 92.1 98.7 97.8 95 98.2 50.5
Av. 90.3 77.9 87.1 85.1 84.2 82.5 77.8
Av. E 96.5 81.2 94.8 90.8 89 85.5 79.2
Av. Not E
84.2 74.6 79.4 79.5 79.4 79.5 76.3
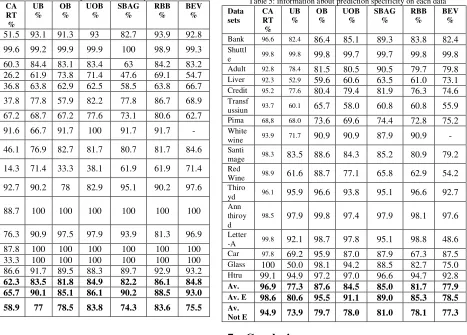
The best method is not only seen on the value of accuracy but rather the value of its sensitivity. Table 4 shows the highest overall sensitivity value found in Roughly Balanced Bagging method of 86.1%, and other bagging methods have almost the same value. While the CART method as a whole is not able to guess the minority class correctly on extreme data and not extreme. The highest sensitivity values for extreme data are in Bagging Ensemble Variation, SMOTEBagging and UnderBagging methods of 92.0%, 90.2%, and 90.1%. The highest average value of non-extreme data is found in UnderOverBagging and Roughly Balanced Bagging methods
Table 4: information about prediction sensitivity on each data Data
sets CA RT
% UB
% OB
% UOB
%
SBAG %
RBB %
BEV %
Bank 51.5 93.1 91.3 93 82.7 93.9 92.8
Shuttl
e 99.6 99.2 99.9 99.9 100 98.9 99.3 Adult 60.3 84.4 83.1 83.4 63 84.2 83.2
Liver 26.2 61.9 73.8 71.4 47.6 69.1 54.7
Credit 36.8 63.8 62.9 62.5 58.5 63.8 66.7
Transf
ussiun 37.8 77.8 57.9 82.2 77.8 86.7 68.9 Pima 67.2 68.7 67.2 77.6 73.1 80.6 62.7
White
wine 91.6 66.7 91.7 100 91.7 91.7 - Santi
mage 46.1 76.9 82.7 81.7 80.7 81.7 84.6 Red
Wine 14.3 71.4 33.3 38.1 61.9 61.9 71.4 Thiro
yd 92.7 90.2 78 82.9 95.1 90.2 97.6 Ann
thiroy d
88.7 100 100 100 100 100 100
Letter
-A 76.3 90.9 97.5 97.9 93.9 81.3 96.9 Car 87.8 100 100 100 100 100 100
Glass 33.3 100 100 100 100 100 100
Htru 86.6 91.7 89.5 88.3 89.7 92.9 93.2
Av. 62.3 83.5 81.8 84.9 82.2 86.1 84.8
Av. E 65.7 90.1 85.1 86.1 90.2 88.5 93.0
Av.
Not E 58.9 77 78.5 83.8 74.3 83.6 75.5
Table 3 and Table 4 show the accuracy and sensitivity values for each method, then Table 5 shows the specificity values that describe the method's ability to predict the majority class. The highest average overall specificity values were found in the CART method and OverBagging
method of 96.9% and 87.6%. So too on the extreme data the method with the highest average value of specificity found in the same method of CART and OverBagging. On the data that is not extreme the highest specificity is found in the CART method and the SMOTEBagging method. While the value with the lowest overall level of specificity is found in UnderBagging method and Bagging Ensemble Variation method of 77.3% and 77.9%. The lowest specificity on extreme data was found in Bagging Ensemble Variation and UnderBagging methods of 78.5% and 80.6%. The last of the lowest specificity on not-extreme data was found in the same method of UnderBagging and Bagging Ensemble Variation of 73.9% and 77.3%.
Table 5: information about prediction specificity on each data Data
sets CA RT
% UB
% OB
% UOB
%
SBAG %
RBB %
BEV %
Bank 96.6 82.4 86.4 85.1 89.3 83.8 82.4
Shuttl
e 99.8 99.8 99.8 99.7 99.7 99.8 99.8 Adult 92.8 78.4 81.5 80.5 90.5 79.7 79.8
Liver 92.3 52.9 59.6 60.6 63.5 61.0 73.1
Credit 95.2 77.6 80.4 79.4 81.9 76.3 74.6
Transf
ussiun 93.7 60.1 65.7 58.0 60.8 60.8 55.9 Pima 68,8 68.0 73.6 69.6 74.4 72.8 75.2
White
wine 93.9 71.7 90.9 90.9 87.9 90.9 - Santi
mage 98.3 83.5 88.6 84.3 85.2 80.9 79.2 Red
Wine 98.9 61.6 88.7 77.1 65.8 62.9 54.2 Thiro
yd 96.1 95.9 96.6 93.8 95.1 96.6 92.7 Ann
thiroy d
98.5 97.9 99.8 97.4 97.9 98.1 97.6
Letter
-A 99.8 92.1 98.7 97.8 95.1 98.8 48.6 Car 97.8 69.2 95.9 87.0 87.9 67.3 87.5
Glass 100 50.0 98.1 94.2 88.5 82.7 75.0
Htru 99.1 94.9 97.2 97.0 96.6 94.7 92.8
Av. 96.9 77.3 87.6 84.5 85.0 81.7 77.9
Av. E 98.6 80.6 95.5 91.1 89.0 85.3 78.5
Av.
Not E 94.9 73.9 79.7 78.0 81.0 78.1 77.3
7.
Conclusion
overall value of specificity in the CART method is superior to that of the bagging method. This illustrates that the CART method is not able to predict the minority class well. The OverBagging method is a stable method for various datasets in both extreme and non-extreme classes. However, OverBagging method takes a long time in computing process. Another stable method is the Roughly Balanced Bagging method because the Roughly Balanced Bagging method as a whole is able to predict the minority class better when compared to other methods except in the extreme data Bagging Ensemble Variation is better when compared with the method of Roughly Balanced Bagging. But the Bagging Ensemble Variation not incapable of predicting trees with equal number of opportunities. The UnderBagging and SMOTEBagging methods have the same capabilities on many datasets. Although the computation of UnderBagging method is faster than SMOTEBagging. The UnderOverBagging method is between the UnderBagging and OverBagging methods. Probably because this method combines both sampling techniques. Overall method of bagging with the worst performance when compared with other methods of UnderBagging and SMOTEBagging methods.
References
[1] Ramyachitra D. Manikanda P, “ Imbalanced Dataset Classification And Solutions: A Review” International Journal of Computing and Business Research (IJCBR). Vol.5, issue.4, pp. 12-23, 2014.
[2] Shaza M Abd Elrahman1 and Ajith Abraham, “A Review of Class Imbalance Problem” Journal of Network and Innovative Computing. Vol. 1, pp. 332-340, 2013. [3] Nitesh V. Chawla, Nathalie Japkowicz, Aleksander Ko
lcz, “Special Issue on Learning from Imbalanced Data Sets” SIGKDD Explor. Newsl. Vol. 6, pp. 1-6, 2004. [4] Mikel Galar,Fransico, “A review on Ensembles for the
class Imbalance Problem: Bagging,Boosting and Hybrid-Based Approaches” IEEE Transactions On Systems, Man, And Cybernetics—Part C: Application And Reviews, Vol.42,No.4 July 2012.
[5] Rushi Longadge, 2 Snehlata S. Dongre, Latesh Malik “Class Imbalance Problem in Data Mining: Review” International Journal of Computer Science and Network (IJCSN). Vol.2, pp. 83-88, 2013.
[6] Yuliana Permatasari, “Penanganan Masalah Kelas Tidak Seimbang dengan RUSBoost dan UnderBagging (Studi Kasus: Mahasiswa Drop Out SPs IPB Program Magister)” Thesis, Bogor Agriculture University: Bogor. [7] Lior Rokach, “. Ensemble-based classifiers” Artif. Intell.
Vol. 33, 1-39, 2010.
[8] Eric Bauer and Ron Kohavi, “An Empirical Comparison of Voting Classification Algorithms: Bagging, Boosting and Variants” Kluwer Academic Publishers. Boston. Manufactured in The Netherland. Vol. 36, pp. 15-139, 1999.
[9] Achmad Bisri and Romi Satria Wahono, “Penerapan Adaboost untuk Penyelesaian Ketidakseimbangan Kelaspada Penentuan Kelulusan Mahasiswa dengan Metode Decision Tree. Journal of Intelligent Systems. Vol 1, pp. 27-32, 2015.
[10] Rozianiwati Yusof , Khairul Azhar Kasmiran, Aida Mustapha, Norwati Mustapha, Nor Asma Mohd Zin, “Techniques For Handling Imbalanced Datasets When Producing Classifier Models” Journal of Theoretical and Applied Information Technology, Vol. 95, pp. 1425-1440, 2017.
[11] Zhongbin Sun, QinbaoSong, XiaoyanZhu, HeliSun, BaowenXu , YumingZhou, “A novel ensemble method for classifying imbalanced data” Pattern Recognition, Vol. 48, pp. 1623-1637, 2015.
[12] Yubin Park, Member and Joydeep Ghosh, “ Ensembles of α-Trees for Imbalanced Classification Problems” Journal Of Latex Class Files, Vol. 6, pp. 1-14. 2007.
[13] Sergio Gónzalez a, Salvador García, Marcelino Lázaro , Aníbal R. Figueiras-Vidal and Francisco Herrera, “Class Switching according to Nearest Enemy Distance for learning from highly imbalanced data-sets” Science direct. Vol.70, pp. 12-24, 2017.
[14] Bradley Efron and Robert J. Tibshirani, “An Introduction to the Bootstrap” Chapman & Hall. New York, 1993. [15] Esteban Alfaro, Matias Gamez and Noelia García, “An R
Package for Classification with Boosting and Bagging”, Journal of Statistical Software Vol.54, issue. 32, pp. 11-35, 2013.
[16] L. Breiman” Bagging Predictors”, Machine Learning. Vol. 24, pp. 123-140, 1996.
[17] R. Barandela, R. M. Valdovinos, and J. S. S´anchez, “New applications of ensembles of classifiers,” Pattern Anal. App, Vol. 6, pp. 245–256, 2003.
[18] J. Blaszczynski , J. Stefanowski, Szajek, ”Local Neighbourhood in Generalizing Bagging for Imbalanced Data”, COPEM ECML-PKKD. Workshop Proceedings. Solving Complex Machine Learning Problems with Ensemble Methods.2013.
[19] S.Wang and X. Yao, “Diversity analysis on imbalanced data sets by using ensemble models,” in IEEE Symp. Comput. Intell. Data Mining, pp. 324–331, 2009.
[20] Y.Liu, NV. Chawla, M.Harper, E. Shriberg and A.Stolcke, “A Study in Machine Learning from Imbalanced Data for Sentence Boundary Detection in Speech” Computer Speech and Language (20): pp. 468–494, 2006.
[21] NV.Chawla, KW. Bowyer, LO. Hall and WP.Kegelmeyer,”SMOTE:synthetic minority over-sampling technique”, Journal of Artifical Intelligence Research, vol. 16, pp. 341–378, 2002.
[23] S. Hido, H. Kashima, and Y. Takahashi, “Roughly balanced bagging for imbalanced data”, Stat. Anal. Data Min, Vol. 2, pp. 412–426, 2009.
[24] AD. Lynam, “Prediction of Oestrus in Dairy Cows: An Application of Machine Learning to Skewed Data”, Degree of Master of Science at the University of Waikato, 2009.
[25] Z. Zhang, B. Krawczyk , S. Garcia, AR. Perez and F. Herrera, “Empowering One-vs-One Decomposition with Ensemble Learning for Multi-Class Imbalanced Data”, Knowledge-Based Systems. Vol. pp. 106, 251–263, 2016.
[26] B. Krawczyk, M. Wozniak and G. Schaefer, “Cost-sensitive decision tree ensembles for effective imbalanced classification”, Applied Soft Computing. Vol. 14, pp. 554-562, 2014.
[27] L. Peng, H. Zhang, Y. Chen and B. Yang, “Imbalanced Traffic Identification Using an Imbalanced Data Gravitation-based Classification Model”, Computer Communications. Vol. 102, pp. 177-189, 2017.
[28] FJD. Pintor, MJF. Gomes, A. Troncoso and FM. Alvarez, “A New Methodology Based on Imbalanced Classification for Predicting Outliers in Electricity Demand Time Series”, Article Energies, pp. 1-10, 2016. [29] Yi Wang and Zhiguo Gong, “Hierarchical Classification
of Web Pages Using Support Vector Machine” , International Conference on Asian Digital Libraries, pp 12-21, 2008.
[30] Mateusz Lango and Jerzy Stefanowski, “Multi-class and feature selection extensions of Roughly Balanced Bagging for imbalanced data ”, Journal of Intelligent Information Systems, Vol. 49, Issue. 141, pp. 1-31, 2017.
[31] Mateusz Lango and Jerzy Stefanowski, “Applicability of Roughly Balanced Bagging for Complex Imbalanced Data”, Proceedings of the 4th Workshop on New Frontiers in Mining Complex Patterns (NFMCP), pp. 62-73. 2015.
Mr. L. Hakim master student in Department of Statistics, Bogor Agricultural University. His main interests is on data mining and bioinformatics.
Dr. B. Sartono Currently worked as a lecture in Department of Statistics, Bogor Agricultural University. His main interests is on data mining and experimental design.