Table 1. Input and output summary statistics for 25 rice producing provinces in Cambodia, 2012-2015
1
Variable
2012
2013
2014
2015
Mean S.E. Mean S.E. Mean S.E. Mean S.E.
Output
Rice quantity1 (tons) 290,808 52,994 329,872 60,296 391,150 80,437 315,270 57,785 Inputs
Land2 (hectares) 134,629 23,192 144,944 25,893 212,785 56,497 145,685 26,699
Labor3 (persons) 168,703 27,044 163,805 26,208 160,163 25,683 155,159 24,486
Fertilizer4 (tons) 74,061 13,236 75,027 13,300 160,043 13,436 79,038 13,618
Pesticide5 (tons) 45,116 9,610 47,926 10,021 52,205 10,596 56,117 11,047
Machinery6 (units) 10,196 1,937 12,213 2,135 14,569 2,394 16,762 2,675
Source: Measured by Ms. Excel 2016 using combined datasets of RGC [32, 33]. “S.E.” = Standard Error.
2
1 Rice quantity was the total provincial un-milled rice production output quantity, measured in tons
2 Land input was the total area of rice actually harvested within the year (included both in wet and dry season), measured in hectares 3 Labor input measured as total farmers in the province with rice farming as primary occupation, unit in persons
4 Fertilizer input was total amount of chemical and organic fertilizers’ quantity using by total rice families in the province, unit in tons 5 Pesticide input measured as total amount of chemical and organic poisons for insects and grass’s quantity using by total rice families in
the province, unit in tons
6 Machinery measured the capital investment on agricultural machineries was the total amount of tractors, walking tractors (koryons), and
rice transplanting machines existing in the provincial territory, unit in units
Table 1. Input and output summary statistics for 25 rice producing provinces in Cambodia, 2012-2015
1
Variable
2012
2013
2014
2015
Mean S.E. Mean S.E. Mean S.E. Mean S.E.
Output
Rice quantity1 (tons) 290,808 52,994 329,872 60,296 391,150 80,437 315,270 57,785 Inputs
Land2 (hectares) 134,629 23,192 144,944 25,893 212,785 56,497 145,685 26,699
Labor3 (persons) 168,703 27,044 163,805 26,208 160,163 25,683 155,159 24,486
Fertilizer4 (tons) 74,061 13,236 75,027 13,300 160,043 13,436 79,038 13,618
Pesticide5 (tons) 45,116 9,610 47,926 10,021 52,205 10,596 56,117 11,047
Machinery6 (units) 10,196 1,937 12,213 2,135 14,569 2,394 16,762 2,675
Source: Measured by Ms. Excel 2016 using combined datasets of RGC [32, 33]. “S.E.” = Standard Error.
2
1 Rice quantity was the total provincial un-milled rice production output quantity, measured in tons
2 Land input was the total area of rice actually harvested within the year (included both in wet and dry season), measured in hectares 3 Labor input measured as total farmers in the province with rice farming as primary occupation, unit in persons
4 Fertilizer input was total amount of chemical and organic fertilizers’ quantity using by total rice families in the province, unit in tons 5 Pesticide input measured as total amount of chemical and organic poisons for insects and grass’s quantity using by total rice families in
the province, unit in tons
6 Machinery measured the capital investment on agricultural machineries was the total amount of tractors, walking tractors (koryons), and
1
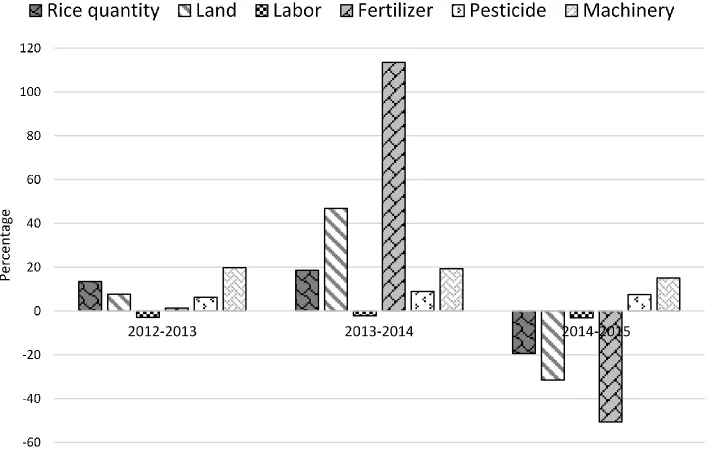
Figure 1. Percentage changes in input and output statistics for 25 rice producing provinces in Cambodia for the
2
periods 2012-2013, 2013-2014, and 2014-2015
Table 1. Descriptive statistics of factors affecting the efficiency of rice production in Cambodia, 2012-2015
1
Variable
2012
2013
2014
2015
Mean S.E. Mean S.E. Mean S.E. Mean S.E.
Disaster1 18.86 12.34 5.16 1.12 30.98 26.37 5.20 1.16
Irrigation2 21.70 3.49 22.75 3.52 19.94 3.58 22.64 3.54
Production technique3 3.04 0.48 2.79 0.47 2.74 0.42 2.44 0.37
Distant info-source4 14.92 1.53 14.86 1.22 14.67 1.14 15.01 1.20
Supporting staffs5 0.11 0.03 0.10 0.02 0.09 0.02 0.09 0.02
Dry-season prod.6 68.47 5.72 58.76 6.33 65.12 5.89 64.91 6.43
Small-land farmers7 41.80 3.17 40.99 3.43 40.35 3.45 39.76 3.67
Source: Measured by Ms. Excel 2016 using combined datasets of RGC [32, 33]. “S.E.” = Standard Error.
2
1 Disaster measured as percentage of rice land damaged by floods, droughts, and insects to total rice actual harvested land within the year
2 Irrigation measured as percentage of provincial paddy land having or benefit from irrigation systems as well as paddy land located near
water sources to total provincial cultivated land within the year.
3 Production technique measured as percentage of families cultivating rice under the SRI system to total rice cultivated families
4 Distant to information sources measured as average distance from village center to the center of district/khan (in kilometers)
5 Agricultural supporting staffs measured as percentage of agricultural staffs included both government officers and NGOs staffs (working
on agricultural plans or projects) to total rice farmers existing in the province
6 Dry-season production measured as percentage of paddy land actually harvested during dry season to the total available cultivated land
for rice cultivation during dry season
7 Small-land farmers measured as percentage of families having paddy land smaller than one hectare altogether with families having no
paddy land to total rice families (i.e. families cultivating rice)
2
Table 1. Descriptive statistics of factors affecting the efficiency of rice production in Cambodia, 2012-2015
1
Variable 2012 2013 2014 2015
Mean S.E. Mean S.E. Mean S.E. Mean S.E.
Disaster1 18.86 12.34 5.16 1.12 30.98 26.37 5.20 1.16
Irrigation2 21.70 3.49 22.75 3.52 19.94 3.58 22.64 3.54
Production technique3 3.04 0.48 2.79 0.47 2.74 0.42 2.44 0.37
Distant info-source4 14.92 1.53 14.86 1.22 14.67 1.14 15.01 1.20
Supporting staffs5 0.11 0.03 0.10 0.02 0.09 0.02 0.09 0.02
Dry-season prod.6 68.47 5.72 58.76 6.33 65.12 5.89 64.91 6.43
Small-land farmers7 41.80 3.17 40.99 3.43 40.35 3.45 39.76 3.67
Source: Measured by Ms. Excel 2016 using combined datasets of RGC [32, 33]. “S.E.” = Standard Error.
2
1Disaster measured as percentage of rice land damaged by floods, droughts, and insects to total rice actual harvested land within the year 2Irrigation measured as percentage of provincial paddy land having or benefit from irrigation systems as well as paddy land located near
water sources to total provincial cultivated land within the year.
3Production technique measured as percentage of families cultivating rice under the SRI system to total rice cultivated families 4Distant to information sources measured as average distance from village center to the center of district/khan (in kilometers)
5Agricultural supporting staffs measured as percentage of agricultural staffs included both government officers and NGOs staffs (working
on agricultural plans or projects) to total rice farmers existing in the province
6Dry-season production measured as percentage of paddy land actually harvested during dry season to the total available cultivated land
for rice cultivation during dry season
7Small-land farmers measured as percentage of families having paddy land smaller than one hectare altogether with families having no
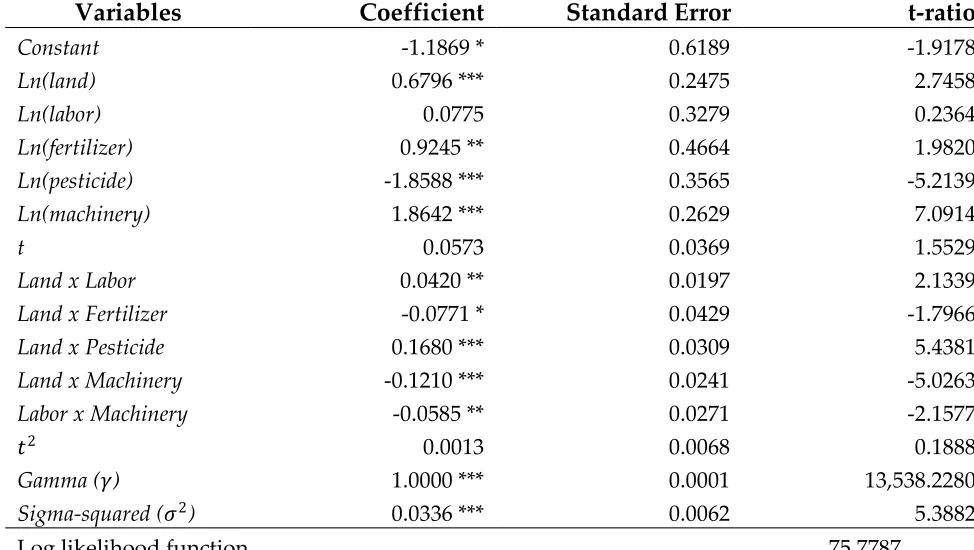
Table 1. Parameter estimates of SFA model
1
Variables
Coefficient
Standard Error
t-ratio
Constant
-1.1869 *
0.6189
-1.9178
Ln(land)
0.6796 ***
0.2475
2.7458
Ln(labor)
0.0775
0.3279
0.2364
Ln(fertilizer)
0.9245 **
0.4664
1.9820
Ln(pesticide)
-1.8588 ***
0.3565
-5.2139
Ln(machinery)
1.8642 ***
0.2629
7.0914
t
0.0573
0.0369
1.5529
Land x Labor
0.0420 **
0.0197
2.1339
Land x Fertilizer
-0.0771 *
0.0429
-1.7966
Land x Pesticide
0.1680 ***
0.0309
5.4381
Land x Machinery
-0.1210 ***
0.0241
-5.0263
Labor x Machinery
-0.0585 **
0.0271
-2.1577
𝑡
20.0013
0.0068
0.1888
Gamma (
𝛾
)
1.0000 ***
0.0001
13,538.2280
Sigma-squared (
𝜎
2)
0.0336 ***
0.0062
5.3882
Log likelihood function
75.7787
Source: Estimated by FRONTIER 4.1c. * indicates significant at 10%, ** significant at 5%, and *** at 1%.
2
Table 1. Input elasticities of rice production in Cambodia, 2012-2015
1
Year
Ln(land)
Ln(labor)
Ln(fertilizer) Ln(pesticide) Ln(machinery)
2012
0.9898
0.0465
0.0569
0.0317
-0.1701
2013
0.9816
0.0340
0.0559
0.0339
-0.1709
2014
0.9694
0.0248
0.0537
0.0386
-0.1729
2015
0.9632
0.0156
0.0551
0.0356
-0.1687
Source: Calculated by Ms. Excel 2016
2
1
Figure 1. Distribution of Technical Efficiency
Table 1. Regional technical efficiency of rice production in Cambodia, 2012-2015
1
Regions
2012
2013
2014
2015
TE Change (%)
M
S.E.
M
S.E.
M
S.E.
M
S.E.
12-13 12-14 12-15Phnom Penh
0.83
0.00
0.84
0.00
0.81
0.00
0.61
0.00
1.2
-3.4
-26.5
Tonle Sap plain
10.81
0.05
0.87
0.04
0.71
0.05
0.77
0.04
6.8
-12.4
-5.4
Mekong plain
20.86
0.07
0.89
0.10
0.88
0.07
0.88
0.07
3.2
2.6
2.2
Mekong plateau
30.79
0.04
0.79
0.04
0.74
0.06
0.70
0.06
0.0
-6.7
-11.3
Mountain
40.66
0.09
0.76
0.08
0.63
0.09
0.53
0.09
14.6
-5.7
-19.7
Coastal
50.81
0.07
0.84
0.06
0.86
0.09
0.79
0.08
4.7
6.3
-2.0
Cambodia
0.80
0.03
0.84
0.03
0.76
0.03
0.74
0.03
5.4
-3.9
-6.9
Source: Estimated by FRONTIER 4.1c; “M” = Mean; “S.E.” = Standard Error; “12-13” = TE change between 2012
2
and 2013; “12-14” = TE change between 2012 and 2014; “12-15” = TE change between 2012 and 2015
3
1 Tonle Sap plain region included the province of Banteay Meanchey, Battambang, Kampong Chhnang, Kampong Thom, Pailin, Pursat,
and Siem Reap. Total area: 61,510 km² (accounted for 34.54% of the total area)
2 Mekong plain included the province of Kampong Speu, Kandal, Prey Veng, Svay Rieng, and Takéo. Total area: 21,997 km² (12.35%)
3 Mekong plateau included the province of Kampong Cham, Kratié, Stung Treng, and Tbong Khmoum. Total area: 31,663 km² (17.78%)
4
Mountain region included the province of Mondulkiri, Ratanakiri, Preh Vihear, and Oddar Meanchey. Total area: 45,016 km² (25.28%)
5 Coastal region included the province of Kampot, Koh Kong, Kep, and Preah Sihanouk. Total area: 17,237 km² (9.68%)
Table 1. Regional technical efficiency of rice production in Cambodia, 2012-2015
1
Regions
2012
2013
2014
2015
TE Change (%)
M
S.E.
M
S.E.
M
S.E.
M
S.E.
12-13 12-14 12-15Phnom Penh
0.83
0.00
0.84
0.00
0.81
0.00
0.61
0.00
1.2
-3.4
-26.5
Tonle Sap plain
10.81
0.05
0.87
0.04
0.71
0.05
0.77
0.04
6.8
-12.4
-5.4
Mekong plain
20.86
0.07
0.89
0.10
0.88
0.07
0.88
0.07
3.2
2.6
2.2
Mekong plateau
30.79
0.04
0.79
0.04
0.74
0.06
0.70
0.06
0.0
-6.7
-11.3
Mountain
40.66
0.09
0.76
0.08
0.63
0.09
0.53
0.09
14.6
-5.7
-19.7
Coastal
50.81
0.07
0.84
0.06
0.86
0.09
0.79
0.08
4.7
6.3
-2.0
Cambodia
0.80
0.03
0.84
0.03
0.76
0.03
0.74
0.03
5.4
-3.9
-6.9
Source: Estimated by FRONTIER 4.1c; “M” = Mean; “S.E.” = Standard Error; “12-13” = TE change between 2012
2
and 2013; “12-14” = TE change between 2012 and 2014; “12-15” = TE change between 2012 and 2015
3
1 Tonle Sap plain region included the province of Banteay Meanchey, Battambang, Kampong Chhnang, Kampong Thom, Pailin, Pursat,
and Siem Reap. Total area: 61,510 km² (accounted for 34.54% of the total area)
2 Mekong plain included the province of Kampong Speu, Kandal, Prey Veng, Svay Rieng, and Takéo. Total area: 21,997 km² (12.35%)
3 Mekong plateau included the province of Kampong Cham, Kratié, Stung Treng, and Tbong Khmoum. Total area: 31,663 km² (17.78%)
4 Mountain region included the province of Mondulkiri, Ratanakiri, Preh Vihear, and Oddar Meanchey. Total area: 45,016 km² (25.28%)
5 Coastal region included the province of Kampot, Koh Kong, Kep, and Preah Sihanouk. Total area: 17,237 km² (9.68%)
Table 1. Rice production technical inefficiency model parameters estimation
1
Variables
Coefficient
Std. Error
t-ratio
Constant
0.9241 ***
0.1484
6.2261
Disaster
0.0003
0.0005
0.5641
Irrigation
-0.0119 ***
0.0026
-4.5368
Production technique
-0.0841 ***
0.0283
-2.9688
Distant to information sources
-0.0052
0.0060
-0.8703
Agricultural supporting staffs
-0.9530 **
0.4032
-2.3635
Dry-season production
-0.0016
0.0016
-1.0549
Small-land farmers
-0.0007
0.0036
-0.2056
Source: Estimated by FRONTIER 4.1c. * indicates significant at 10%, ** significant at 5%, and *** at 1%.
2