Published online October 16, 2014 (http://www.sciencepublishinggroup.com/j/ijmea) doi: 10.11648/j.ijmea.s.2015030101.18
ISSN: 2330-023X (Print); ISSN: 2330-0248 (Online)
Flow numerical simulation in various technologies
Karel Adamek
1, Pavel Peukert
1, Jan Kolar
1, Jozef Kaniok
2, Jaroslav Pelant
3, Martin Kyncl
3,
Jirí Storek
4, Marcel Havrda
51VUTS – Centre of Machinery Research, Liberec, Czech Rep
2TUL – Technical University in Liberec, Faculty of Textiles, Liberec, Czech Rep
3VZLU – Aeronautical Research and Testing Institute, Prague, Czech Rep 4RIETER CZ – Ustí Nad Orlicí, Czech Rep
5BRANO – Jablonec Nad Nisou, Czech Rep
Email address:
[email protected] (K. Adamek), [email protected] (P. Peukert), [email protected] (J. Kolar), [email protected] (J. Pelant), [email protected] (M. Kyncl), [email protected] (J. Kaniok), [email protected] (J. Storek), [email protected] (M. Havrda)
To cite this article:
Karel Adamek, Pavel Peukert, Jan Kolar, Jozef Kaniok, Jaroslav Pelant, Martin Kyncl, Jirí Storek, Marcel Havrda. Flow Numerical Simulation in Various Technologies. International Journal of Mechanical Engineering and Applications. Special Issue: Moving Forward to Monitory Democracy: Citizens Engagement in Scrutinizing Election Process in Indonesian 2014 General Election. Vol. 3, No. 1-1, 2015, pp. 47-52. doi: 10.11648/j.ijmea.s.2015030101.18
Abstract:
This paper summarizes some examples of applications of flow numerical simulations in the area of various textile technologies and equipment, as for instance application of vortex tube, fibers production from melted polymer, chemical yarn texturizing by air flow, high-speed bearing. The examples are completed by cases from car industry – independent heater, cavitation in shock absorber.Keywords:
Flow Numerical Simulation, High-Speed Bearing, Melt-Blown, Vortex Tube, Yarn Texturizing, Cavitation, Independent Heater1. Introduction
This article summarizes some examples of applications of numerical flow simulations in various technologies and equipment. In general, the used numerical simulation replaces expensive and time-consuming experiments during the development of new equipment or verification of new hypothesis. The text is divided into two parts – using the air and using combustion.
2. Air Applications
2.1. Vortex Tube
During technological trials with so-called vortex spinning, the strange effect was observable, well-known from the so-called Rank-Hilsch tube or vortex tube [1], etc. The compressed air after its expansion from tangential inlets is divided into two axial flows in such a way so that from one axial outlet is flowing warmer air, comparing with the opposite axial inlet of colder air. Temperature differences were observable of some tenths of °C. The
necessary condition of this effect is the observance of some rules for dimensions and cross sections.
For the spinning of textile material it is necessary to keep some range of both air temperature and humidity, to get an optimum process. The observed temperature differences can adversely affect the mechanical properties of processed textile material and so decrease the product quality, process reliability, etc. Another positive effect is possible heating or cooling by air flow, but in general, the efficiency of the process is not too high. As an information, only, Fig. 2.1-1 to Fig. 2.1-4 show step by step the streamlines colored by temperature and the fields of the static pressure, static temperature and velocity.
Figure 2.1-2. Static pressure
Figure 2.1-3. Static temperature
Figure 2.1-4. Velocity
2.2. Melt-Blown Technology
This technology is used for the production of nonwovens from melted polymer by blow-up in air flow. The product is used as thermal insulations or filtering materials [2]. The principal scheme is visible from Fig. 2.2-1.
The device consists from the wedge with a row of small orifices for melted polymer, situated in the wedge tip. The hot compressed air is supplied through flat nozzles, situated along the wedge sides. By the interactions of melted polymer with air flow there arises a nonwoven layer, transported for next treating.
The quality product, it means the nonwoven layer of uniform and fine fibers, but in absolutely random distribution, without empty or thick areas, is reached by a suitable combination of several parameters – wedge angle, nozzle width, nozzle position towards the wedge tip, air pressure and temperature, etc. Comparing temperature and velocity profiles in lengthwise axis of the device with experimental results, it is possible to state the suitable combination of design and operational parameters to get the quality product.
Fig. 2.2-1 presents as an illustration the Mach number isolines at the nozzle outlet for one of the tested configuration of design parameters.
Figure 2.2-1. Mach number isolines at the nozzle outlet
Fig. 2.2-2 presents the serial of velocity profiles along the model axis for one shape of the wedge (30°) and various other parameters (air pressure, air volume, etc.). After the confrontation with the experimental results, it is possible to determine the curve, which is suitable for reaching a uniform and fine nonwoven layer. For next design cases it is sufficient to get a similar shape of the curve.
Figure 2.2-2. Velocity profiles along the flow axis from Fig. 2.2-1
2.3. Texturizing Nozzle
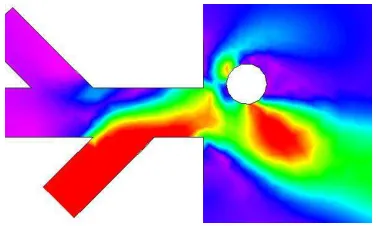
As the later supplement for previous experiments with flow visualization by the so-called schlieren method [3], [4], [5], the numerical flow simulation in nozzles used for texturizing smooth chemical yarns was applied. The texturizing means to give to smooth and straight chemical yarns the appearance similar to the natural fibers, with many loops and slings. By this manner, the material receives more agreeable utility values. It was found that shock waves, accompanied with the overcritical expansion of air, have a considerable influence on the texturizing effect and that it is possible to amplify it by suitably shaped obstacles in the expanding overcritical air flow.
Figure 2.3-2. Mach number isolines of texturizing nozzle
Fig. 2.3-1 shows typical schlieren photograph of shock waves in expanding overcritical air flow in complicated channel. The air flow is coming from below, at the nozzle outlet arises complicated field of strong shock waves. The shock waves effect is amplified by inserted obstacle – here as notched cylinder.
Fig. 2.3-2 presents one example of the flow field in the studied texturizing nozzle. From the left side (straight and up) are situated two fiber inlets, connected with the atmosphere, completed by the third inlet (down) of compressed air from the opposite side of the channel. The arising overcritical flow is concentrating by the inserted obstacle. Changing the obstacle shape or position, it is possible to find the optimum solution, characterized by the maximum texturizing effect at the minimum consumption of the compressed air and of the compressor energy, too.
Comparing both methods – visualization and numerical simulation – we can state that the numerical flow simulation is a more suitable and easier method then experiments. To reach an intensive texturizing effect, which is necessary for units of the highest output, it is necessary to use a high inlet pressure of 700 kPa and more, which can create strong shock effects in the expanding flow. Of course, the both noise level and noise frequency range of such expansion are very high.
Using the fluent shapes of channels without sudden cross section changes, the desired texturizing effect disappears.
2.4. Fibers Inlet
This case presents the frequent designer’s mistake. The inlet of individual short fibers together with air flow is realized from up, see Fig. 2.4-1. In the lower part, the flow is turned on the radial direction and the transported fibers should sediment along the outer perforated surface and create there a uniform fibrous layer for the following spinning process.
Figure 2.4-1. Velocity field – former unsuitable design
But this hypothesis was not verified by experiment because the cross section in the radial direction is designed as strongly divergent. Therefore, in this part there arises the area of the flow separation with backflow (the blue area) with large vortexes. Transported fibers are not well guided and along the
device periphery, irregular fluffs are created.
Figure 2.4-2. Velocity field – modification with constant cross section in the
radial direction
Modifying the geometry after Fig. 2.4-2, the trivial condition, given by the continuity equation, was fulfilled – proportionally with increasing the chamber radius, its height is decreasing so that the cross section remains constant. The image of the flow field is here much better, without separating areas and vortexes, the velocity in the radial direction does not decrease. In such a way, all transported fibers are permanently controlled and their organized sedimentation along the outer periphery was experimentally verified as very good [6].
2.5. High-Speed Contactless Bearing
In modern devices of open-end spinning systems, ever higher revolutions are used, with the aim of ever higher working outputs. The following numerical simulation shows the flow field in the bearing gap of such a rotating unit [7].
Figure 2.5-1. Pressure field in the bearing gap (rotation axis horizontal
down)
The rotation axis of the axis-symmetrical model is always situated along the lower side of individual Figures. In Fig. 2.5-1, there is presented the pressure field – here is visible the well-known principle of flow compression in rotating radial channels. Also in small dimensions, but at high revolutions, the pressure is increasing here. It is the force impulse for some air flow through the bearing gap from the axis (down) to the periphery (up).
Figure 2.5-2. Axial velocity field in the bearing gap (rotation axis horizontal
down)
mentioned pressure gradient in rotating radial "channels", here as narrow bearing gaps, only. At smaller radius (here down) the air is flowing to the right (yellow), at the outlet (here up) the air is flowing to the left (blue/green). Using very fine mesh, in the outlet part there are visible so-called Taylor's vortexes, well known from flow description in narrow gap between rotor and stator.
Fig. 2.5-3 presents the temperature field in the same model – it is visible the significant air warming during the flow through the long and narrow bearing gap, first of all, as the consequence of the viscous friction at high peripheral velocity. At values of Mach number of 0.7 approx., it is necessary to take into account the air compressibility, too. Using quite fine meshing in the narrow gap [8], [9], etc., also the fine structures of the flow are displayed, as for instance the so-called Taylor’s vortexes, etc.
Figure 2.5-3. Temperature field in the bearing gap (rotation axis horizontal
down)
From those results of simple axis-symmetrical simulation results, the next progress of the solution – to create the design of air flow enough for cooling, but at the same time of small air flow to prevent the dust sedimentation from the dusty surroundings into the narrow clearances of the bearing.
3. Applications in Car Industry
3.1. Independent Air Heater
This case illustrates how the flow numerical simulation, here as a complex connection of air and flue gases flows, oil combustion and heat exchange, facilitates the next decisions about the next progress of the research and development of a new type of thermal equipment.
The big advantage of such models is that it is possible to design in advance many various cases, maybe not realizable, but there is possible to see the influences of individual design parameters on the flow volume, temperature, thermal output, etc.
Figure 3.1-1. Temperature field of air (left) and that of flue gases – different
scales! (right)
In two cross sections of an oil heater, the temperature fields are presented – in Fig. 3.1-1, there is the detail of temperature field in the outer area of air warming (left) and the detail of temperature field in the inner area of flue gases (right). Different scales are used here!
Relevant lengthwise profiles of ribbed heat exchangers are given in Fig. 3.1-2 – outer air flow and Fig. 3.1-3 – inner flue gas flow. Different scales are used to get the best contrast.
Figure 3.1-2. Temperature field of air
Figure 3.1-3. Temperature field of flue gases (different scale to Fig. 3.1-2)
Figure 3.1-4. Set of flow, temperature and combustion field in the combustion
chamber
The next serial of flow field in Fig. 3.1-4, there are presented fields of important flue gases components and parameters, influencing the complicated case of combustion, heat conduction and flows of combustion air, fuel, flue gases and warmed air in the complicated geometry of the observed equipment. The system description in the axial section: From the left side, there are inlets of combusting air and fuel, then fuel evaporating, mixing with air and combustion in the main chamber. In the right end, the flue gases are turning back and leaving in the gap between the combustion chamber and the outer surface for the air warming – this is not presented here.
Flue gases temperature – maximum in the area of primary combustion, after mixing with secondary air, the value is decreasing.
In the right column, there is presented (up to down): Fuel vapor concentration – maximum at the evaporating
strainer, then quickly burning
O2 concentration – in the combustion chamber relative
high, the highest in the area of primary combustion, therefore, the output loss is high, too
Flue gases temperature – the highest in the area of primary combustion, too.
3.2. Cavitation in Shock Absorber
The graph Fig. 3.2-1 shows typical operation of shock absorber – at the extension the axial force is higher, at the pressing must be lower. The main problem is the delay at the beginning of the pressing movement, see the empty points on the graph.
Figure 3.2-1. Axial forces of shock absorber (angle 0-180°)
The scheme of complicated geometry is presented on the Fig. 3.2-2, one section of rotation-symmetrical case, only.
Figure 3.2-2. Geometry and mesh of shock absorber
For better imaging the relative movement was used, where the inner volume is standing and the absorber body is moving. The model and its solution is very complicated, from parallel simulation of used flat springs it is clear that deformation can be considered as linear. To get stable solution of used model of movable wall, deformed meshes must be used – very fine and of very short time step of the solution.
Several typical global pressure fields are presented on the Fig. 3.2-3 for 8x45° positions of the driving crank. There are observable strong pressure changes in the area of both dead points, where the pressure value can decrease under the value
of saturated vapour. In such case can arise a cavity - vapour bubble - in liquid oil, which is the reason of experimentally observed delay in the force graph.
Figure 3.2-3. Pressure fields in shock absorber for 8x45° positions of driving
crank.
The detailed Fig. 3.2-4 identifies the area of pressure under 30 kPa in the time of 3 ms after the dead point, where such cavity can arise.
Figure 3.2-4. Area of possible cavitation (under 30 kPa, 3 milliseconds after
the dead point)
4. Conclusion
flow numerical simulation, used for description of complicated situations, sometimes experimentally hardly verified.
References
[1] M. E. Dejc, "Technical dynamics of gases", GEI Moscow, 1961 (in Russian).
[2] J. Kaniok, "Melt-blown technology", diploma thesis, FT TU Liberec, 1998 (in Czech).
[3] K. Adamek, "Chemical yarn texturizing by air flow", dissertation, TU Liberec, 1981 (in Czech).
[4] K. Adamek, "Shock Waves as a Tool?", 2nd Int. Symp. on Exp. and Comput. Aerothermodynamics of Int. Flows, (Vol. 2, 109-114), Inst. of Thermomech. Acad. of Sciences Prague, 1993, ISBN 80-7015-384-9.
[5] K. Adamek, "Shock waves affecting on yarns", Int. conf. Applic. of exp. meth. in fluid mech., VSDS Zilina, PieSťany, 1993 (in Czech).
[6] K. Adamek, J. Pelant, "Luftstroemung im System fuer Faserbandvorbereitung", 8. Chemnitzer Textilmaschinen- tagung, 203-206, TU Chemnitz, 2001.
[7] K. Adamek, J. Kolar, "Numerical flow simulations used in industrial problems", ECCOMAS 2012, (Europ. Congress on Comput. Meth. in Appl. Sciences and Engineering), TU Wien, ISBN 978-3-9502481-9-7.
[8] J. Pelant, K. Adamek, M. Kyncl, "Application of the 3D NS equations for axis-symmetrical viscous turbulent flow", 6th ICCSM (Int. Congress of Croatian Society of Mechanics), Dubrovnik, 2009. ISBN 978-953-7539-11-5.
[9] J. Pelant, K. Adamek, M. Kyncl, "Application of the NS equations for 3D viscous turbulent flow on bladeless fluid machines", 5th Europ. Congress on Comput. Meth. in Appl. Sciences and Engineering (ECCOMAS), Venice, Italy, 2008. ISBN 978-84-96736-55-9.