© Universiti Tun Hussein Onn Malaysia Publisher’s Office
IJIE
Journal homepage: http://penerbit.uthm.edu.my/ojs/index.php/ijie
The International
Journal of
Integrated
Engineering
ISSN : 2229-838X e-ISSN : 2600-7916
Development of Foreign Material Detection in Food
Sensor
u
sing Electrical Resistance Technique
Nur Farah Intan Suhaila Rizalman
1*, W. N. A. Rashid
1,
Nurhanis Lokmanulhakim
1, Elmy Johana Mohamad
21Faculty of Electrical and Electronic Engineering Technology,
Universiti Teknikal Malaysia Melaka (UTeM), Hang Tuah Jaya, 76100, Durian Tunggal, Melaka, MALAYSIA
2Faculty of Electrical and Electronic Engineering
Universiti Tun Hussein Onn Malaysia (UTHM), 86400, Parit Raja, Batu Pahat, Johor, MALAYSIA
*Corresponding Author
DOI: https://doi.org/10.30880/ijie.2019.11.04.032
Received 8 August 2019; Accepted 26 August 2019; Available online 5 September 2019
1. Introduction
Electrical Resistance Sensor (ERS) is used as a novel concept of detection of foreign material in food. Resistance idea itself is the measure of opposition to electric current. At the point when an electric current of one ampere passes through a component across which a potential difference voltage of one volt exists, then the resistance of that component is one ohm. The only law that applied to this concept is Ohm’s Law. It states that the current is directly proportional to the voltage and inversely proportional to the resistance. For that reason, the measure of voltage is equal to the measure of current multiplied by the measure of resistance, V=IR [1].
Electrical resistance is the easiest electrical property to be measured accurately over a wide range at moderate cost. There are many classifications of resistive sensors based on their sensing principle but this project focused on using
Abstract: Food inspection has been a serious matter in the food industry as the contamination by foreign materials such as metals, bone, plastics and glass in food plays a major impact on the industry. In spite of a great deal of effort to prevent mixing foreign bodies in food materials, food manufacturers have still not been able to detect them. Electrical Resistance Sensor to detect the foreign material in food detection sensor is constructed and presented in this work. This project focuses on how to design and implement the system to detect and distinguish between food and foreign material using resistance concept. The electrode plate of Electrical Resistance Sensor (ERS) is designed using COMSOL Multiphysics Software to see the electric field and contour of the electric potential of the system. The resistance value from the sensor is measured based on the AC Circuit concept. The alternating current from the sensor flows to the charge detector circuit providing the voltage corresponding to the resistance between the electrode pair. The voltage from the charge detector circuit has been amplified by the amplifier circuit to obtained DC output from an AC input signal. The voltage form circuit has been converted from the analog to digital signal using Bluetooth Electronics Application via Arduino Uno through HC-05 Bluetooth module. The Bluetooth Electronics Application is used as a graphical user interface (GUI) to display the condition of the material tested including food and foreign material to a smartphone. The experiment results show that the electrical resistance sensor are able to detect the foreign material in food by changes of the resistance value. If the food was detected with the foreign material (non-conductive), the value of resistance will decrease due to the flow of electric current.
photoresistive which it decreases in resistance when light strikes a photo-conductive material [2]. A few materials, like copper, is used as the electrode in this project as it has a very low resistance to the flow of electricity. Others, for example, glass or rubber have a very high resistance to the flow of electricity. This fairly clearly is the reason copper is used as electrical conductors and why we use rubber and plastic to insulate those electrodes.
The system is adopted from Electrical Resistance Tomography (ERT) concept because of its advantages of being low cost, suitable for various kinds and sizes of pipes and vessels, having no radiation hazard, and being non-intrusive [3]. ERT usually carried out with multi-electrode resistivity and measure the resistivity distribution of the subsurface materials [4]. The electrodes can be set in 8, 16 or 32 electrode groups but this project only used only two electrodes. ERT is used to determine resistivity by making a measurement of voltage around the electrode. ERT used to measure resistivity by comparing the resistivity values collected.
This project will discuss how the resistance concept is used as a detection sensor for determining foreign material in food. The whole system was designed to detect the presence of unwanted foreign materials in different types of food product which applies the tomographic imaging to it. As for food detection, there were many other techniques used to detect the presence of foreign material in food such as metal detection, optical techniques, X-ray food inspection, electrostatic techniques, microwave techniques and etc. but this will use a novel method of ERT. The food such as a food in a container for example will be detected by the sensor and from that, the final result will be displayed be to Bluetooth Electronics Application.
2.
Electrical Resistance Sensor Principle
Electrical resistance is a numerical factor that used to calculate voltage as well as current. Sensing takes of changing in resistance to infer changes in others physical measurements. It is important to understand where resistance does changes due to the material or geometry changes. Specifically, electrical resistivity tomography (ERT) is the method used in order to determine resistivity by making a measurement of voltage around the periphery of a vessel. In another word, it used to measure resistivity by comparing resistivity values collected. The arrangement for ERT usually consists of electrodes array and the measured is the resistance itself (or impedance) [5]. The whole system includes sensors, measurement electronics, switching electronics, signal conditioning circuit, analogue to digital converter, communication and a host computer control as well as a data processing.
2.1 Electrical Resistance Design
As for Andrew et. al (2005), he did a development of a design of a pulse-based high speed with 1000 frames/s ERT system with real-time visualisation. This is because of it much simpler than any sinusoidal-based system and it is capable of very high frame rates. The targeted area was for the mixing phenomena and also for slurry pipe-line flow. Some of the 16-electrodes were built in one current source which multiplexed to the drive electrodes and the electrode pairs multiplexed to one detector amplifier. This design was implemented using low cost and readily available components [6].
Another new method for two-phase flow measurement has been proposed by Xiang et. al (2010) where the sensing electrodes need to be in contact with the conductive solution so that the field can be established. At the meantime, this system use ac impedance which also known as contact impedance will be useful and important to the design application where in a way it can produce the same response signal as the actual system. The electrodes must own a good conductive performance and the value of the electrode surface area influences the measured voltage as it helpful to the uniform distribution of the exciting current density [7].
Another design of a sensor can be expended range of semiconductor resistance sensor in order to improve measurement accuracy which eventually leads to good feasibility [8]. Semiconductor resistance sensor is commonly used in the industry because of speed small volume, high sensitivity, light weight and easy integration as well as improves measurement accuracy.
ERT has been created for a considerable length of time as one of the fundamentals procedure of tomography which took places especially in the industry. Before, the previous ERT system which happened the metal electrodes are in contact with the liquid directly and lead to electrode corrosion and limitation of applications of ERT in the industry itself. In order to overcome the situation, a new method has been proposed by B. Wang (2013) where using capacitively coupled contactless conductivity detection (C4D) as a solution to that problem. An axial arrangement of C4D was introduced in 1998 and independently was made a meaningful involvement to it. Then, it was simplified to 2 electrodes pattern in order to make sure the easier technique is used to measure the resistance of a liquid between electrodes without directly contacted within the liquid where it can be avoided of chemical reactions of the electrodes. Plus, it is used because the technique can be implemented without difficulty and has high sturdiness. This model is more specified on the measurement of conductivity distribution of two-phase flow. [9]
during the system is moving across the ground. This method took place so that the bad measurements can be strained out and resistivity and contact resistance can be measured instantaneously [10].
Fig. 1 - Schematic of a four-electrode resistivity measurement
2.2 Electrical Resistance Sensor
In 2009, Gu et al. have proposed another way to develop a new resistance model, obtained from FEM (finite element method) [11]. In common, FEM is used to solve the forward problem like calculate the resistance value for a given conductivity distribution and electrodes setup and etc. Electrical resistance sensors when connecting to external discrete resistor networks can be accurately simulated using conventional circuit theories. This enhanced forward model and permits more flexible sensor configuration and better images achieved, which provides a better foundation for ERT. A few years back, ERT has been established speedily and have been used in many industrial imaging applications up to now. It usually is made up of a set of electrodes evenly mounted around the periphery of the object being imaged. J. Zhao et al (2013) also proposed the electrical field finite element mathematical model of electrical capacitance and resistance dual-modality tomography sensor in 2002 [12]. Actually, ERT and ECT have been applied to three-phase flow parameters measurement has a great potential in the industrial application as well.
Obrien et al. (2007) implemented a smart Dielectric Elastomer Actuator (DEA) with and integrated extension sensor based on resistance and measurement voltage [13]. The sensor can minimize cost, complexity, and weight compared to an external sensor. This project used DEA as actuators and used self-sensing technique instead of any other typical sensing technique where all the electrical characteristics are measured and related to the physical actuator. A self-sensor has tolerance to very high voltages, integration with the power electronics and some other requirements. The sensor circuit consists of resistors, DEA and the voltage circuit consist of a resistor ladder and level converting circuitry.
ERS is used as a novel approach to quantify stream flow continuity which means continuous through time and longitudinal connectivity meaning continuous through space across watersheds in the USA [14]. The Continuity and connectivity were quantified based on a strict interpretation of continuous flow at an individual sensor or simultaneous stream flow at multiple sensors. 44 ER sensors were installed at approximately 2 km intervals and the sensor modifications consist two polyvinyl chlorides (PVC) insulated copper wires soldered to the sensor circuit board and protruding from the encased water proof datalogger throughout eight canyons. Several semi arid watersheds that are characterized by hydrologically complex flow pattern were accomplished.
Another new invention is from Wu (2015), where it proposed a new design and crosstalk error analysis on resistive sensor array [15]. It was designed to improved crosstalk error among the elements by designed an improved isolated drive feedback circuit using one op-amp to reduce it by the adjacent column elements. The circuit used the sample resistor connected the networked resistive sensor array to the ground. In the end, the measurement error of the element being tasted has been reduced regularly and it turned out that the less row number and large column number are preferred to be a good performance.
The resistive sensor is the device for the measurement high power microwave pulse [17]. The performance of the resistive sensor based on a well-known electron heating phenomenon in a semiconductor where it is inserted between the thin metal diaphragm and wide wall of the waveguide. This is as a prototype of the sensing element of the resistive sensor. The performance of sensing element is based on electron heating effect of the semiconductor. As the electric fields of the high-power microwave pulse heat electrons in the sample, its resistance changes and by measuring the resistance change the power of the HPM pulse in the waveguide is determined.
3.
Methodology
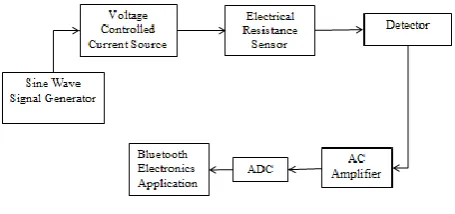
The block diagram of two electrodes data system for ERS is shown in Fig. 2 above. The excitation circuit can be generated from a sine wave function generator connected to the voltage controlled current source to the electrode plates of the electrical resistance sensor. Then, it is connected to the detector and amplifier circuit until it produced a voltage corresponding to the resistance values from the electrode plates. The output signal from the conditioning circuit is then passed to analog to digital converter using Arduino module to digitally record and display the results at Bluetooth Electronics Application.
Fig. 2 - Block diagram of the system
3.1 Sensor Model
For COMSOL software Simulation, 3D sensor models of two plate ERS sensor were made from the concept idea of monitoring soil water content using ERT [18]. As well as monitoring changes in soil moisture. Sensor usually contains a receiving (sensing) member, as well as one or more intermediate converters and the output of it are distinguished accordingly to the type of energy [19] which discussed here is electrical. The signal of the sine waves excitation signal of 8Vp-p and 50 KHz is generated to the electrodes. Both electrodes are pricked into the food material such as solid food and connected to the conditioning circuit and finally produce a voltage from the resistance values obtained. The design of the significant parameters of the sensor is shown in Table 1.
Table 1. Parameter of the sensor Parameter Value
Length of electrodes 5.0cm
Width of electrodes 1.5cm
Gap between adjacent electrodes 0.8cm
Electrodes material Copper
3.2 Bluetooth Electronic Application
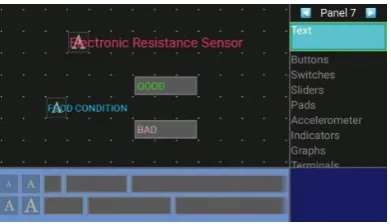
Fig. 3 - Bluetooth Electronics Application interface
3.3 Hardware Setup
The experiment was carried out as shown in Fig. 4 This Electrical Resistance Sensor consists of Electrical Resistance Sensor, Excitation Circuit, Signal Conditioning Circuit, computer, and smartphone. The external of the signal wave generator and power supply are used in the system.
4.
Results and Conclusion
The simulation was carried out using Comsol Multiphysics software see the relationship between types of materials and the value of resistance. Then the distance between sensor and material also will vary from 10mm to 20mm. For the hardware part, the value is taken and the functionality of Bluetooth electronic application is verified.
4.1 Comsol Simulation
Based on Table 2, it shows the simulation of Comsol Multiphysics resistance values of two electrodes when the terminal electrodes are excited to different types of material within the food and foreign materials such as meat, carbon, wood, zinc, iron, and silica.
Table 2. The relationship between resistance value and type of material Material Resistance Value (Ω)
Aluminium foil 21.22
Bread 74.17
Plastic 52.44
Copper board 26.15
Rubber 92.52
Paper 83.19
Bread + Aluminium Foil 39.12
As the results, non-conductive materials like food; meat in this case, wood and silica showed higher value to resistance compared to a conductive material such as carbon zinc and iron. Theoretically, the electrical resistivity is a fundamental property that quantifies how strongly a given material opposes the flow of electric current. A low resistivity indicates a material that readily allows the flow of electric current. This theory applies the same concept within this output from the simulation as conductive materials give a higher value of resistance compared to non-conductive materials.
Table 3. The relationship between resistance and length of electrodes Length of electrode (mm) Material Resistance Value (Ω)
0.10 Meat 106.34
Carbon 15.81
Wood 39.57
Zinc 7.01
Iron 12.32
Silica 30.27
Meat+Iron 106.34
0.15 Meat 109.91
Carbon 18.21
Wood 45.79
Zinc 8.11
Iron 14.56
Silica 36.38
From the results obtained in Table 3, it shows that higher electrode length, the higher the resistance value for each of the material tested. The resistance in electrode increases as the length of the electrode increases. The resistance of a long electrode is greater than the resistance of a short electrode because electrons collide with more ions as they pass through. The relationship between resistance and length of the electrode is proportional.
4.2 Hardware Results
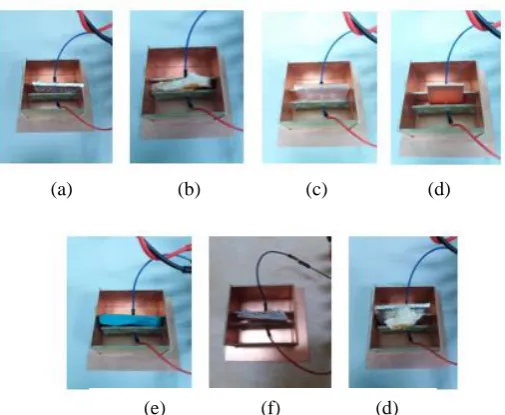
Fig. 6 shows the hardware setup for measuring the value of resistance using LCR meter for different types of foreign material and food. The experiment was carried out when the excitation voltage of 8 Vpp and 50 KHz were injected to the electrode to measure the resistance between the two plates sensor.
As the results obtained in Table 4 and Fig. 7, there showed the different materials showed different resistance values. As mentioned in the simulation results, the hardware results also showed almost similar output but with different materials used. Rubber which is the most non-conductive that impede the free flow of electrons from atom to atom and molecule to molecule, had the highest value of among the others while aluminium foil has the lowest because it is a conductive material which permits electrons to flow freely from particle to particle.
Fig. 6 - Hardware setup between the materials and sensor (a) Aluminium foil (b) Bread (c) Plastic (d) Copper board (e) Rubber (f) Paper (g) Bread + Aluminium foil
(a) (b) (c) (d)
Table 4. The relationship between food and foreign material and resistance value
Material Resistance Value (Ω)
Aluminium foil 21.22
Bread 74.17
Plastic 52.44
Copper board 26.15
Rubber 92.52
Paper 83.19
Bread + Aluminium Foil 39.12
Fig. 7 - Food and foreign materials with resistance value
4.3 Bluetooth Electronic Application
Fig. 8 shows the Bluetooth Electronics Application was being used as a graphical user interface to display the condition of food and foreign material resulted from the data acquisition system. The output voltage displaying in the Bluetooth Electronics Application which is corresponding to the resistance value between two plates of ERS is compared with references value for certain particular material. If the material contains only food, the apps will show ‘GOOD’ but if the material contains foreign material, it will show ‘BAD’ based on the food condition. So, Bluetooth Electronics Application results depend on what kind of material was being tested; whether food or foreign material.
Fig. 8 - Bluetooth Electronics Application main screen
5.
Conclusion
6.
Future Work
To date, the application of using resistance concept to detect foreign material in food has still not yet been comprehensively investigated. Thus, due this project is still in the initial stage, there are still significant for improvement on the system in order to apply it in an industrial area in the future. The suggestion and recommendation for future works are mentioned below:
a) Development electrical resistance sensor (ERS) in close area to reduce the noise of fringe effect from the environment surrounding to get accurate the resistance measurement between a pair of electrodes.
b) Using a well develop main body sensor of ERS that can measure a different type of food whether in the solid or liquid state.
c) Using a coaxial cable for an electrical resistance sensor connector to reduce the noise when resistance measuring unit is measured.
d) Development single module of PCB circuit to simplify the hardware.
e) Upgrade the system of ERS to a smaller and compact size so that it is portable and mobile and easy to use either for industry or for home appliances
ACKNOWLEDGEMENTS
Authors are grateful to the financial support by Research Grant of the Ministry of Higher Education (RAGS Grant: RAGS/1/2015/TK0/FTK/03/B00117) and Universiti Teknikal Malaysia Melaka. Thanks to the staff and members of UTeM who give assistance and commitment to me and guide me in various perspective throughout the project. Special thanks must be given to my friends for ideas and comment regarding to my project.
References
[1] Rosenberg, P. Basic electronics. Wiley Publishing, (2005), pp.18-23.
[2] Du, W. Y. Resistive, capacitive, inductive and magnetic sensor technologies. Taylor & Francis Group, (2015), pp. 25-57.
[3] Aw, S. R., Rahim, R. A., Rahiman, M. H. F., Yunus, F.R.M., and Goh, C. L. Electrical resistance tomography: A
review of the application of conducting vessel walls. Elsevier B.V, Powder Technology, Volume 254, (2014), pp.
256–264.
[4] Saad, R., Nawawi, M.N.M. and Mohamad, E. T. Groudwater detection in Alluvium using 2-D electrical resistivity tomography.” Electronic Journal of Geotechnical Engineering, Volume 17, (2012).
[5] York, T. Status of electrical tomography in industrial applications. Journal of Electronic Imaging, Volume 10, No. 3, (2001), pp.608-619.
[6] Wilkinson, A.J., Randall, E.W., Cilliers, J.J., Durrett, D.R., Naidoo, T. and Long, T., A 1000-measurement frames/second ERT data capture system with realtime visualization. IEEE Sensors Journal, Volume 5, No. 2, (2005), pp.300-307.
[7] Deng, X., Chen, Y., Yan, Z. and Wei, Z. AC impedance model of array electrodes in multisensor fusion system for
two-phase flow measurement. IEEE Transactions on Instrumentation and Measurement, Volume 59, No. 6,
(2010), pp.1722-1726.
[8] Li, J., Guan, Y., Jing, X., Zhao, C. and Jin, Y. A circuit design of natural logarithmic resistance/period conversion
in semiconductor resistance sensors. In Circuits, Communications and System (PACCS), 2010 Second Pacific Asia
Conference on, IEEE, Volume 1, (2010), pp. 370-373.
[9] Wang, B., Hu, Y., Ji, H., Huang, Z. and Li, H. A novel electrical resistance tomography system based on C4D
Technique.” IEEE Transactions on Instrumentation and Measurement, Volume 62, No. 5, (2013), pp.1017-1024.
[10] Christy, C.D. and Dyer, S.A. Non-stationary electrical resistivity sensor with contact resistance measurement. in
Sensors for Industry Conference, 2002. 2nd ISA/IEEE, (2012), pp. 197-201.
[11] Li, J., Guan, Y., Jing, X., Zhao, C. and Jin, Y., A circuit design of natural logarithmic resistance/period conversion in semiconductor resistance sensors.” In Circuits, Communications and System (PACCS), 2010 Second Pacific Asia Conference on, IEEE, Volume 1, (2010), pp. 370-373).
[12] Zhao, J.C., Fu, W.L., Lei, J.J., Qiu, B. and Li, X.Y. Electrical characteristic analysis of electrical capacitance and resistance dual-modality tomography sensor based on metal-wall. In Applied Mechanics and Materials, Trans Tech Publications. Volume 241, (2013), pp. 10601063.
[13] O‟Brien, B., Thode, J., Anderson, I., Calius, E., Haemmerle, E., and Xie, S. Integrated extension sensor based on
resistance and voltage measurement for a dielectric elastomer. Proc. SPIE 6524, Electroactive Polymer Actuators
and Devices (EAPAD), Volume 6524, (2007), pp. 652415.
[15] Wu, J., Wang, L. and Li, J. Design and crosstalk error analysis of the circuit for the 2-D networked resistive sensor array. IEEE Sensors Journal, Volume 15, No. 2, (2015), pp.1020-1026.
[16] Yang, M., Zhang, W., Li, L., Han, L., Chen, X., Yang, R. and Zeng, Q. A Resistance Type Sensor Based on
Chipless RFID. IEEE Transactions on Antennas and Propagation, Volume 65, No. 7, (2017), pp. 3319-3325.
[17] Allampalli, A. and Bhattacharya, A. Resistive sensor for high power microwave pulse measurement. In
ElectroMagnetic Interference & Compatibility (INCEMIC), 2016 International Conference on, IEEE, (2016), pp. 1-3.
[18] Beff, L., Gunther, T., Vandoorne, B., Couvreur, V., and Javaux, M. Three-dimensional monitoring of soil water content in a maize field using electrical resistivity tomography. Hydrol. Earth. Syst. Sci., Volume 17, No. 2, (2013), pp 595-609.