*Corresponding author: [email protected]
2013 UTHM Publisher. All right reserved. Penerbit.uthm.edu.my/ojs/index.php/ijie
64
Development of Rainfall Model using Meteorological Data for
Hydrological Use
Mohd Adib Mohammad Razi
1,2*, Wardah Tahir
2, Noratina Alias
1, Lokman
Hakim Ismail
1and Junaidah Ariffin
21
Faculty of Civil and Environmental Engineering
Universiti Tun Hussein Onn Malaysia, 86400 Parit Raja, Batu Pahat, Johor, MALAYSIA.
2
Flood-Marine Excellence Centre, Institute for Infrastructure Engineering & Sustainable Management Universiti Technologi MARA, 40450 Shah Alam, Selangor, MALAYSIA.
1.
Introduction
The occurrences of disastrous rainfall events was lead to serious flooding are expected to increase in the near future due to changes in weather pattern. Prediction of such unusual events is one of the main challenges faced by meteorologists. Such phenomena would give impact to a much localized region (as in the case of the Kota Tinggi flood in 2007). Current operational models are unable to make reliable and accurate predictions due to insufficient spatial resolution. However, these models can be further enhanced with the inclusion of rainfall model into the hydrological use.
Improving the estimation of rainfall is presently one of the main challenges for operational meteorological
center. The incidence of “significant” weather events is
expected to increase in the near future due to climate change. The total loss caused by the 2006 to 2007 floods in Johor was estimated to be RM 1.5 billion, which is considered as the most costly flood event in Malaysian history.The Meteorological Department of Malaysia encounters difficulties in estimating rainfall using ground data or through satellite model. Presently, no rainfall model has incorporated the capacity to modify internal weather class properties to simulate changes that may occur [1].
Previous research illustrated the significance of rainfall data in the development of rainfall equation [1],[2],[3],[4],[5],[6] and [7]. These previous studies included model fitting, illustration of the significant parameters for model development, evaluation of the rainfall data from rain gauges to radar readings, and analysis of extreme events.
Most studies concerning rainfall equation are normally concentrated on rainfall data; however, several studies use meteorological parameters for analysis. In 1982, Coe and Stern [2] studied models that resemble daily rainfall data to demonstrate the method of analysis using a number of sites with dissimilar rainfall patterns. Based on their results, the only way to accomplish the outcome is using a model that could simulate data collected over a long period of time. Tapp et al. [7] used rainfall and meteorological parameters in their model output to predict both the possibility of precipitation and the amount of rain in seven major Australian cities in subtropical and middle altitudes. Their data consisted of the current climate and a range of future possible scenarios. A problem in perceived extreme event is attributable to lack of data with sufficient time resolution of long duration [8]. These studies include the analysis on long term changes in the intensity and frequency of heavy
Abstract At present, research on forecasting unpredictable weather such as heavy rainfall is one of the most
challenges study for equipped meteorological center. The incidence of significant weather events is estimated to increase in the near future due to climate change, and this required more studies to be done. This study has developed a rainfall model using selected rainfall parameters with the aim to estimate the rainfall depth in a catchment area. Rainfall model was developed using rainfall, temperature, humidity and pressuredata taken from selected stations in Peninsular Malaysia and these data were analyzed using multiple regression model. Seven meteorological stations are selected for data analysis which is from 1997 until 2007 which are Senai, Kuantan, Melaka, Subang, Ipoh, Bayan Lepas, and Chuping. Based on statistical results, Senai rainfall model shows the most reliable result compared to other stations and this model was validated with data from Kota Tinggi station. The analysis shows that the selected meteorological parameters were influence the rainfall development. As a conclusion, the rainfall model developed for Senai can be used in Kota Tinggi catchment area because these two stations located in the same regional boundaries. The amounts of rainfall at the Senai and Kota Tinggi stations was compared and calibrated and was statistically prove that the rainfall model can be used at both areas.
precipitation in Japan from 1901 to 2004 using quality checked daily precipitation data in 51 stations.
Araki et al. [9] classified the significance of various parameters namely diurnal variation of wind, convective cloud and temperature to the occurrence of rainfall. Carrera-Hernandez et al. [10] established a relationship between minimum and maximum temperature to rainfall. Meanwhile, Kilsby et al. [11] recognized the importance of temperature, humidity, wind and sunshine for rainfall prediction and had incorporated these variables as indicators for weather generator.
In the latest research by [12], the team created the non-responsive analysis that can be used to gain useful information on the relationship between pressure, wind speed, and temperature. Based on this study, the relationship between wind speed and pressure are co-dependent with temperature. In addition, the relationship between wind speed and pressure within a storm was determined. Further, more complex relationship between wind speed, pressure, and temperature was considered near the surface of the water. From the result, the developed model using both regression analysis and non-response analysis, the function of the remaining two solutions, depends on the season in which the pressure is related to wind speed and temperature.
However, numerous problems concerning the data assimilation front arose, especially with regard to forecast errors, which are responsible for distribution, the observational increments in space, and between model variables. When the relationship in the subject data is statistically identified, a meteorologist or researcher make a determine estimation or identify each variable as a function of the other variables, depending on the time of year and on the non-functional relationship obtained. Understanding the non-functional relationship between temperature, pressure, and relative humidity is useful in understanding the dynamics existing within a tropical storm system.
Obviously, the studies have their own weaknesses, especially in the calibration processes and the ability to implement meteorological data as an input in the models. However, there are also many areas where today’s tools
are lacking the features and functions needed to build these applications effectively. The quick development of Malaysia, the responsibility of managing river has also increased, and therefore, the moment has already come to develop new techniques to overcome problems concerning flood and water resources design and management.
In this study, the relationship between rainfall, temperature, pressure and relative humidity will be determined. Developed rainfall model will be synthesized in relation with pressure, relative humidity and temperature using the data annual rainfalls. This rainfall model will be used for hydrological purposes and Statistical Package for Social Science (SPSS) software [13] is used in developing rainfall model using selected meteorological data with selected meteorological stations around Peninsular Malaysia.
2.
Rainfall model for hydrological use
Successful development of a rainfall model will provide useful input parameter for any hydrological model, which will eventually lead to the development of the inundation model. The challenge would then be on the selection of the most reliable rainfall model. Hydrological models have the potential to present the necessary information, with sufficient input information or otherwise it is very difficult to establish the required models. Hydrology relies on principles of probability theory, statistics, and information analysis. Whole texts on frequency analysis methods, stochastic generation of data, regression and analysis of variance, and regional analysis are available containing systematic explanations of the principle. However, many hydrologic processes are so complex that they can be interpreted and explained only in a probabilistic sense. Hydrologic events appear as uncertainties of nature and it must be assumed as an underlying process with random or stochastic components. The information to examine these processes is included in records of hydrologic observations.
Integration of the rainfall and hydrological models has brought a new perspective in model development. Simulations of water levels in river system and possible inundated areas within a catchment are made possible with developing a rainfall model. These simulations could be carried out many hours ahead if rainfall could be predicted accurately. However, the challenge would then be on the selection of the most reliable rainfall model.
3.
Study area and data
3.1
Study area
66
The catchment receives an average annual precipitation of 2,470 mm, and the temperature in the basin ranges from 21 °C to 32 °C. Fig. 1 shows a part of Kota Tinggi watershed [17]. The circled area in Fig. 1A shows the state of Johor located in the southern part of Peninsular Malaysia, and the circled area in Fig. 1B shows the district of Kota Tinggi, Johor. Figure 1C shows the Kota Tinggi watershed area where this study is carried out.
In this study, the river gauging station at Rantau Panjang, Kota Tinggi and the rainfall station at Ladang Pekan are used in the analysis to derive the observed unit hydrographs of Kota Tinggi watershed. Stream flow and daily rainfall records are used to analyze the unit hydrographs.
3.2
Data used in analyses
The data are obtained from the Malaysian Meteorological Department, MMD and the Hydrology and Water Resources Division, which is one of the
divisions in the DID. This approach is used to demonstrate the application of the daily total rainfall from seven meteorological stations in Peninsular Malaysia. Fig. 2 shows the seven meteorological stations for data collection, namely, Senai, Kuantan, Melaka, Subang, Ipoh, Bayan Lepas, and Chuping. Table 1 shows the meteorological stations selected in this study.
The data collection for analysis was daily (24 hours) mean MSL pressure, temperature, relative humidity, and rainfall amount for 11 years (1997 to 2007). The main objective of this research is to determine the relationship between rainfall and the three meteorological parameters (pressure, relative humidity, and temperature) and to synthesize one rainfall formula in relation with these parameters using the annual rainfall data.
Multiple regressions were used in this research to develop the equation and a total of 4,017 data concerning these parameters are available in every selected station. From literature and the availability of these data, these parameters give the most contribution to develop rainfall model.
Table 1Meteorological station in Peninsular Malaysia
Site Location State Height above
MSL (m)
Height of Anemometer
Head above ground (m)
Coordinate
North East
Senai Johor 37.8 17.4 1° 38′0″ N 103° 40′0″ E
Kuantan Pahang 15.3 14 3.470 N 1030 13’ E
Malacca Town Malacca 8.5 14.2 2016’N 102015’E
Subang Selangor 16.5 19.2 307’ 0” N 101033’ 48” E
Ipoh Perak 40.1 17.4 04034’N 101.060 E.
Bayan Lepas Penang 2.8 12.5 50 18’ N 100016’ E
Chuping Perlis 21.7 12.6 60 29’N 100016’E.
Fig. 1 Kota Tinggi, Johor map: A) shows the state of Johor, B) shows the district of Kota Tinggi, and C) Kota Tinggi watershed area.
A B
Observed Cum Prob
1.0 0.8 0.6 0.4 0.2 0.0
Ex
pec
ted
C
um
P
rob
1.0
0.8
0.6
0.4
0.2
0.0
Normal P-P Plot of Relative
Observed Cum Prob
1.0 0.8 0.6 0.4 0.2 0.0
Ex
pec
ted
C
um
P
rob
1.0
0.8
0.6
0.4
0.2
0.0
Normal P-P Plot of Pressure
Observed Cum Prob
1.0 0.8 0.6 0.4 0.2 0.0
Ex
pec
ted
C
um
P
rob
1.0
0.8
0.6
0.4
0.2
0.0
Normal P-P Plot of Temperature
Fig. 2 Location of meteorological station.
4. Methodology
This research evaluates the applicability of a rainfall model in conjunction with application to the hydrological use. To accomplish the above objective, the models are tested using the data of selected station in Peninsular Malaysia, with selected events from 1997 to 2010. This study is accomplished through the quantitative analysis of the development of rainfall models based on selected meteorological parameters, such as temperature, relative humidity, and pressure. These three parameters selected because the availability of the data in Malaysia. From literature review, parameters that give significance relationship in development of rainfall is depend on the geography of the location and the condition of the parameter. It shows that every meteorological parameter such as humidity, pressure, temperature, wind speed and direction, evaporation and cloud activity give a significance result in developing a rainfall. But, in Malaysia condition, the availability of the data is very critical because the collection of the data is not proper. In this study, only three parameters selected have complete data for 11 years.
This research can be defined as a synergetic application of rainfall and hydrological use to improve the understanding of hydrological cycle. The development of rainfall model in the Kota Tinggi catchment is investigated with special focus on the scale issue resulting from the resolution gap of these three parameters.
The performances of the rainfall model in Senai meteorological station is compared with Kota Tinggi meteorological station. Rainfall and hydrological models are developed for the Kota Tinggi catchment because of the flooding event in Kota Tinggi in 2006 and 2007. For the data availability analysis, two analysis was carried out which is normal probability analysis and scatter plot analysis and for identified the relationship between rainfall and three parameters, multiple regression and T-Test was carried out. The above analysis has several limitations. The range of variables used in the analysis for Senai rainfall model is shown in Table 2.
To address the above mentioned objectives, the following study approach is planned. The historical and current records of rainfall from selected meteorological stations and flow data of Sungai Johor in Kota Tinggi catchment were acquired from the Department of Irrigation and Drainage (DID), Malaysian Meteorological Department (MMD), and National Hydrographic Centre. The rainfall model is developed based on the relationship between rainfall and selected meteorological parameters. This study also targets, in particular, the evaluation of different meteorological data sources to assess their applicability and reliability for hydrological use.
5.
Results and Discussion
5.1 Rainfall model
As stated previously, the main objective of this research is to analyze and explain the development of a rainfall model on a purely deterministic basis, either in the past or in the future, because identifying all fundamental methods quantitatively is inconceivable. Statistical methods are available to organize, present, and reduce observed data to a form that facilities their interpretation and evaluation. The data modeled are meteorological data of 11 years (1997 to 2007).
5.1.1 Normal Probability Plot
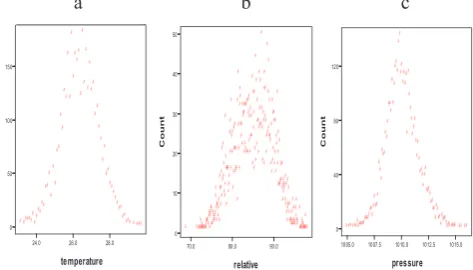
Fig. 3 (a), Fig. 3 (b), and Fig. 3 (c) show that the probability plots of temperature, relative humidity, and pressure data are normal in Senai station. If the sample forms a normal distribution, the causes fall approximately in a straight line.
Fig. 3 Graph Normal P-Plots of (a) Temperature, (b) Relative Humidity and (c) Pressure. SENAI
IPOH
KUANTAN
MALACCA BAYAN LEPAS CHUPIN
SUBANG
a b c
68
24.0 26.0 28.0
temperature 0 50 100 150 C o u n t
A AAAAA A A AAA AA AA A A A A AA A A A A A A A A A A A A A A A A A A A A A A A A A AA A A A A A AA AA AAA A AAA
70.0 80.0 90.0
relative 0 10 20 30 40 50 C o u n t A AAAA A AA A AAAAAAA
AAAA A A A A A AA AA A A A A A A A A A A AA A A A A A A A A A A A A A A A A A A A A A A AAA A A A A A A A A AA A A A A A A A A A A A A A A A A A A A A A A A A A A AA A A A A A A A A A A A A A A A A A A A A A A A A A A A A A A A A AA A A A A A A A A A A A A A A A A A A A A A A A A A A A A A A A A A A A A AA A A A A A A A A A A A AA A A AA AA A A A A AAA A A A A A A A A A A A A
AAAA A
AA A
A A
AAA A A A
AAA A AAAA A A A A AAAA A AA
1005.0 1007.5 1010.0 1012.5 1015.0
pressure 0 40 80 120 C o u n t AAAAAA A AAAAAA AAAAA AA A A A AA A A A A A AA A A A AA A A A A AA A A A A A A A A A A A A A A A A A A A A A AA A A A A AAAA AA AA A AA AA A A AAAA
AAAAAAA AA AA
Table 2 Range of variables used in the analysis and its mass distribution
5.1.2 Scatter Plots
Fig. 4 (a), Fig. 4 (b), and Fig. 4 (c) show the distribution of the three parameters for the scatter plot of outliers graph in Senai station. The result for Senai station shows that there are no outliers in the independent parameters.
Fig. 4 Graph Scatter plots of outliers of (a) Temperature, (b) Relative Humidity and (c) Pressure.
5.2 Results and Analysis of Selected
Variables using Multiple Regression
Three meteorological parameters which are pressure, relative humidity, and temperature are used in the analysis to verify the coefficient of determination for rainfall. These variables are taken from Senai Station from 1997 to 2007. The equation result is developed using the regression analysis in SPSS.
5.2.1 T test and t statistic
This study includes calculation of t-distribution. The degree of freedom is derived as ,
t = n – (k + 1) (1)
where
n = sample size, and
k = number of independent variables; therefore, t = 4017 – (3+1) = 4013
Based on the t-distribution table, t is equal to 1.645
by assuming a significant level (α) of 0.05 and the value
of degree of freedom. The result shows the T-test analysis from the coefficient table is greater than the critical value, and each variable is significant. Hence, the model can be used for prediction purposes.
5.2.2 Regression Analysis
Reanalysis precipitation are related to systematic biases; however, they are still useful for estimating the temporal variability of precipitation, and those they naturally lend themselves to statistical downscaling techniques [18]. In addition, these precipitation fields can show order of magnitude differences from observed precipitation accumulations [19].
R-squared (R2) gives the proportion of the sample variation in Y (rainfall) that is explained by X (pressure, relative humidity, and temperature). The equation R2=0.181 means that the explanatory variable explains 18.1% of the variation in the dependent variable. Furthermore, R2 is a descriptive measure between 0 and 1. The higher the value for R2 is, the better the fit of the regression line to the data. The word "better" means a greater ability to predict.
These three independent variables (temperature, relative humidity, and pressure) together explain 18% of the variance R2 in rainfall, which is highly significant or is below than 0.05. Although the percentage of R2 is lower, the variables of parameter are related to each other.
A multiple regression analysis is conducted to evaluate the relationship between rainfall and the criterion variables (pressure, relative humidity, and temperature). Prior to conducting the regression analysis, T test are performed to ascertain that all assumptions are met. The results of the multiple linear regressions for Senai station from 1997 to 2007 are shown in Table 3.
Variables Average values Range Skewness
11 years Daily Rainfall Average
(mm) 10.5 mm 1 mm – 28.4 mm 0.2 – 1.1
24 Hour Mean Temperature 260 C 23.10 C - 28.30 C -0.9 - 0.03
24 Hour Mean Relative Humidity 87% 74.2% - 97.5% -0.4 - 0.5
24 Hour Mean MSL Pressure 1010 HPa 1005.5 HPa - 1014.7 HPa -0.3 - 0.8
Table 3 Result of the Multiple Linear Regression of Senai station
Model Un-standardized Coefficient
Standardized
Coefficient T Sig.
B Std. Error Beta
Constant
609.206 184.575 3.301 0.001
Temperature -3.037 0.37 -0.185 -8.202 0.000
Relative
Humidity 0.941 0.076 0.272 12.369 0.000
Pressure -0.597 0.177 -0.052 -3.380 0.001
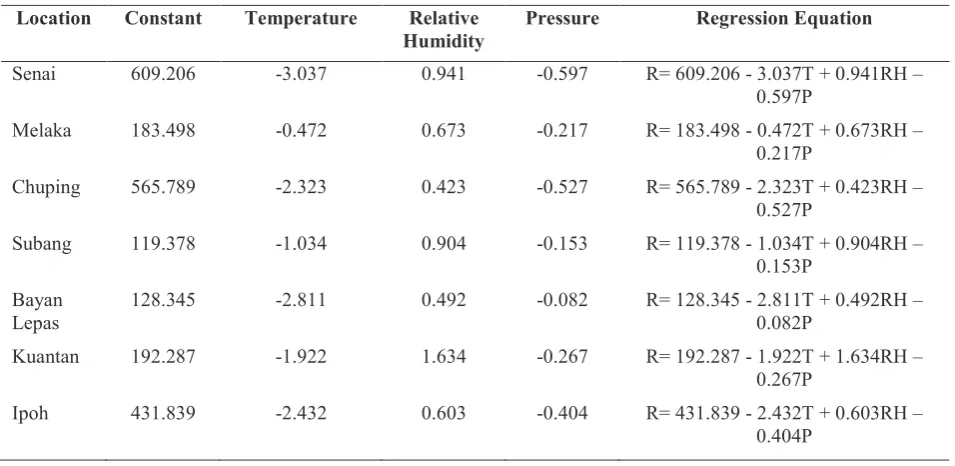
Table 4 Rainfall equations for each Malaysia meteorological station
A statistical parameter of the observed intensity of monthly rainfall from 1997 to 2007 is presented. Table 3 represents the multiple regressions for Senai station, with temperature, relative humidity, and pressure as the independent variables. In multiple regression analysis, the model takes the form of an equation that contains a coefficient for each predictor. The first part of Table 3 provides the estimates for these values, and indicates the individual contribution of each predictor to the model. The B values represent the relationship between rainfall and each predictor. It is assumed that there is a positive relationship between the predictor and the outcome if the value is positive, whereas, a negative relationship exists if the value is negative.
The significant column shows that the value of each parameter (temperature, relative humidity, and pressure) is significant if it is less than 0.05. Based on the table of coefficients, an equation can be developed by taking unstandardized coefficients (beta) B. The relation is direct if the sign is +ve (i.e., an increase in one variable is associated with an increase in the other variable and a decrease in one variable is associated with a decrease in the other variable). On the other hand, an inverse or
indirect relationship exist if the sign is –ve (i.e., an increase in one variable is associated with a decrease in the other).
The experimental results show that the three predictors (i.e., temperature, relative humidity, and pressure) are significantly related to rainfall. R2 identifies what percent of the differences is explained by the model. The squared correlation (R2) indicated that the differences for temperature, relative humidity, and pressure account for 18.1% of the variation in rainfall data in Senai; 81.9% of these differences remain unexplained in the error (residual) term. The result from seven stations shows the same rainfall equation; however, the difference is in the constant parameters. Table 4 shows the proposal equations using multiple regression analysis for each selected meteorological station in Peninsular Malaysia.
Based on the proposed multiple regression equation, the result for the Senai rainfall model is as follows.
Senai Regression equation :
R= 609.206 - 3.037T + 0.941RH – 0.597P (2)
Location Constant Temperature Relative
Humidity
Pressure Regression Equation
Senai 609.206 -3.037 0.941 -0.597 R= 609.206 - 3.037T + 0.941RH –
0.597P
Melaka 183.498 -0.472 0.673 -0.217 R= 183.498 - 0.472T + 0.673RH –
0.217P
Chuping 565.789 -2.323 0.423 -0.527 R= 565.789 - 2.323T + 0.423RH –
0.527P
Subang 119.378 -1.034 0.904 -0.153 R= 119.378 - 1.034T + 0.904RH –
0.153P
Bayan Lepas
128.345 -2.811 0.492 -0.082 R= 128.345 - 2.811T + 0.492RH –
0.082P
Kuantan 192.287 -1.922 1.634 -0.267 R= 192.287 - 1.922T + 1.634RH –
0.267P
Ipoh 431.839 -2.432 0.603 -0.404 R= 431.839 - 2.432T + 0.603RH –
70
R² = 0.9612
-5 0 5 10 15 20 25 30
0.0 20.0 40.0
S
im
u
lat
e
d
R
ai
n
fal
l
(m
m
)
Observed Rainfall, mm (1997)
R² = 0.9616
-5 0 5 10 15 20 25
0.0 20.0 40.0
S
im
u
la
te
d
R
a
in
fa
ll
(
m
m
)
Observed Rainfall, mm (2000)
R²= 0.9594
-5 0 5 10 15 20 25
0.0 20.0 40.0
S
im
u
la
te
d
R
a
in
fa
ll
(
m
m
)
Observation Rainfall,mm (2004)
R² = 0.9562
-5 0 5 10 15 20 25 30
0.0 20.0 40.0
S
im
u
la
te
d
R
a
in
fa
ll
(
m
m
)
Observed Rainfall, mm (2007) Relative humidity has positive B values, indicating
positive relationships; however, pressure and temperature has negative B values, indicating negative relationships. The B values also determine the extent to which each predictor affects the outcome if the effects of all other predictors are held constant. The result of the regression equation implies that rainfall in Senai is predicted to increase by 0.941 when relative humidity increases, and decreases by 3.037 and 0.597 for temperature and pressure, respectively.
From the equation, the value of rainfall is similar to observed rainfall. The error is minor or is less than 5%, and the parameters are related to each other. As a result, the parameters used can develop a rainfall equation. Hence, temperature, relative humidity, and pressure are related with rainfall.
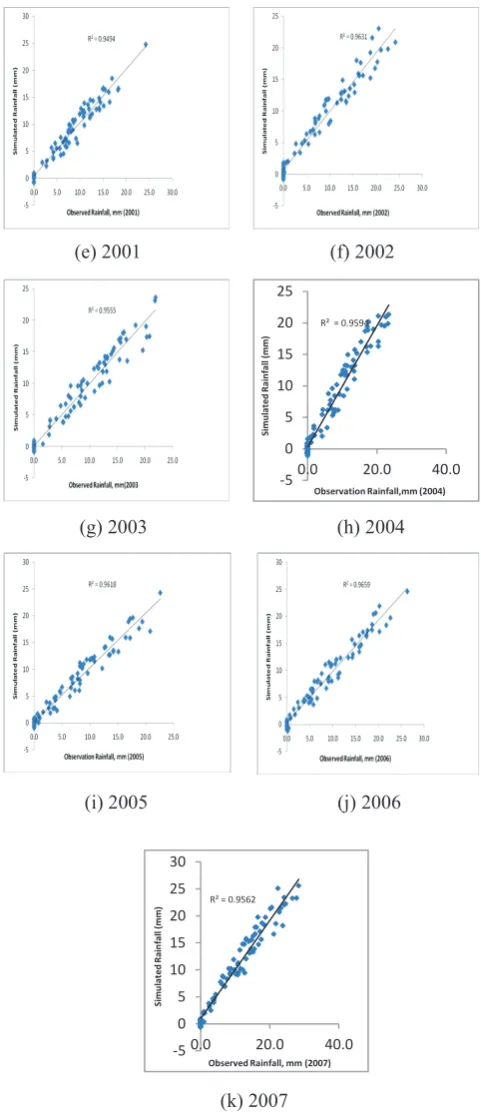
5.3 Evaluation of Senai Regression Equation
The rainfall observation data for Senai station was used to calibrate and validate the regression equation for Senai. Fig. 5 (a) to Fig. 5 (k) show the comparison of the observation and simulation rainfall of the rainfall model. The simulated rainfall is plotted against the observed rainfall on a 1:1 scale. With few exceptions, the points generally fall close to the 1:1 line. However, the regression equation for Senai tends to overestimate rainfall on the falling limb. Judging from the high values for the calibration and validation exercises of 0.95, the performance of the regression equation for modeling rainfall is considered satisfactory.(a) 1997 (b) 1998
(c) 1999 (d) 2000
(e) 2001 (f) 2002
(g) 2003 (h) 2004
(i) 2005 (j) 2006
(k) 2007
R² = 0.787
0 5 10 15 20 25
0.0 5.0 10.0 15.0 20.0
S
im
u
la
te
d
R
a
in
fa
ll
(
m
m
)
Observed Rainfall, mm (2011)
A multiple regression analysis is conducted again to validate the relationship between rainfall and the criterion variables (pressure, relative humidity, and temperature). A validation test is performed before conducting the regression analysis to ascertain that all assumptions in the range selected are met.
Further analysis is carried out on the total simulated and observed rainfalls from 1997 to 2007, as shown in Fig. 6. The plot implies an almost perfect prediction. Thus, several conclusions on the significance of the variables used in deriving the equation could be drawn from this finding.
Fig. 6 Comparative analysis of the total simulated and observed rainfalls for the years 1997 to 2007.
5.4
Calibration and Validation
Most calibration studies in the earlier period involved several figures of optimization of the parameter values by comparing the results of repeated simulations with the available observations of the catchment response. The parameter values are adjusted, either manually or by various computerized optimization algorithm, between
each run of the model until a ‘best fit’ parameter set is
found. Methods of model calibration that assume a finest parameter set and ignore the estimation of predictive uncertainty involve simple trial and error methods with parameter values adjusted and the variety of automatic optimization methods.
The problem of parameter calibration should be addressed after a model is chosen for consideration in a project. In general, estimating the parameters of a model is possible by either measurement or prior estimation. A stage of parameter calibration is necessary before the model is applied to make quantitative predictions for a particular catchment.
In this study, meteorological data (e.g., rainfall, temperature, relative humidity, and pressure) for the calibration and validation process are selected for year 2008 and January 2011 for Senai station and January 2011 for Hospital Kota Tinggi station. For the development of the flood inundation model, Hospital Kota Tinggi station was selected because it is located in the site of the study (i.e., Kota Tinggi catchment), which
will be matched and calibrated using Senai equation. All the calibration and validation processes refer to the range identified in the early process, where the cluster value in R2 line, which value is in the range, is shown.
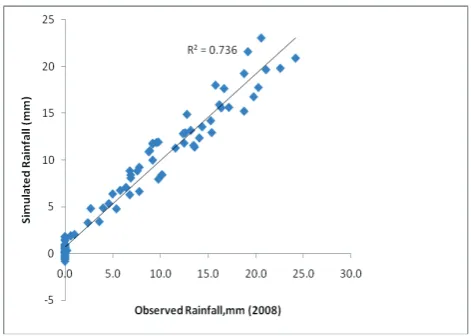
Based on the Senai equation, calibration is performed using meteorological data for Senai station in 2008. The R2 value for year 2008 is 0.736, which falls within the identified range. Fig. 7 shows the calibration process and the result of R2 value for 2008 in Senai station.
Fig. 7 Calibration analysis of simulated and observed rainfalls in 2008 for Senai Station
In the validation process for the rainfall model, meteorological data (rainfall, temperature, relative humidity, and pressure) are selected in January 2011 for Senai station. There are 12 days selected in this process, which followed the range selected in the early analysis. The R2 value is 0.787, which lies within the possible range. Fig. 8 shows the validation analysis for Senai station for January 2011. Based on the calibration and validation results, Senai equation can be used in the same station with the range selected.
Fig. 8 Validation analysis of simulated and observed rainfalls for the January 2011 for Senai Station.
72
R² = 0.849
0 5 10 15 20 25
0.0 10.0 20.0 30.0 40.0 50.0
S
im
u
la
te
d
R
a
in
fa
ll
(
m
m
)
Observed Rainfall, mm (2011)
on the equation, the value of R2 is 0.849, which falls within the range. Fig. 9 shows the validation analysis of the total simulated and observed rainfalls for January 2011 in Hospital Kota Tinggi station. The analysis shows that uncertainties and sensitivity may also depend on the period of data used. In regression, these uncertainties will normally become larger as the model predicts the responses for an increasing number of extreme conditions relative to the data used in calibration.
Fig. 9 Validation analysis of simulated and observed rainfalls for January 2011 in Hospital Kota Tinggi station.
5.5
Development of rainfall model for
hydrological use
The development of the rainfall model for the hydrological use has incorporated with selected meteorological parameter. Meteorological data at Senai MMD station are selected in the development of the rainfall model because the geography of this location is nearest and the most similar to the study area compared from the other MMD stations. There is an MMD station at Hospital Kota Tinggi; however, this station does not have complete historical data to develop a rainfall model. Other than the geographic location, Senai station is selected because the data are more accurate than those in the other stations. According to the proposal, the rainfall model will be developed with multiple regression models using SPSS Software, and it is chosen in the permitted boundary conditions for the model and selected meteorological data. From the developed rainfall model (the Senai equation), R=609.206-3.037T+0.941RH–
0.597P, the calibration and validation tests show good result in the acceptable range. The validation test for Senai equation with meteorological data of the Hospital Kota Tinggi station also indicates positive results, allowing this model to be used in Kota Tinggi catchment for the next hydrological model.
6.
Conclusion
This research explored the potential of rainfall modeling over selected catchments in Kota Tinggi, Johor. A case study of an extreme storm event during the northeast monsoon on January 2007 set an example of a typical convective storm produced by extremely strong
monsoon winds, which combined with uplift-inducing conditions in upper atmospheric levels to produce continual, intense rainfall and the tidal effect over the catchment. Damages to homes and infrastructure, including those in the densely populated city of Kota Tinggi, are one of the consequences of the flood. With the increasing demands on water resources throughout the world, improved decision making within a context of fluctuating weather patterns from year to year is necessary.
This study aims to evaluate the use of meteorological data for the development of the multiple regressions for rainfall model and identify potential obstacles that might hinder the use of such data. This approach is a new development in the analysis of rainfall distribution design. The approach is demonstrated using meteorological data for the selected station and this is the first study using meteorological data for the Kota Tinggi catchment. Therefore, from the perspective of the derivation of the rainfall model, the specified range of observation using the identified variables are needed instead of the actual intensity of the meteorological parameter for the seven meteorological stations in Peninsular Malaysia. Hence, the use of historical meteorological data should at least provide results as reliable as those achieved using rainfall data only.
The
core objectives outlined for this project were successfully achieved which is to establish the rainfall model (by establishing the derived rainfall model for a specified range of observation using the identified variables, and evaluating and validating the performance of the derived rainfall model for historical daily rainfall data in Senai station). Senai regression equation was developed and analyze with identify significant predictors.Senai Regression equation ..is:
R= 609.206 - 3.037T + 0.941RH – 0.597P
To evaluate the efficacy of the model in evaluating the relationship between rainfall and other meteorological parameters, the predictive capabilities of a model should be compared with historical data. The comparison of models is usually accomplished by testing the developed models of interest on a data set from the same catchment. The calibration of developed models is very complex and involves a lengthy calibration procedure. However, to achieve this goal is inconceivable given the time frame available. Therefore, the developed rainfall models in this study were compared to those in the other meteorological stations and are calibrated with different meteorological data.
Acknowledgements
The author/authors would like to thank the Ministry of Higher Education, Malaysia, Malaysia Meteorological Department, Department of Irrigation and Drainage, Malaysia, University Tun Hussein Onn Malaysia and University Teknologi MARA for the support of this research.
References
[1] Fowler, H.J., Kilsby, C.G., and O’Connell, P.E. A Stochastic Rainfall Model for the Assessment of Regional Water Resources System under Changed Climatic Condition.Journal of Hydrology and Earth System Science, Volume 4, (2000), pp. 263-282. [2] Coe, R., and Stern, R.D. Fitting Models to Daily
Rainfall Data. Journal of Applied Meteorology, Volume 21, (1982), pp. 1024-1031.
[3] Ekstrom, M., Fowler, H.J., Kilsby, C.G., and Jones, P.D. New Estimates of Future Changes in Extreme Rainfall Across the UK Using Regional Climate Model Integrations 2. Future Estimates and Use in Impact Studies. Journal of Hydrology, Volume 300, (2004), pp. 234-251.
[4] Feng, S., Nadarajah, S., and Hu, Q. Modelling Annual Extreme Precipitation in China Using the Generalized Extreme Value Distribution. Journal of Meteorological Society of Japan, Volume 85, (2007), pp. 599-613.
[5] Fowler, H.J., Ekstrom, M., Kilsby, C.G., and Jones, P.D. New Estimates of Future Changes in Extreme Rainfall Across the UK Using Regional Climate Model Integrations 1. Assessment of Control Climate. Journal of Hydrology, Volume 300, (2004), pp. 212-233.
[6] Islam, M.N., Terao, T., Uyeda, H., Hayashi, T., and Kikuchi, K. Spatial and Temporal Variations of Precipitation in and Around Bangladesh. Journal of Meteorological Society of Japan, Volume 83, (2005), pp. 21-39.
[7] Tapp, R.G., Woodcock, F., and Mills, G.A. The Application of Model Output Statistics to Precipitation Prediction in Australia. American Meteorological Society, Monthly Weather Review, Volume 114, (1986), pp. 50-60.
[8] Fujibe, F., Yamazaki, N., and Kobayashi, K. Long Term Changes of Heavy Precipitation and Dry Weather in Japan. Journal of Meteorological Society of Japan, Volume 84, (2006), pp. 1033-1046.
[9] Araki, R., Yamanaka, M.D., Murata, F., Hashiguchi, H., Oku, Y., Sribimawati, T., Kudsy, M., and Renggono, F. Seasonal and Interannual Variations of Diurnal Cycles of Wind and Cloud Activity Observed at Serpong, West Jawa, Indonesia.Journal of Meteorological Society of Japan, Volume 84A, (2006), pp. 171-194.
[10]Carrera-Hernandez, J.J., and Gaskin, S.J. Spatio Temporal Analysis of Daily Precipitation and Temperature in the Basin of Mexico. Journal of Hydrology, Volume 336, (2007), pp.231-249. [11]Kilsby, C.G., Jones, P.D., Burton, A., Ford, A.C.,
Fowler, H.J., Harpham, C., James, P., Smith, A., and Wilby, R.L. A Daily Weather Generator for Use in Climate Change Studies. Journal of Environmental Modelling and Software, Volume 22, (2007), pp. 1705-1719.
[12]Wooten, R.D. Statistical Analysis of the Relationship Between Wind Speed, Pressure and Temperature.
Journal of Applied Science, Volume 11(15), (2011), pp. 2712-2722.
[13]SPSS (UK) Ltd. Introduction to SPSS and Statistics:
Training Course Handbook. United Kingdom, (2005).
[14]Razi, M.A., Ariffin, J., Tahir, W., and Arish, N.A.M. Flood Estimation Studies using Hydrologic Modeling System (HEC-HMS) for Johor River, Malaysia.
Journal of Applied Sciences, Volume 10(11), (2010), pp. 930-939.
[15]Department of Irrigation and Drainage. Manual Saliran Mesra Alam Malaysia (MASMA), Volume 5, (2000).
[16]Noorbakhsh, M.E., Rahnama, M.B., and Montazeri, S. Estimation of Instantaneous Unit Hydrograph with Clark's Method Using GIS Techniques. Journal of Applied Sciences, Volume 5(3), (2005), pp. 455-458. [17]Adib, M.R.M., Saifullizan, M.B., Wardah, T.,
Rokiah, D., and Junaidah, A. Flood Inundation
Modeling for Kota Tinggi Catchment by
Combination of 2D Hydrodynamic Model and Flood Mapping Approach. International Association of Lowland Technology, Volume 13(1), (2011), pp. 26-34.
[18]Joseph, N., Wasserman, W., and Kutner, M. H. Applied Linear Regression Models. Richard D. Irwin, Inc, (2006).