Corresponding author, email: [email protected] (S. Sedaghat).
Tel.: +9821 65672971; Fax,: +9821 65672972.
Contents lists available at Avicenna Publishing Corporation (APC)
Asian Journal of Green Chemistry
Journal homepage: www.ajgreenchem.com
Orginal Research Article
Green synthesis and characterization of silver nanoparticles
using fructose
Elham Arshadi, Sajjad Sedaghat*, Omid Moradi
Department of Chemistry, College of Science, Shahr–e–Qods Branch, Islamic Azad University, Shahr–e–Qods, Iran
A R T I C L E I NF O R MA T I O N A B S T R A C T
Received: 24 August 2017
Received in revised: 16 October 2017
Accepted: 17 October 2017
Available online: 23 Novamber 2017
DOI: 10.22631/ajgc.2017.96293.1020
The green synthesis of nanoparticles is an important branch and a relatively new emerging field in nanotechnology which is easy, environmentally friendly, cost effective, and economically efficient in comparison with the chemical and physical methods. In the present work, for the first time, green synthesis of silver nanoparticles (AgNPs) was carried out by using fructose solution as a reducing agent at room temperature. The silver nanoparticles were characterized by UV-Vis, FTIR, XRD, and TEM analysis. The UV-Vis spectral studies confirmed the surface plasmon resonance of the green synthesized silver nanoparticles. The role of different functional groups in formation of the AgNps was shown by FTIR. X-ray diffraction results confirmed the formation of the the AgNPs and TEM results indicated that the average particle size of the silver nanoparticles was 13.24±8.591 nm.
KEYWORDS
Green synthesis Silver nanoparticles Fructose
E. Arshadi et al. 42
Graphical Abstract
Introduction
Nanotechnology is a principally attractive area of research related to producing nanoparticles with various sizes, shapes, chemical compositions, dispersity, and possible application for benefit of human beings [1]. One of the most important fields of research in nanotechnology is the synthesis of different nanoparticles such as silver, gold, iron, and etc [2, 3].
Green synthesis and characterization of … 43
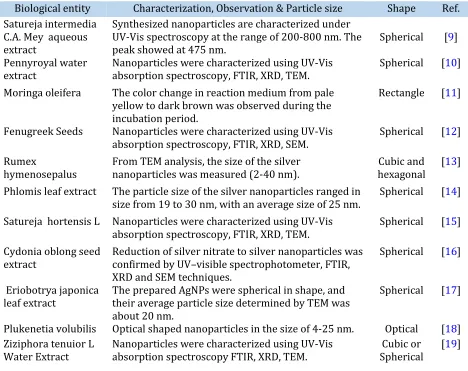
agent, and iii) choosing a non-toxic stabilizer [6]. Some natural bioactive compounds which are extracted from enzymes, fungi, bacteria, vitamins, sugars, and plant are appropriate to reduce Ag+ ion from (I) to (0) oxidation state. This is due to the abundances of hydroxyl, aldehyde, ketone, and amino groups that present in these natural resources [7, 8]. Various biological entities that may act as the reducing and capping agents in silver nanoparticles synthesis are summarized in the (Table 1).
In this study, for the first time we successfully synthesized the AgNPs by using fructose as the reducing and capping agent. One of the advantages of this method is being able to use renewable materials like polysaccharides that are eco-friendly agents. These green-synthesized nanoparticles were evaluated by ultraviolet-visible spectroscopy (UV-Vis), transmission electron microscopy (TEM), powder x-ray diffraction (XRD), scanning electron microscopy (SEM), and Fourier transform infrared (FT-IR) spectroscopy.
Table 1. Uses of various biological entities in the synthesis of silver nanoparticles during the period
of 2003−2017
Ref. Shape
Characterization, Observation & Particle size Biological entity
[9] Spherical
Synthesized nanoparticles are characterized under UV-Vis spectroscopy at the range of 200-800 nm. The peak showed at 475 nm.
Satureja intermedia C.A. Mey aqueous extract
[10] Spherical
Nanoparticles were characterized using UV-Vis absorption spectroscopy, FTIR, XRD, TEM. Pennyroyal water
extract
[11] Rectangle
The color change in reaction medium from pale yellow to dark brown was observed during the incubation period.
Moringa oleifera
[12] Spherical
Nanoparticles were characterized using UV-Vis absorption spectroscopy, FTIR, XRD, SEM. Fenugreek Seeds
[13] Cubic and
hexagonal From TEM analysis, the size of the silver
nanoparticles was measured (2-40 nm). Rumex
hymenosepalus
[14] Spherical
The particle size of the silver nanoparticles ranged in size from 19 to 30 nm, with an average size of 25 nm. Phlomis leaf extract
[15] Spherical
Nanoparticles were characterized using UV-Vis absorption spectroscopy, FTIR, XRD, TEM. Satureja hortensis L
[16] Spherical
Reduction of silver nitrate to silver nanoparticles was confirmed by UV–visible spectrophotometer, FTIR, XRD and SEM techniques.
Cydonia oblong seed extract
[17] Spherical
The prepared AgNPs were spherical in shape, and their average particle size determined by TEM was about 20 nm.
Eriobotrya japonica leaf extract
[18] Optical
Optical shaped nanoparticles in the size of 4-25 nm. Plukenetia volubilis
[19] Cubic or
Spherical Nanoparticles were characterized using UV-Vis
absorption spectroscopy FTIR, XRD, TEM. Ziziphora tenuior L
E. Arshadi et al. 44
[20] Spherical
Spherical shaped nanoparticles in the size of 55-90 nm.
Seed exudates of Sinapis arvensis
[21] Spherical
The biosynthesized silver nanoparticles have spherical shapes and the particle size ranges from 5 to 15 nm with a mean size of 8 nm.
Sargassum Muticum aqueous extract
[22] Cubic
Reaction mixtures turned dark brown, predominance of silver nano sized crystallites (12.72 nm) after short incubation period.
Annona Reticulata L
[23] Spherical
This method yields stable, spherical silver nanoparticles with an average hydrodynamic diameter of 17.96 ± 0.16 nm.
Citrullus lanatus Fruit Rind Extract
[24] Crystalline
and spherical The obtained nanoparticles were highly uniform with
average size of 18.1 nm. Leaf extract of
Thevetia peruviana Juss
[25] Spherical
From TEM analysis, the size of the silver nanoparticles was measured (87 nm). Salmonella
typhirium
[26] Cubic or
Spherical The formation of nanoparticles was observed within
20 min. Pedalium murex leaf
extract
[27] Crystalline
Nanoparticles were characterized using UV-Vis absorption spectroscopy, FTIR, XRD, TEM. Ziziphus Jujuba
[28] Spherical
Scanning electron microscopy micrograph showed formation of well-dispersed silver nanoparticles in the range of 10-40 nm.
Schizophyllum radiatum
Experimental
Matreials and methods
Fructose (C6H12O6) and silver nitrate (AgNO3, 99.80%) were purchased from Merck (Germany). All the samples were used without any further treatment. All aqueous solutions were prepared using double-distilled water. The UV-Visible spectra were recorded over the 325‒800 nm range with a UV Bio-TEK UV-Visible spectrophotometer. Deionized water was used for diluting the samples and then filled in a quartz cuvette with 1 cm path length. The crystalline structure of the silver nanoparticles was investigated by X-ray analysis (XRD, Inel, EQUINX 3000). Transmission electron microscopy was (TEM, Carl Zeiss, EM 10 C-100 kV) employed to evaluate the morphology and particle size of the AgNPs. Scanning electron microscopy (SEM, HITACHI S-4160) was used to investigate the shape, size and the surface area of the silver nanoparticles. FT-IR spectral analysis was conducted within a 4000-400 cm-1 range, with a Shimadzu spectrophotometer (Model 8400 S), using KBr pellets mixed with the dried and purified nanoparticles. The instrument was operated under the diffuse reflectance mode with a resolution of 4 cm-1 and the average scans of 50.
Green synthesis and characterization of … 45
For the synthesis of AgNPs, a certain volume of the fructose solution (5 mL) was added to the AgNO3 solution (0.01 M) and the volume was adjusted to 45 ml with de-ionized water. Then two solutions were mixed drop by drop while and the mixture was stirring. Initial pH of solution was about 7.5 which changed to 5.6 at the end of reaction. In this method, AgNO3 was reduction by fructose solution as a reducing agent at room temperature.
Results and discussion
UV-Vis Spectroscopy
Producing and stabilizing of the reduced silver nanoparticles in the colloidal solution was monitored by using UV-Vis spectrophotometer analysis. UV-Vis spectroscopy is one of the most important techniques to identify the formation and stability of the silver nanoparticles in the aqueous solution [29]. Silver nanoparticles are known to exhibit at maximum in the range of 400 to 500 nm. The UV-Vis absorption spectra recorded for AgNPs solution and suspension in water are shown in Figure 1. The maximum absorption at 436 nm can be attributed to the plasma resonance absorption of the silver nanoparticles.
XRD analysis
The x-ray diffraction analyses were carried out to determine the various phases of the silver nanoparticles. Figure 2 demonstrates the XRD pattern of the dried synthesized Ag nanoparticles by fructose. The spectrum exhibited five distinct separate peaks at 2θ of about 32.04°, 38.10°, 44.37°, 46.17°,63.57°, and 81.67° are associated with (122), (111), (200), (231), (220), and (311) orientations, respectively, which are matched to the face-centered cubic (fcc) phase of Ag°. The (111) peak oriented the most amount of the absorption of Ag nanoparticle and the absenceof other peaks shows that the AgNPs are pure [30]. The average crystalline size of the silver nanoparticles was estimated using Equation 1 (Debye-scherrer equation)
D = (1)
E. Arshadi et al. 46
Figure 1. UV-Vis absorption spectra of a) fructose solution and, b) AgNPs dispersed in water
Figure 2. XRD patterns of AgNPs synthesized by fructose solution
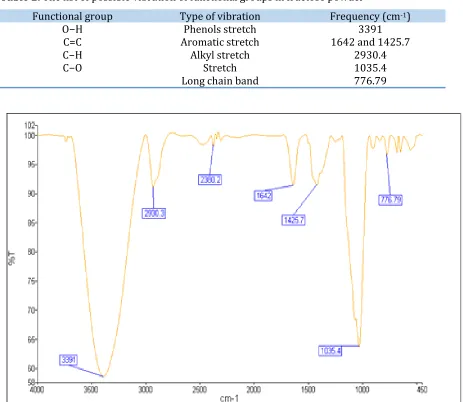
FTIR analysis
Green synthesis and characterization of … 47
demonstrated in Figure 3. The fructose solution spectrum consists of several bands at 3391, 1035.4, 2930.3, 776.79, 1642, and 1425.7 cm-1. Table 2 illustrates possible vibration of functional groups in fructose powder. The strong peak at 3391 cm-1 corresponded to (−OH) stretching, which is due to phenolic compounds present in the fructose solution. The band at 2930.3 cm-1 was attributed to alkane C−H stretching vibration. The peak at 1035.4 cm-1 was corresponded to (C−O) stretching. The peak at 1642 cm-1 corresponded to (C=C) stretching vibration of aromatic rings. Previous studies confirmed that the hydroxyl groups have a stronger ability to interact with nanoparticles and therefore the secondary metabolites containing hydroxyl group may act as capping agents for formation of the stable silver nanoparticles.
Table 2. The list of possible vibration of functional groups in fructose powder
Functional group Type of vibration Frequency (cm-1)
O−H Phenols stretch 3391
C=C Aromatic stretch 1642 and 1425.7
C−H Alkyl stretch 2930.4
C−O Stretch 1035.4
Long chain band 776.79
E. Arshadi et al. 48
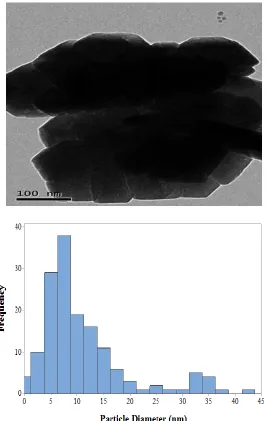
TEM analysis
The silver nanoparticles synthesized by fructose were studied using transmission electron microscopy (TEM). The TEM image confirmed the formation of the silver nanoparticle at nano-size. As can be seen in Figure 4, most of the AgNPs are well dispersed and have an angular shape with an average particle size of 13.24±8.591. The method used in the present work allowed obtaining AgNPs with smaller sizes in comparison with different studies using other biological compounds as reducer and stabilizer agents reported in literature. Having a control over the size and structure of the resultant nanoparticles can be related to the interactions between the bio-compounds (including polysaccharides, proteins, polyphenols, and phenolic) and metal atoms.
Green synthesis and characterization of … 49
Conclusion
Silver nanoparticles with an average particle size of 13.24±8.591 nm and angular shape were synthesized using the fructose at room temperature. Silver nanoparticles were characterized by UV-Vis, FT-IR, TEM, and XRD. The UV-Vis spectral studies confirmed the surface plasmon resonance of the green synthesized silver nanoparticles. The green synthesis method is a simple, eco-friendly, low cost, and capable of producing AgNPs at room temperature. This rapid synthesis technique can be a promising method for the preparation of other metal nanoparticles and can be valuable in environmental, bio-technological, pharmaceutical, and medical applications.
Acknowledgments
The authors are thankful to the Islamic Azad University, Shahr-e-Qods branch for their support.
Disclosure statement
No potential conflict of interest was reported by the authors.
References
[1]. Karimi J., Mohsenzadeh S. J. Med. Sci., 2013, 111:64
[2]. Muthoosamy K., Bai R.G., Abubakar I.B., Sudheer S.M., Lim H.N., Loh H.S., Huang N.M., Chia Ch., Manickam S. Int. J Nanomedicine, 2015, 10:1505
[3]. Allafchian A.R., Majidian Z., Ielbeigi V., Tabrizchi M. Anal. Bioanal. Chem., 2016, 408:839 [4]. Phanjom P., Ahmed G. Nanosci Nanotechnol., 2015, 5:14
[5]. Awwad A.M., Salem N.M. Nanosci Nanotechnol., 2012, 2:125
[6]. Darroudi M., Bin Ahmad M., Ibrahim A. Int. J. Nanomed., 2011, 6:569 [7]. Azmi A.A., Ahyat N.M. Malaysian Journal of Analytical Sciences, 2015, 6:1187
[8]. Jitendra M., Amla B., Abhijeet S., Madan M.S. Adv. Nat. Sci: Nanosci. Nanotechnol., 2014,
5:043002
[9]. Firoozi S., Jamzad M., Yari M. J Nanostruct Chem., 2016, 6:357
[10]. Sedaghat S., Esmaeili Agbolag A., Bagheriyan S. J Nanostruct Chem., 2016, 6:25
[11]. Nayak. D., Pradhan. S., Ashe. S., Rauta. PR. J Colloid Interface Sci., 2015, 457:329 [12]. Meena R.K., Chouhan N. Res. J. Recent Sci., 2015, 4:47
[13]. Leon E.R., Palomares R.I., Navarro R.E., Urbina R.H., Tanori J., Palomares C.I., Maldonado A. Nanoscale Res. Lett., 2013, 8:318
E. Arshadi et al. 50
[16]. Zia F., Ghafoor N., Iqbal M., Mehboob S. Appl Nanosci., 2016, 6:1023 [17]. Rao B., Tang R. Adv. Nat. Sci.: Nanosci. Nanotechnol., 2017, 8:015014 [18]. Kumar B., Smita K., Cumbal L., Debut A. Saudi J Bio Sci., 2014, 21:605 [19]. Sedaghat S., Afshar P. Journal of Applied Chemical Research, 2016, 1:103
[20]. Khatami M., Pourseyedi S., Khatami M., Hamidi H., Zaeifi M., Soltani L. Bioresources and Bioprocessing, 2015, 2:19
[21]. Azizi S., Namvar F., Mahdavi M., Bin Ahmad M.,Mohamad R. Materials, 2013, 6:5942
[22]. Ghotekar S.K., Pande S.N., Pansambal S.S., Sanap D.S., Mahale K.M., Sonawane B. World Journal of Pharmacy and Pharmaceutical Sciences, 2015, 4:1304
[23]. Ndikau M., Noah N.M., Andala D.M., Masika E. International Journal of Analytical Chemistry, 2017, 1:1
[24]. Oluwaniyi O.O., Haleemat I., Alabi B., Bodede O., Labulo Ayomide H., Oseghale Charles O. Appl Nanosci., 2016, 6:903
[25]. Ghorbani H.R. Journal of Nanostructure in Chemistry, 2013, 3:29
[26]. Anandalakshmi K., Venugobal J., Ramasamy V. Appl Nanosci., 2016, 6:399
[27]. Gavade NL., Kadam AN., Suwarnkar MB., Ghodake VP., Garadkar KM. Spectrochim Acta A Mol Biomol Spectrosc., 2015, 136:953
[28]. Metuku R.P., Pabba S., Burra S., Gudikandula K., Singara Charya M.A. 3 Biotech, 2014, 4:227 [29]. Ramar M., Manikandan B., Raman T., Arunagirinathan K., Palanisam S. Molecular and Biomolecular Spectroscopy, 2015, 138:120
[30]. Abidin Ali Z., Yahya R., Devi Sekaran S., R. Puteh. Advances in Materials Science and Engineering, 2016, 1:7
[31]. Shameli K., Bin Ahmad M., Jazayeri D., Sedaghat S., Shabanzadeh P., Jahangirian H.,Mahdavi M., Abdollahi Y.Int. J. Mol. Sci., 2012, 13:6639
How to cite this manuscript: Elham Arshadi, Sajjad Sedaghat*, Omid Moradi. Green synthesis