United Kingdom Vol. IV, Issue 2, February 2016
Licensed under Creative Common Page 144
http://ijecm.co.uk/
ISSN 2348 0386
WHY STILL DEVELOP NATIONAL STANDARDS FOR EXPORT?
AN INDONESIA CASE STUDY
Biatna Dulbert Tampubolon
Chair of Innovation Economics, VWS2, Technische Universität Berlin, Germany [email protected]
Abstract
Trade liberalisation has run into the common policy to reduce trade barriers. However, each
country seeks to protect the interests of its domestic producers against the competitive pressure
of imported goods. Many countries use the standards and conformity assessment as laid down
in the Non-Tariff Measures. The tendency of all the countries, particularly developing countries,
to adopt international standards is greater because it reduces the time, costs less, and helps to
open up new markets. Why are developing countries still developing national standards for
export? According to results derived from empirical data analysis using a concordance table, the
value of the correlation coefficient is relatively small, but higher up to 2 years, and still significant
(𝑟𝑠< 0,05). Overall, this has had a significant impact on the Indonesian trade. Viewed from the
best linear regression model, there are some positive and negative impacts in some product
sectors. The growth rate of standards development in Indonesia contributed 14.42% positive
impact on the export value since the year 2000 to 2014 and the growth of standards adoption
only yielded 10.02% positive impact in the same period. Overall, the combination of these two
factors had a positive impact at 12.54%.
Keywords: National standard, adoption, export value, international trade, Indonesia trade
INTRODUCTION
Licensed under Creative Common Page 145 avoid losses, e.g., due to safety problems, or by placing the goods on the export market (Beghin et al., 2013). A partnership between the private actors and the bilateral trade increased the use conformity assessments by third parties, e.g., through Mutual Recognition Agreements in the food sector (Blind et al., 2013).
Some references related to standards and trade in developed countries such as the UK, Germany, Canada, and France, mentioned the existence of a strong relationship between standards and international trade, with one of them being the opening of new markets (Swann, 2010, Swann, 1996). As we know, developed countries have advanced technology development and standardisation. But for developing countries, technology and standardisation are still undergoing the development process. Therefore, in general, developing countries tend to follow the developed countries because of standards development, mostly initiated by developed countries.
Some countries try to protect the interests of their domestic manufacturers from the competitive pressure of the imported goods. Meanwhile, many countries are using Non-Tariff Measures (NTMs), such as standards and conformity assessment (Beghin et al., 2013, Chen and Mattoo, 2008, Berti and Falvey, 2011). Standards can become barriers to entry in the market (John C. Beghin). In the NTMs face of imperfections in the market, protect potential market respectively. Standardisation activities further improve their transparency by consensus. (Fischer and Serra, 2000, Berti and Falvey, 2011, Marette and Beghin, 2010). In the last decade, activities of standards and conformity assessment in regional and international trade such as ASEAN and APEC increased significantly.
On trade assumption, foreign markets are more at risk for failure than the domestic market (Beghin et al., 2013). This approach assumed that domestic producers and consumers have been fully responsive in meeting all domestic regulations. The local producers find it easier to sell their products and try to monopolise the domestic market. They are closer to their consumers and use feedback to improve their product in a shorter time. But the domestic market has been supported by the infrastructure of conformity assessment, and so both, domestic and foreign producers, imposed production requirements (voluntary or mandatory standards). Domestic and foreign suppliers have to make different efforts to meet market needs. External suppliers, however, also have a positive impact, such as technology transfer.
Licensed under Creative Common Page 146 country, will be higher than the policies established by the global social planner to facilitate the flow of goods (Fischer and Serra, 2000).
In international transactions, not all types of goods are inspected. This is because so many types and varieties of goods are available and it will be more complicated to manage the goods flow. Entry inspection of goods is of a general nature, although there is the special inspection for some type of goods in the group, such as food security, which is implemented through HACCP, ISO 22000, and Codex Alimentarius, where a preventive approach to food safety is a priority. In this approach, the implementation of food safety standards will be examined at a critical moment in the processing of foods susceptible to contamination, and might likely endanger health, thereby reducing health risks. Enforcement of standards, and compliance with the supplier directly, depends on the program and inspection policy.
The cost of implementing food safety standards by foreign manufacturers in developing countries is initially high (Liu21 and Yueb, 2013). Although it raises the production costs when applying the standard, the marginal costs of maintaining this standard become comparatively small. The marginal cost is even less as compared to US producers of seafood (Cato and Subasinge, 2003). Increasing and tightening the rules by using analytical limitations, such as residues in seafood in developed countries, have a negative impact on the imports of these products so that there will be the decline of their bilateral trade.
Efforts made by foreign manufacturers are higher than the domestic manufacturers, because of the additional cost for international shipping, and must follow the rules of entry of goods to the market by the domestic regulator. Additionally, the potential for foreign producers to bear the sunk cost is higher. Therefore, the regulator always monitors the measures manufacturer in maximising the welfare of domestic or international prosperity, and imposes the standards on foreign and domestic manufacturers (Beghin et al., 2013). Sometimes, the manufacturers conducting quality improvements have a chance to get incentives from the local government, but the cost of promotion or advertising tends to increase steadily.
Licensed under Creative Common Page 147 Some literature on the effects of national standards on exports from one country to another, have a negative impact (Blind and Jungmittag, 2001), negative and significant impact (Van Beers and Van Den Bergh, 1997, Wilson et al., 2002), positive and significant impact (Blind, 2001, Moenius, 2004, Moenius, 2006b, Moenius, 2006a, Swann, 1996). Most of the literature based on the bilateral trade model and scopes only the small number of national standards (not regulation) on specific sectors, such as agriculture, and textiles (Fontagné et al., 2005, Beghin et al., 2013, Swann, 2010, Czubala et al., 2007).
Swann et al. (1996) described the relationship between standards and the trade performance, using the UK's total trade (exports and imports) to the world. But the UK is a developed country in terms of technology, industry, and standardisation, while Indonesia is only a developing country in three.
Development National Standard
Each country has its own standards development policy. Based on the number of standards drawn up and set out each year, the trend of the development standards policy in the state can be seen. In the following figure, it is shown how national standards development in Indonesia since 1987. For the purpose of conducting an analysis, we need data about the number of standards available in each sector, but do not need to measure the extent to which they are used. The standards will be associated with each industrial sector, and the products traded in the international trade.
Licensed under Creative Common Page 148 Implementation of the national standard is expected to increase the value of trade; therefore, the country which applies the standards will get the benefit. In peoples' perspectives on standards, it is a source of advantage in competitiveness, a supporting factor in trade, and also a constraint on international trade (Swann, 1996). But it could hurt foreign producers if it is enforced, raising their costs. In contrast with the international policy, it will use the standards to maximise global welfare (Marette, 2008, Van Tongeren et al., 2009).
Budget and time for standard development are not small, and has several stages to pass, such as consensus and e-balloting. This is in accordance with ISO / IEC Guide 2 (Sari et al., 2013), so that the tendency for each country to adopt the international standards is larger because of the reduction in time and budget. The new standard will have the potential to open up new markets for products using this standard. This becomes a great opportunity for the country to initiate the preparation of standards. In Indonesia, industries in the country can apply the standards on their product before the BSN adopts it (survey of BSN in 2008).
The standard was initially voluntary, but when it was adopted in the technical regulations, it become mandatory. In general, developing countries adopt the standards into their regulation. But in this paper, we do not consider which ones are already adopted or not; we ignore the impact of standards that have been adopted in regulations, because the regulations only affect the domestic trade.
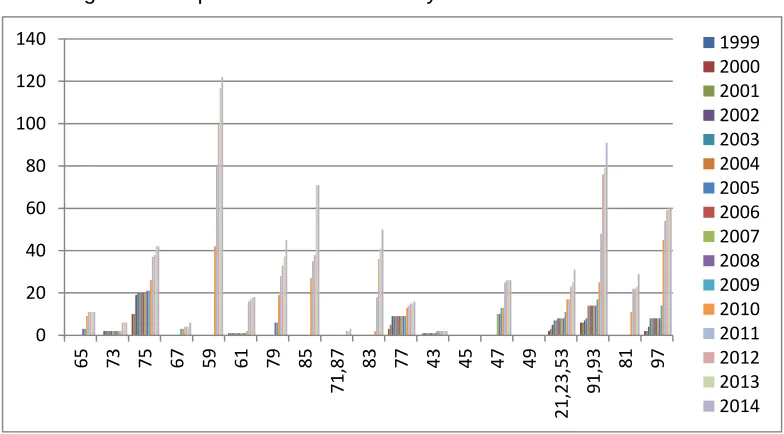
The figure below shows the number of adoptions from international standards (ISO, IEC, ITU, CAC), association standards (ASTM, API, NFPA, ASME, AWS, NACE, ASCE, TAPPI), and other country standards (ANSI, JIS, AS, BS, NZS, API), to the SNI.
Figure 1: Adoption Standard to SNI by ICS classification 1999-2014
0 20 40 60 80 100 120 140
65 73 75 67 59 61 79 85
71
,8
7 83 77 43 45 47 49
21
,2
3,53 91,9 3 81 97
Licensed under Creative Common Page 149 Adaptation costs for exporters are higher when national standards are not harmonised with international standards, but the existences of national standards still provide valuable information for product adaptation on the market. Without information on standards, the exporter will incur more costs to collect. Hence, the standards reduce the costs required for product adaptation (Moenius, 2004).
Some standards may be an opportunity for countries to access or enhance the development of markets of developed countries. Strict enforcement in the domestic standards in developing countries will engender a national reputation for safety products and encourage their exports. Variations of the standard are important in the chain of the production process, to obtain high product quality. In general, there are several types of standards: standard of definition, standard of quality, standard of management, standard of testing, and so on. The standard has two effects in competitiveness. Companies have used standards to enhance the competitiveness and transparency of technical specifications for foreign suppliers (Blind, 2004).
Figure 2: Stock of Indonesia National Standard 1987-2014
Effect to Export Values
The restriction of trade policy allows the use of alternative policy options such as standard, the border inspection policy, and labeling, in an international context. Under the terms of efficiency in NTMs, the welfare losses are much clearer as compared to tariffs and quotas. More diverse sources of supply would be greater if the cost of each source of supply could be sorted out and they cannot discriminate the supplier with the reason of tariffs and quotas.
0 1000 2000 3000 4000 5000 6000 7000 8000 9000
Number
year
Licensed under Creative Common Page 150 Differences in the product standards of different countries or economic areas often cause conflict in international trade, particularly between developed countries and developing countries, because each government has a different concern about their product regulation (Beghin et al., 2013). Increasingly stringent product standards in developed countries, pose challenges for countries that are trying to explore the growing international market potential. This poses a challenge for the developing countries, as special equipment, industrial engineers, and local government inspections may all be substantially scarcer and, therefore, more expensive to obtain. The poor countries experience greater difficulties in complying with safety regulations such as in the food sector, imposed by their trading partners (Unnevehr, 2000).
The Porter hypothesis (1995), presented strict standard or regulation, which can introduce better quality to improve trading competitiveness, for developing countries to use strict standards as a stimulus for the export supply chains, and to adopt the safety practices and quality control in the agricultural field and food manufacturing. Maximum residue level (MRL) is the highest level of pesticide residues tolerated in food, and ensures the lowest possible exposure to consumers (Beghin et al., 2013). The difference in the MRL on the trade will help improve the flow of export from countries that have met the standards required by the market. For example, based on research by Achterbosch, MRL helped boost the Chilean fruit exports to the European Union, after Chile successfully meet the requirements of the EU market (Achterbosch et al., 2009).
When the competition increased among non-exporters, the company led to a better productive reallocation or to export the company. A company chooses this alternative to export the company or reallocation to improve the effectiveness of production. This will bring new products to the market, which will also help increase the efficiency, because of the lower labor costs in the developing country and reduction in the transportation cost which is quite high.
In some recent literature, the company is seen to be more productive if the company is to become an exporter or better serve foreign markets and become exporters, although the sink risk of exporting is higher (Beghin et al., 2013). The company having an increased capacity to meet the strict standards could provide the basis for a more sustainable and profitable trade in the long term. When the company can fulfil the requirement using stricter standards, this will encourage the innovation to produce more competitive products.
Licensed under Creative Common Page 151 Product sector on standards and export value may be represented by a single- or double-l digit code or more. Thus, standards and trade development can indicate a negative or positive impact on every sector. Reyes (2010), studied the impact of EU harmonisation of standards in the electronics sector, to conclude that it increases the likelihood of US companies entering the EU market. The national standard development is expected to affect the value increase in the trade. The implementation of standards has a different impact on each sector, which we will see, are based on the classification of ICS and HS and associated with the industrial sector.
International standards are increasingly adopted and used by governments and companies in developing countries for international trade or competence requirements in the international market (Cebr, 2015). Increased awareness from developing countries in international standard development was demonstrated by the increase in participation in Technical Committee or Sub-Committee in international standardisation (Maertens and Swinnen, 2009).
Figure 3: Indonesia National Export to Worldwide 1999-2014
Standard, Industry and Trade
In this paper, we will use three different classifications, namely the classification for standard, industry, and exports (trade), wherein each classification has a provision in its respective grouping. The standard uses the International Classification for Standards (ICS). This classification is structured to classify national, regional, and international standards, and other normative documents in databases, libraries, etc. This classification is applied on standards,
0 50 100 150 200 250
Value (US$)
B
ill
io
n
s
Year
Licensed under Creative Common Page 152 standard profiles, technical specifications, technology assessments, technical reports, technical regulations, guidelines, codes of practice, etc.
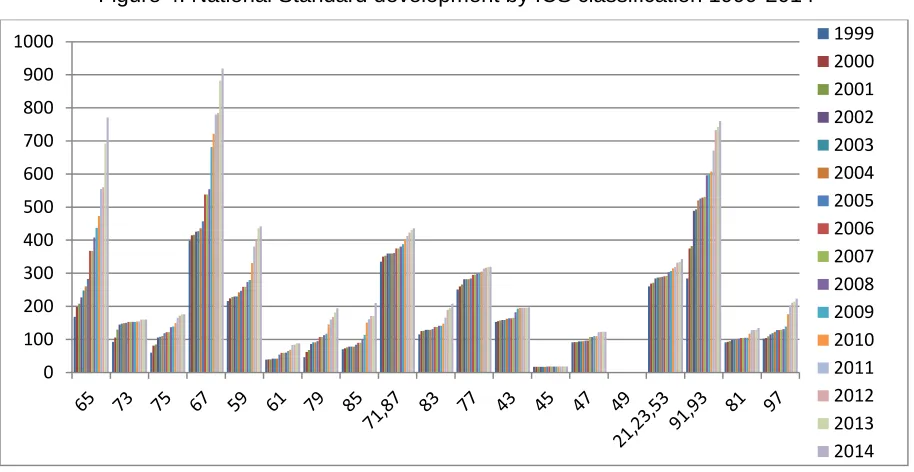
Development of national standards is not the same for each type of product. It is generally based on the market needs, technology changes used in the product, and supporting the standardisation policy. In developing countries, development standards policy is commonly one of the key responsibilities belonging to a government institution. The figure below shows the number of national standards that are developed in Indonesia based on the classification of ICS.
Figure 4: National Standard development by ICS classification 1999-2014
The International Standard Industrial Classification (ISIC) is a classification used in the industrial sector. It’s a classification category of productive economic and social activities in the industry for collecting and reporting statistics such as for national accounts statistics, demography of enterprises, jobs, and others, for non-statistical purposes (United Nations, 2008). This classification was an ISIC adoption in 1948, which most countries around the world have used as a classification for national and international events. This paper uses the ISIC, Rev.4, a revision of the ISIC classification in 2008.
And for trading, the Harmonised Systems (HS) classification has been used, which contains descriptions and coding system of the harmony of the customs’ nomenclature, which has been standardised internationally, and used to classify the products or goods trade, developed and organised by the World Customs Organisation (WCO). WCO has a membership of more than 170 member countries, and is based in Brussels, Belgium.
0 100 200 300 400 500 600 700 800 900
1000 1999
Licensed under Creative Common Page 153 The author also calculates a simple growth rate as a comparison between two values in a different time, shown as a percentage of the initial value:
Growth rate =present value − past value past value
𝑟 =𝑣𝑡− 𝑣0 𝑣0
Concordance
In this paper, the authors take a red line for the relationship of the third grouping as a product. Other economic activities such as service, definition, management, testing, and other services in the ISIC classification are not covered in this study. The effect of the national standard in management, such SNI ISO 9000 series, even though they have impacts to support export product quality, is also not included (Tampubolon and Janitra, 2011). This concordance is the study result from some conversions which have published, such as concordance between ISIC Revision 3 industry classifications, and ICS standard classification (Blind, 2004), concordance from United Nations Statistics Division, and Indonesia Statistical Bureau.
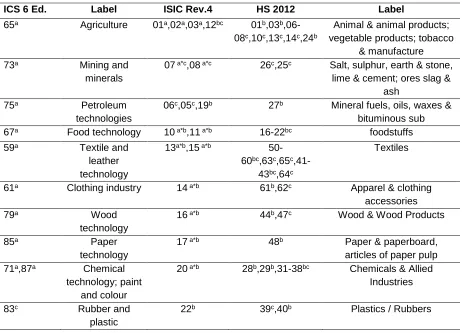
Table 1: Concordance between ICS 6 Ed., ISIC Rev.4, and HS 2012
ICS 6 Ed. Label ISIC Rev.4 HS 2012 Label
65a Agriculture 01a,02a,03a,12bc 01b,03b
,06-08c,10c,13c,14c,24b
Animal & animal products; vegetable products; tobacco
& manufacture
73a Mining and
minerals
07 a*c,08 a*c 26c,25c Salt, sulphur, earth & stone,
lime & cement; ores slag & ash
75a Petroleum
technologies
06c,05c,19b 27b Mineral fuels, oils, waxes &
bituminous sub
67a Food technology 10 a*b,11 a*b 16-22bc foodstuffs
59a Textile and
leather technology
13a*b,15 a*b
50-60bc,63c,65c
,41-43bc,64c
Textiles
61a Clothing industry 14 a*b 61b,62c Apparel & clothing
accessories
79a Wood
technology
16 a*b 44b,47c Wood & Wood Products
85a Paper
technology
17 a*b 48b Paper & paperboard,
articles of paper pulp 71a,87a Chemical
technology; paint and colour
20 a*b 28b,29b,31-38bc Chemicals & Allied
Industries
83c Rubber and
plastic
Licensed under Creative Common Page 154 77a Metallurgy 24 a*b,25 a*c 72-76bc,78-83c,93c Metals
43a Road vehicles 29b 87b Vehicles other than railway
or tramway
45ac Railway
30 a*c
86c Railway or tramway
47ac Shipbuilding and
marine structures
89c Ships, boats, & floating
structures
49ac Aircraft and
space vehicle
88c Aircraft, spacecraft
21a,23a,53c Mechanical; fluid
for general use; materials
handling equipment
28 a*,27c,26c 84a,85b,90c Machinery / electrical;
optical, photographic, cinematographic, measuring, checking,
precision, medical or surgical instruments 91a,93a Construction
materials and building; civil engineering;
41 a*c,43c,42 a*c 68c Stone, plaster, cement,
asbestos, mica, or similar materials
81c Glass and
ceramics
23b 70c,69b Glass & glassware; ceramic
products
97c Domestic and
commercial equipment
31c 94c Furniture
a) concordance by Knut Blind (2004)
a*) with conversion between ISIC rev 3 and ISIC rev 4 b) concordance from United Nations Statistics Division
c) concordance from Indonesia Statistical Bureau
Pearson and Spearman Correlation
In time-series, the data is frequently interrupted about many things, particularly on trade. So the author realised a lot of interruption on the trade value (export) such as economic recession, weakening exchange rates, government policies, difficulties of material, etc. In this paper, we are not considering about that, but look at the correlation between the standard development and the export product value, and the significance of simultaneous and partial sector. Therefore, a regression is needed and the coefficient of the independent variable will show the positive or negative influence to the dependent variable. The independent variable is the number of development standard and the number of adoptions from international standard or other country standard, and dependence variable is the export value.
Pearson correlation: rxy= Sxy
Sx∙Sy=
n ∑ xiyi−∑ xi∑ yi
√n ∑ xi2−(∑ x
i)2∙√n ∑ yi2−(∑ yi)2
Spearman's rho correlation: rs= 1 − 6 ∑ di2 n(n2−1)
Licensed under Creative Common Page 155 ANALYSIS AND FINDINGS
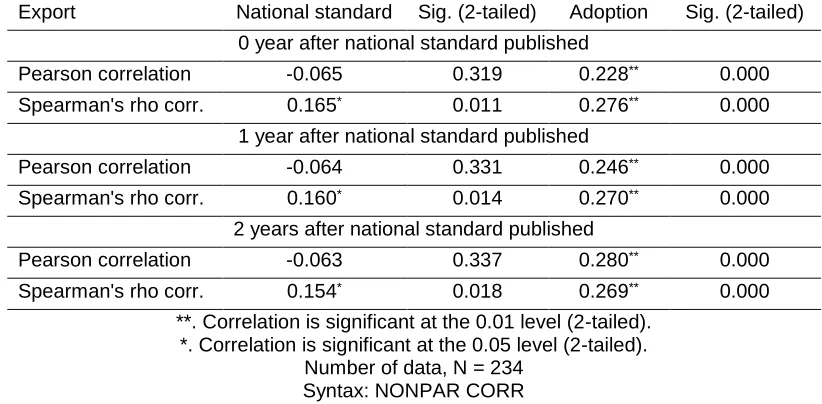
The first result related to a correlation coefficient of national standards development and the adoption of the standard on the export value. The effectiveness of the implementation of national standards will be shown from the correlation coefficient and significant value. In the table below, we can see that a correlation coefficient value event is relatively small, but increases from year to year (from the first year published or 0 years until 2 years), and still remains significant (significant value 𝑟𝑠< 0,05). This means that the impact of the national standards implementation on the export value becomes higher and higher.
Table 2: Summary of Correlation Value of National Standards and Adoption on Export Value Export National standard Sig. (2-tailed) Adoption Sig. (2-tailed)
0 year after national standard published
Pearson correlation -0.065 0.319 0.228** 0.000
Spearman's rho corr. 0.165* 0.011 0.276** 0.000
1 year after national standard published
Pearson correlation -0.064 0.331 0.246** 0.000
Spearman's rho corr. 0.160* 0.014 0.270** 0.000
2 years after national standard published
Pearson correlation -0.063 0.337 0.280** 0.000
Spearman's rho corr. 0.154* 0.018 0.269** 0.000
**. Correlation is significant at the 0.01 level (2-tailed). *. Correlation is significant at the 0.05 level (2-tailed).
Number of data, N = 234 Syntax: NONPAR CORR /VARIABLES=X1 X2 Y /PRINT=BOTH TWOTAIL NOSIG
/MISSING=LISTWISE.
In general, for a developing country like Indonesia, we find in this study whether national standards development and adoption of standards will always have a positive impact on exports when there is product information, even though there are differences in the specifications of export products at destination countries.
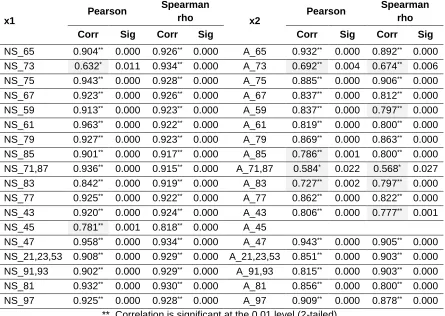
Licensed under Creative Common Page 156 Table 3: Pearson and Spearman's Rho Correlation of National Standards Development (X1)
and Adoption of Standard (X2) on Export Value (Y)
x1 Pearson
Spearman
rho x2 Pearson
Spearman rho
Corr Sig Corr Sig Corr Sig Corr Sig
NS_65 0.904** 0.000 0.926** 0.000 A_65 0.932** 0.000 0.892** 0.000
NS_73 0.632* 0.011 0.934** 0.000 A_73 0.692** 0.004 0.674** 0.006
NS_75 0.943** 0.000 0.928** 0.000 A_75 0.885** 0.000 0.906** 0.000
NS_67 0.923** 0.000 0.926** 0.000 A_67 0.837** 0.000 0.812** 0.000
NS_59 0.913** 0.000 0.923** 0.000 A_59 0.837** 0.000 0.797** 0.000
NS_61 0.963** 0.000 0.922** 0.000 A_61 0.819** 0.000 0.800** 0.000
NS_79 0.927** 0.000 0.923** 0.000 A_79 0.869** 0.000 0.863** 0.000
NS_85 0.901** 0.000 0.917** 0.000 A_85 0.786** 0.001 0.800** 0.000
NS_71,87 0.936** 0.000 0.915** 0.000 A_71,87 0.584* 0.022 0.568* 0.027
NS_83 0.842** 0.000 0.919** 0.000 A_83 0.727** 0.002 0.797** 0.000
NS_77 0.925** 0.000 0.922** 0.000 A_77 0.862** 0.000 0.822** 0.000
NS_43 0.920** 0.000 0.924** 0.000 A_43 0.806** 0.000 0.777** 0.001
NS_45 0.781** 0.001 0.818** 0.000 A_45
NS_47 0.958** 0.000 0.934** 0.000 A_47 0.943** 0.000 0.905** 0.000
NS_21,23,53 0.908** 0.000 0.929** 0.000 A_21,23,53 0.851** 0.000 0.903** 0.000
NS_91,93 0.902** 0.000 0.929** 0.000 A_91,93 0.815** 0.000 0.903** 0.000
NS_81 0.932** 0.000 0.930** 0.000 A_81 0.856** 0.000 0.800** 0.000
NS_97 0.925** 0.000 0.928** 0.000 A_97 0.909** 0.000 0.878** 0.000
**. Correlation is significant at the 0.01 level (2-tailed). *. Correlation is significant at the 0.05 level (2-tailed).
From the table above, it can be seen that some of the data in the standard national variable showed a correlation coefficient for some classes such as by Pearson correlation: NS_73, NS_45 (x1), A_73, A_85, A_71,87, A_83 (X2) and by Spearman rho: A_73, A_59, A_71,87, A_83, A_43 (x2). However, all of the data have a significant correlation.
Licensed under Creative Common Page 157 Table 4: Model Summary of Linear Regression Models between Standard and Value of Exports
Model R R Square Adjusted R Square Std. Error of the
Estimate
Dimension 0
1 .963a .927 .921 12.03576
2 .976b .953 .945 10.05703
3 .986c .973 .965 7.98051
4 .993d .986 .981 5.95916
a. Predictors: (Constant), NS_61 b. Predictors: (Constant), NS_61, A_71,87 c. Predictors: (Constant), NS_61, A_71,87, A_65 d. Predictors: (Constant), NS_61, A_71,87, A_65, A_67
e. Dependent Variable: y (export)
Results from a statistic program in the figure above, shows that the determination coefficient in the equation linear model above, represent the ability of independent variables to explain the variance of the dependent variable in the model 4 (𝑅2= 0.993) and model 3 (𝑅2= 0.986), or the square of the correlation coefficient between standards development and export value, better than other models.
Variable coefficient (in beta), and partial correlation values, show the influence of variables; does it a positive or negative effect? And based on the significant value, does it indicate that the variable has a significant effect or not?
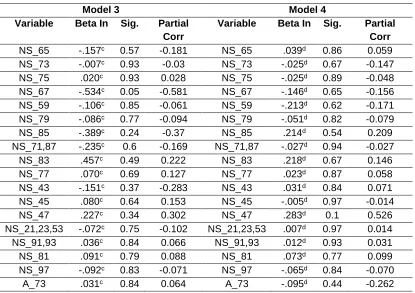
Table 5: Summary of Variable Coefficient and Partial Correlation by Regression Model (3 and 4)
Model 3 Model 4
Variable Beta In Sig. Partial Corr
Variable Beta In Sig. Partial Corr
NS_65 -.157c 0.57 -0.181 NS_65 .039d 0.86 0.059
NS_73 -.007c 0.93 -0.03 NS_73 -.025d 0.67 -0.147
NS_75 .020c 0.93 0.028 NS_75 -.025d 0.89 -0.048
NS_67 -.534c 0.05 -0.581 NS_67 -.146d 0.65 -0.156
NS_59 -.106c 0.85 -0.061 NS_59 -.213d 0.62 -0.171
NS_79 -.086c 0.77 -0.094 NS_79 -.051d 0.82 -0.079
NS_85 -.389c 0.24 -0.37 NS_85 .214d 0.54 0.209
NS_71,87 -.235c 0.6 -0.169 NS_71,87 -.027d 0.94 -0.027
NS_83 .457c 0.49 0.222 NS_83 .218d 0.67 0.146
NS_77 .070c 0.69 0.127 NS_77 .023d 0.87 0.058
NS_43 -.151c 0.37 -0.283 NS_43 .031d 0.84 0.071
NS_45 .080c 0.64 0.153 NS_45 -.005d 0.97 -0.014
NS_47 .227c 0.34 0.302 NS_47 .283d 0.1 0.526
NS_21,23,53 -.072c 0.75 -0.102 NS_21,23,53 .007d 0.97 0.014
NS_91,93 .036c 0.84 0.066 NS_91,93 .012d 0.93 0.031
NS_81 .091c 0.79 0.088 NS_81 .073d 0.77 0.099
NS_97 -.092c 0.83 -0.071 NS_97 -.065d 0.84 -0.070
Licensed under Creative Common Page 158
A_75 -.001c 1 -0.002 A_75 -.060d 0.66 -0.150
A_67 -.366c 0.01 -0.702 A_59 -.148d 0.51 -0.224
A_59 -.015c 0.96 -0.016 A_61 .021d 0.86 0.061
A_61 .069c 0.65 0.144 A_79 .011d 0.98 0.009
A_79 -.370c 0.52 -0.208 A_85 -.206d 0.14 -0.475
A_85 -.197c 0.31 -0.323 A_83 -.034d 0.89 -0.049
A_83 .036c 0.91 0.037 A_77 -.052d 0.59 -0.183
A_77 -.026c 0.84 -0.065 A_43 -.097d 0.29 -0.351
A_43 -.192c 0.05 -0.58 A_47 .244d 0.13 0.490
A_47 .173c 0.44 0.249 A_21,23,53 -.132d 0.56 -0.197
A_21,23,53 -.339c 0.22 -0.387 A_91,93 .096d 0.76 0.106
A_91,93 .211c 0.6 0.168 A_81 .042d 0.82 0.077
A_81 .010c 0.97 0.013 A_97 -.185d 0.48 -0.237
A_97 -.170c 0.63 -0.155
From the above, linear regression model (particular model 4), shows there are 14 variables (NS_65, NS_85, NS_83, NS_77, NS_43, NS_47, NS_21,23,53, NS_91,93, NS_81, A_61, A_79, A_47, A_91,93, and A_81), which had positive impacts on the export value and 17 variables (NS_73, NS_75, NS_67, NS_59, NS_79, NS_71,87, NS_45, NS_97, A_73, A_75, A_59, A_85, A_83, A_77, A_43, A_21,23,53 and A_97), which had negative impacts on the export value. Implementation of the standard had a positive impact that was indicated by the export value. This case was also discovered by Moenius (2004), that the average of product adaptation costs, spent by exporters, became lower. A negative impact on bilateral trade was also found in the Blind & Jungmittag (2001) paper. However, in this linear regression model, there is no variable that has a significant partial correlation.
From the linear regression model 3, we can see that there is some negative, and significant impact for NS_67, A_67 and A_43; it is also the same as the research findings of bilateral trade by Vancauteren & Weiserbs (2005), and Wilson et al. (2002). The findings were based on the standard adoption data that the average years of standards adopted for too long (5.5 years for ICS 67, and 10 years for ICS 43). It becomes more understandable that exporting companies cannot increase the export value even after applying the standards for their product, because many of their competitors in other countries have known the specification information first and done export; therefore, the new exporter will find it more difficult to enter the export market (Swann, 2010).
In Indonesia, the growth rate of standards development has given 14.42% positive impact on the growth of export value since the year 2000 to 2014, and the growth of adopting standards only contribute 10.02% positive impact in the same period. The positive impact of both is 12.54%. This means that the adoption of standards may cause a decrease in the growth rates of exports. Overall it still provides 12.44% impact on the growth of export value.
Licensed under Creative Common Page 159 CONCLUSION
Several conclusions are drawn from this study of the correlation between the national standard development, adoption of the standards, and export value: the national standards development and standard implementation by the export value have a more increasing impact after the year of publishing and for up to 2 years later.
Although overall these have significant impacts on the Indonesian trade, but seen from the best linear regression model (model 4), it would seem like a positive effect only for product sectors such as agriculture, paper technology, rubber and plastic industries, metallurgy, road vehicle engineering, shipbuilding and marine structures, metals and non-metallic mineral products, construction and civil engineering, and glass and ceramics industries. Additionally, there is a negative impact for certain product sectors such as mining and minerals, petroleum and related technologies, food technology, textile and leather technology, wood technology, chemical technology and paint industries, railway engineering, and domestic and commercial equipment.
In Indonesia, the growth rate of the standards development and adoption yield an impact of 12.44% (from an average of around 12.746 billion US$ per year) on export growth from 2000 to 2014, while the growth of standard development contributed 14.42% positive impact and adoption standards give smaller number. The positive impact of adoption would lead to reduce the rate of export growth.
In this paper, the author investigates the adoption of the standards in Indonesia, especially to the standards that have been existing for more than 7 years old. The author found that the track record of adoption is still limited. No availability in digital form which make the user have to check through all hard copied, inadequate access to those standard documents and frequently published literature discussing adoption of the standard and use of standard are the most barriers. With those conditions, the author could not provide a comprehensive analysis of Indonesia national standard in all sectors to improve its export performance.
DISCUSSION
Although the implementations of national standards have an impact on trade, especially on export value, it is still not clear until when a standard provides an increasing impact before deciding whether to revise or replace with a new national standard. In general, a standard will be revised every five years, whether this is effective or not.
Licensed under Creative Common Page 160 (positive impact), in line with the wider view that national standard supports trade. Also, another important thing is the gap in the technology capabilities of the company in the production process of products.
ACKNOWLEDGEMENTS
The author would like to thank Knut Blind, Ajun Tri Setyoko, and colleagues at BSN and TU Berlin for their comments and suggestions.
REFERENCES
Achterbosch, T. J., Engler, A., Rau, M.-L. & Toledo, R. (2009). Measure the measure: the impact of differences in pesticide MRLs on Chilean fruit exports to the EU. International Association of Agricultural Economists Conference, Beijing, China, 16-22.
Baldwin, R. E. & Seghezza, E. (2010). Are Trade Blocs Building or Stumbling Blocs? Journal of economic integration, 25, 276-297.
Beghin, J. C., Beladi, H. & Choi, E. K. (2013). Non Tariff Measures with Market Imperfections: Trade and Welfare Implications, Emerald Group Publishing.
Berti, K. & Falvey, R. (2011). Does Trade Weaken Product Quality Standards? Available at SSRN 1966023.
Blind, K. (2001). The impacts of innovations and standards on trade of measurement and testing products: empirical results of Switzerland’s bilateral trade flows with Germany, France and the UK.
Information Economics and Policy,13, 439-460.
Blind, K. (2004). The economics of standards : theory, evidence, policy, Cheltenham, UK, Edward Elgar.
Blind, K. & Jungmittag, A. (2001). The Impacts of Innovation and Standards on German Trade in General and on Trade with the UK in Particular: A Step Further on Swann, Temple and Shurmer. Fraunhofer Institute for Systems and Innovation Research, Karlsruhe.
Blind, K., Mangelsdorf, A. & Wilson, J. S. (2013). Mutual Recognition of Accreditation: Does it Matter to Trade? Evidence from the Food, Beverage, and Tobacco Industry. chapter,12, 291-310.
Cato, J. C. & Subasinge, S. (2003). Food safety in food security and food trade–case study: The shrimp export industry in Bangladesh. Focus, 10.
Cebr (2015). The Economic Contribution of Standards to the UK Economy. 389 Chiswick High Road, London W4 4AL, BSI.
Chen,M. X. & Mattoo, A. (2008). Regionalism in standards: good or bad for trade? Canadian Journal of
Economics/Revue canadienne d'économique,41, 838-863.
Czubala, W., Shepherd, B. & Wilson, J. S. (2007). Help or Hindrance-The Impact of Harmonized Standards on African Exports. World Bank Policy Research Working Paper Series, Vol.
Fischer, R. & Serra, P. (2000). Standards and protection. Journal of International Economics, 52, 377-400.
Fontagné, L., Mimouni, M. & Pasteels, J.-M. (2005). Estimating the impact of environmental SPS and TBT on international trade. Integration and Trade Journal,22, 7-37.
Jaffee, S. & Henson, S. (2004). Standards and agro-food exports from developing countries: rebalancing the debate, World Bank Publications.
Licensed under Creative Common Page 161 Maertens, M. & Swinnen, J. F. (2009). Trade, standards, and poverty: Evidence from Senegal. World Development,37, 161-178.
Marette, S. (2008). Standards and Labels. Economics Bulletin,12, 1-7.
Marette, S. & Beghin, J. (2010). Are standards always protectionist? Review of International Economics, 18, 179-192.
Moenius, J. (2004). Information versus product adaptation: The role of standards in trade. Available at
SSRN 608022.
Moenius, J. (2006a). Do national standards hinder or promote trade in electrical products. Commended Paper, IEC Centenary Challenge, http://www.iecchallenge.org/papers.
Moenius, J. (2006b). The good, the bad and the ambiguous: standards and trade in agricultural products. IATRC Summer Symposium, 28-30.
Swann, G. (1996). P., P. Temple and M. Shurmer. Standards and Trade Performance: The British Experience. Economic Journal,10, 124-145.
Swann, G. P. 2010. International standards and trade.
Tampubolon, B. D. & Janitra, T. (2011). The effects of ISO 9000 standard on financial performance of manufacturing companies listed in Indonesia stock exchange. Journal of standardization,13, 7.
United Nations, D. O. E. A. S. A.-S. D. (2008). International Standard Industrial Classification of All Economic Activities - Revision 4. New York: United Nations Publication.
Unnevehr, L. J. (2000). Food safety issues and fresh food product exports from LDCs. Agricultural Economics,23, 231-240.
Van Beers, C. & Van Den Bergh, J. C. (1997). An empirical multi‐country analysis of the impact of environmental regulations on foreign trade flows. Kyklos,50, 29-46.
Van Tongeren, F., Beghin, J. & Marette, S. (2009). A cost-benefit framework for the assessment of non-tariff measures in agro-food trade.