Optimizing Rapid Response Systems
WHAT’S KNOWN ON THIS SUBJECT: The availability of rapid response systems to assist deteriorating patients is the standard of care in children’s hospitals. Metrics for evaluating their effectiveness include cardiac and respiratory arrest rates, rare events that require years of data to show significant
improvements.
WHAT THIS STUDY ADDS: A proximate outcome for in-hospital mortality among patients receiving rapid response system assistance was developed. This“critical deterioration”metric was eightfold more common than arrests and demonstrated criterion and construct validity, facilitating meaningful evaluation over shorter periods of time.
abstract
OBJECTIVES:Standard metrics for evaluating rapid response systems (RRSs) include cardiac and respiratory arrest rates. These events are rare in children; therefore, years of data are needed to evaluate the impact of RRSs with sufficient statistical power. We aimed to develop a valid, pragmatic measure for evaluating and optimizing RRSs over shorter periods of time.
METHODS:We reviewed 724 medical emergency team and 56 code-blue team activations in a children’s hospital between February 2010 and February 2011. We defined events resulting in ICU transfer and noninvasive ventilation, intubation, or vasopressor infusion within 12 hours as“critical deterioration.”By using in-hospital mortality as the gold standard, we evaluated the test characteristics and validity of this proximate outcome metric compared with a national benchmark for cardiac and respiratory arrest rates, the Child Health Corporation of America Codes Outside the ICU Whole System Measure.
RESULTS:Critical deterioration (1.52 per 1000 non-ICU patient-days) was more than eightfold more common than the Child Health Corporation of America measure of cardiac and respiratory arrests (0.18 per 1000 non-ICU patient-days) and was associated with.13-fold increased risk of in-hospital death. The critical deterioration metric demonstrated both criterion and construct validity.
CONCLUSIONS: The critical deterioration rate is a valid, pragmatic proximate outcome associated with in-hospital mortality. It has great potential for complementing existing patient safety measures for evaluating RRS performance.Pediatrics2012;129:e874–e881
AUTHORS:Christopher P. Bonafide, MD, MSCE,a,b,c,dKathryn
E. Roberts, RN, MSN, CNS, CCRN, CCNS,eMargaret A.
Priestley, MD,fKathleen M. Tibbetts, MS,a,gEmily Huang,a,h
Vinay M. Nadkarni, MD, MS,fand Ron Keren, MD, MPHa,b,c,d
aDivision of General Pediatrics,bCenter for Pediatric Clinical
Effectiveness, and Departments ofeNursing andfAnesthesia and
Critical Care Medicine, The Children’s Hospital of Philadelphia, Philadelphia, Pennsylvania;cCenter for Clinical Epidemiology and
Biostatistics, University of Pennsylvania School of Medicine, Philadelphia, Pennsylvania;dLeonard Davis Institute of Health
Economics andhSchool of Engineering and Applied Sciences,
University of Pennsylvania, Philadelphia, Pennsylvania;
gGfK Healthcare, Blue Bell, Pennsylvania
KEY WORDS
child, critical illness, early warning score, hospital rapid response team, medical emergency team, physiologic monitoring, mortality
ABBREVIATIONS
ARC—acute respiratory compromise CBT—code-blue team
CHCA—Child Health Corporation of America CHOP—The Children’s Hospital of Philadelphia CI—confidence interval
CPA—cardiopulmonary arrest DNAR—do not attempt resuscitation MET—medical emergency team ROC—receiver operating characteristic RRS—rapid response system
Dr Bonafide had full access to all of the data in the study and takes responsibility for the integrity of the data and the accuracy of the data analysis; Drs Bonafide, Priestley, Nadkarni, Keren, and Ms Roberts contributed to study concept and design, and to analysis and interpretation of data; Dr Bonafide, Ms Roberts, Ms Tibbetts, and Ms Huang contributed to the acquisition of data; Dr Bonafide and Ms Roberts contributed to drafting of the article; all authors contributed to critical revision of the article for important intellectual content; Dr Bonafide performed the statistical analysis; Drs Bonafide and Keren obtained funding for the article; and Drs Nadkarni and Keren perfomed study supervision.
In recent years, rapid response systems (RRSs) have been implemented at hos-pitals around the world in attempts to reduce rates of cardiac arrest, res-piratory arrest, and mortality outside the ICU. RRSs have 2 clinical components, an identification arm and a response arm. The identification arm consists of predictive tools to identify patients at risk for deterioration over time and detective tools to identify actively dete-riorating patients who need immediate assistance.1The response arm consists
of medical emergency teams (METs) that clinicians caring for patients out-side the ICU can summon to the bedout-side of patients exhibiting signs of deteri-oration. In addition to their clinical components, RRSs also include an ad-ministrative arm that oversees RRS operations and a process improvement arm that evaluates RRS outcomes. Due in large part to the Institute for Health-care Improvement’s 5 Million Lives Campaign with .4000 participating hospitals,2–4presence of an RRS is now
the standard of care.
Despite their intuitive appeal and wide dissemination, the success of pediatric RRSs in reducing respiratory arrest, cardiac arrest, and death (rare events that are critically important to prevent) has been highly variable among hos-pitals.5–14Because death and cardiac
arrest happen infrequently in hospital-ized children, finding statistically sig-nificant changes in their rates often requires accumulating years of data. Thus, rapid-cycle evaluation and opti-mization projects undertaken by the RRS’s process improvement arm often are underpowered by using traditional measures. Nevertheless, a commonly used dashboard metric for evaluating within-hospital patient safety success and comparing performance between hospitals is the quarterly rate of ex-ceedingly rare cardiac and respiratory arrest events outside the ICU.15Small,
statistically insignificant differences in
this rate may be used to in-appropriately draw positive or nega-tive conclusions about performance.
In this study, we aimed to develop a pragmatic, valid, proximate outcome associated with in-hospital mortality that occurs frequently enough to pro-vide the statistical power needed to evaluate RRS performance over a pe-riod of months, not years.
METHODS
We performed this retrospective cohort study at The Children’s Hospital of Phil-adelphia (CHOP), an urban, tertiary care pediatric hospital with 473 beds, of which 75 are dedicated to neonatal, 55 to pediatric, and 26 to cardiac intensive care. On February 8, 2010, the hospital implemented an RRS available to all of the non-ICU medical and surgical units except the cardiology step-down, tracheostomy-ventilator, and obstetric units. The RRS consisted of (1) an identification com-ponent, including an early warning score with corresponding care guide-lines, and (2) a response component with a 30-minute response MET avail-able 24 hours per day, 7 days per week. Informal ICU “curbside” consultation was eliminated. An immediate-response code-blue team (CBT) remained in place. Additional information about the RRS’s characteristics is available in Supple-mental Tables 3–5.
We reviewed each MET and CBT activa-tion in the 1-year period after imple-mentation (February 9, 2010 to February 8, 2011). METactivations were logged on paper forms by the responding nurse and subsequently entered into a data-base by a research assistant; CBT ac-tivations were verified by reviewing CBT messages sent via the pager system and logged directly into a database by the pediatric ICU clinical nurse spe-cialist. We abstracted patient and event characteristics, the outcome of the ac-tivation, and discharge disposition from patient charts.
For children who were transferred to the ICU, we reviewedflowsheets for 12 hours after transfer and recorded the time from ICU arrival to life-sustaining interventions, including initiation of con-tinuous or bilevel positive airway pressure, tracheal intubation, and vasopressor infusion administration (ie, dobutamine, dopamine, epinephrine, iso-proterenol, milrinone, or norepineph-rine). Five of the authors, including experts in pediatric hospital medicine (C.P.B. and R.K.), an international au-thority in RRSs and cardiopulmonary resuscitation (V.M.N.), an expert in pediatric critical care nursing (K.E.R.), and the medical director of the CHOP pediatric ICU (M.A.P.), selected these items by consensus. We classified events requiring any of these inter-ventions in thefirst 12 hours after ICU transfer as“critical deterioration.”We hypothesized that critical deterioration would be a useful proximate outcome for in-hospital mortality.
We also identified all respiratory and cardiac arrests occurring on non-ICU wards during the study period and classified them according to the Child Health Corporation of America (CHCA) Codes Outside the ICU measure.15CHCA
transfer to a higher level of care for sustained airway support. The number of combined CPA and ARC events per 1000 non-ICU patient-days is shared among all participating CHCA hospitals on a quarterly basis for internal per-formance improvement and external comparative benchmarking.
Evaluation of Critical Deterioration as a Proximate Outcome for In-Hospital Mortality
In evaluating the critical deterioration metric as a proximate outcome associ-ated with in-hospital mortality, wefirst excluded events with do-not-attempt-resuscitation (DNAR) orders at the time of activation. We then analyzed the time to life-sustaining ICU interventions like a diagnostic test for in-hospital mor-tality, generating a receiver operating characteristic (ROC) curve. We calcu-lated the in-hospital mortality rate, sensitivity, specificity, and positive and negative predictive values for potential time cut points of 1 and 4 hours, and compared those to our critical deteri-oration metric by using the 12-hour cut point. We compared the test charac-teristics for each cut point with those of the CHCA Whole System Measure for Codes Outside the ICU among CHOP patients. We selected a time cut point to use for further analysis by identifying a point with high sensitivity and relative risk, without a clinically unacceptable loss of specificity. For admissions with multiple ICU transfers, we used the transfer with the shortest time to life-sustaining intervention for the analysis, because that event likely represented the most severe CBT/MET activation during the admission.
We then evaluated the criterion and construct validity of the proposed prox-imate outcome. Criterion validity is
de-fined as the correlation of a metric with some other measures of the trait or
between the time to life-sustaining ICU interventions and the gold standard of death by calculating the relative risks of death at potential time cut points of 1 and 4 hours and compared those with our hypothesized critical deterioration metric by using the 12-hour cut point.
Construct validity is defined as the ability of a metric to measure the hy-pothetical construct it is intended to measure.16In this study, we used the
CHCA measure as the construct and assessed construct validity in 2 ways. First, we determined the proportion of patients meeting the CHCA Whole Sys-tem Measure for Codes Outside the ICU who also met the criteria for the time to life-sustaining ICU intervention met-ric at the selected cut point. Second, among patients who were transferred to the ICU and received life-sustaining interventions, we compared the median time to life-sustaining interventions be-tween the patients who met CHCA Whole System Measure for Codes Outside the ICU and those who did not by using the Wilcoxon rank-sum test.
We managed the data by using Micro-soft Access 2003 (MicroMicro-soft Corp, Red-mond, WA), and analyzed it by using Stata 11.1 (StataCorp, College Station, TX). Because a de-identified quality improvement data set was used for the analysis, this project was granted an exemption by CHOP’s institutional re-view board.
RESULTS
Event Characteristics
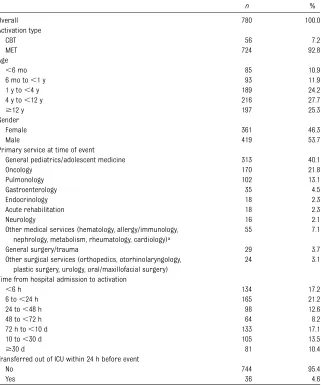
Between February 9, 2010 and February 8, 2011, there were 780 combined MET and CBTactivations for 525 patients and 596 admissions over a total of 79 428 non-ICU patient-days and 28 015 all-hospital admissions (9.8 activations per 1000 non-ICU patient-days, 27.8 acti-vations per 1000 hospital admissions,
response MET activations. Twelve of the CBT activations fulfilled CHCA ARC criteria, and 2 fulfilled CPA criteria. The CHCA Codes Outside the ICU rate at CHOP was 0.18 codes per 1000 non-ICU patient-days (95% confidence in-terval [CI]: 0.10–0.30 codes per 1000 non-ICU patient-days). The patient and event characteristics are presented in Table 1.
Of the 724 MET activations, 272 (37.6%) resulted in transfer to the ICU, com-pared with 44 of 56 (78.6%) CBT re-sponses (P , .001). Of the total 780 activations, 121 (15.5%) met our defi ni-tion of critical deteriorani-tion (requiring life-sustaining ICU interventions in the
first 12 hours after ward-to-ICU trans-fer). The rate of critical deterioration was 1.52 per 1000 non-ICU patient-days, more than eightfold more common than CHOP’s CHCA Codes Outside the ICU rate.
Evaluation of Critical Deterioration as a Proximate Outcome for In-Hospital Mortality
Of the 587 admissions with MET or CBT activations, 114 (19.4%) fulfilled critical deterioration criteria. Of those 114 ad-missions, 19 ended in death, for an in-hospital mortality rate of 16.7%. Of the remaining 473 admissions not requiring life-sustaining ICU interventions in the
first 12 hours after ward-to-ICU transfer, 6 ended in death, for an in-hospital mor-tality rate of 1.3%.
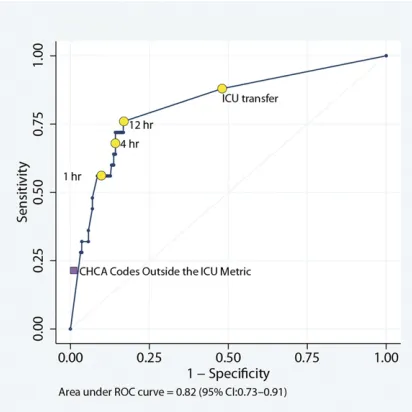
The area under the ROC curve for the time to life-sustaining ICU interventions was 0.82 (95% CI: 0.73–0.91) (Fig 2). The in-hospital mortality rate, test charac-teristics, and relative risk of death for cut points of 1 and 4 hours compared with the 12-hour critical deterioration cut point are shown in Table 2. The sensitivity of the critical deterioration metric was 76.0% (95% CI: 54.9–90.6),
the specificity was 83.1% (95% CI: 79.7– 86.1), the positive predictive value was 16.7% (95% CI: 10.3–24.8), and the negative predictive value was 98.7% (95% CI: 97.3–99.5). Compared with life-sustaining ICU intervention cut points of 1 and 4 hours, the 12-hour critical deterioration metric offered higher sensitivity while maintaining specificity .80%. Compared with the ICU transfer FIGURE 1
Flow diagram of CBT and MET activations.
cut point (which considers a positive test to be any ICU transfer regardless of whether interventions were required), the 12-hour cut point offers higher spec-ificity and positive predictive value at an only slightly lower sensitivity. The choice of the 12-hour cut point also is supported graphically by the ROC curve, which shows a sharp rise in sensitivity from 1 to 12 hours with minimal loss of specificity, followed by a flattening of the curve between 12 hours and the ICU transfer cut point, representing a sub-stantial loss of specificity with mini-mal gain in sensitivity. In evaluating the criterion validity of the critical deterioration metric, we found that
the relative risk of death was 13.1 (95% CI: 5.4–32.1).
In comparison, the sensitivity of the CHCA measure was 20.0% (95% CI: 6.8– 40.7), the specificity was 98.8% (95% CI: 97.4–99.5), the positive predictive value was 41.7% (95% CI: 15.2–72.3), and the negative predictive value was 96.5% (95% CI: 94.7–97.9). In evaluating its criterion validity, we found that the relative risk of death was 12.0 (95% CI: 5.4–26.6).
In our first method of evaluating the construct validity of the critical de-terioration metric, we found that 11 of 12 admissions (91.6%) with a CHCA Code
did not meet critical deterioration cri-teria qualified as a CHCA CPA because staff administered chest compressions briefly while the patient was being treated in the ward, but the patient was hemodynamically stable on CBT arrival, was not transferred to the ICU, and likely had not actually experienced a cardiac arrest.
In our second method of evaluating the construct validity, we found that among the 11 admissions with a CHCA code blue who fulfilled critical deterioration cri-teria, the median time to intervention was 0 minutes (most interventions were started en route to the ICU or imme-diately on arrival), and the interquartile range was 0 to 15 minutes. Of the 103 admissions not meeting CHCA coblue criteria but meeting critical de-terioration criteria, the median time to intervention was 45 minutes, and the interquartile range was 15 to 170 minutes (P,.001).
DISCUSSION
To improve the process improvement component of RRSs, we set out to de-velop a pragmatic measure for their ongoing evaluation and optimization. This study is thefirst to directly com-pare the performance of a national benchmark metric to a proximate, cor-related outcome and the gold standard of death before hospital discharge. We developed the critical deterioration me-tric as a useful outcome upstream of in-hospital mortality and demonstrated its criterion and construct validity by evaluating its association with in-hospital mortality and a commonly used dash-board metric, the rate of CHCA Codes Outside the ICU. Critical deterioration occurred .8 times more frequently than the CHCA metric and was associ-ated with a.13-fold increased risk of death among patients who received treatment from the MET and the CBT.
Overall 780 100.0
Activation type
CBT 56 7.2
MET 724 92.8
Age
,6 mo 85 10.9
6 mo to,1 y 93 11.9
1 y to,4 y 189 24.2
4 y to,12 y 216 27.7
$12 y 197 25.3
Gender
Female 361 46.3
Male 419 53.7
Primary service at time of event
General pediatrics/adolescent medicine 313 40.1
Oncology 170 21.8
Pulmonology 102 13.1
Gastroenterology 35 4.5
Endocrinology 18 2.3
Acute rehabilitation 18 2.3
Neurology 16 2.1
Other medical services (hematology, allergy/immunology, nephrology, metabolism, rheumatology, cardiology)a
55 7.1
General surgery/trauma 29 3.7
Other surgical services (orthopedics, otorhinolaryngology, plastic surgery, urology, oral/maxillofacial surgery)
24 3.1
Time from hospital admission to activation
,6 h 134 17.2
6 to,24 h 165 21.2
24 to,48 h 98 12.6
48 to,72 h 64 8.2
72 h to,10 d 133 17.1
10 to,30 d 105 13.5
$30 d 81 10.4
Transferred out of ICU within 24 h before event
No 744 95.4
Yes 36 4.6
aCardiology patients who show signs of deterioration usually receive urgent assistance from the cardiac ICU staff and do not
Its sensitivity was nearly 4 times that of the CHCA metric, with only a modest loss of specificity.
Cardiac and respiratory arrests defined by using CHCA criteria for CPA and ARC were rare, with only 14 events occurring on non-ICU inpatient units in 1 year, for a rate of 0.18 codes per 1000 non-ICU patient-days. This rate is consistent with post-RRS implementation combined code rates in children’s hospitals.6,9,10
Although these events are important to measure because they represent criti-cally ill children who required emer-gent resuscitation while hospitalized
on non-ICU wards, they are so rare that accruing a sufficient number to detect statistically significant changes can take years. For example, to detect a 50% reduction in code rate from 0.20 to 0.10 codes per 1000 patient-days with 80% power and an a of .05, a study would require.500 000 patient-days. Because critical deterioration is appro-ximately eightfold more common than CHCA code events, detecting a 50% re-duction from 1.50 to 0.75 per 1000 patient-days would require far fewer patient-days (∼70 000). Therefore, it can be used to more efficiently evaluate
rapid-cycle RRS optimization steps in a single hospital or to compare the per-formance of multiple hospitals over a period of months rather than years.
When faced with the challenge of me-asuring reductions in rare events, an alternative strategy is analyzing the number of days between events. This strategy is recommended by the In-stitute for Healthcare Improvement17
for the measurement of rare events, including cardiac and respiratory ar-rest. The days between events are con-venient to measure and easy to plot on g-type statistical control charts.18 Yet
they have an important limitation. Comparing the number of days be-tween events ignores the denominator: the person-time at risk for the outcome (such as non-ICU patient-days). The developer of g-charts acknowledges this limitation and advises that it is
“fairly safe to ignore [variation in the denominator] if it does not vary from its average by more than around 10%.”18
The census of children’s hospitals var-ies widely (.10%) by season19 and
among hospitals,20 making the days
between metrics inadequate for evalu-ating within-hospital change or across-hospital comparison.
At our hospital, the combined MET/CBT activation rate was high, at 27.8 calls per 1000 hospital admissions. Previously reported pediatric MET call rates range FIGURE 2
ROC curve and corresponding cut points for the time to life-sustaining ICU interventions.“ICU transfer” indicates the cut point of patients transferred to the ICU, regardless of whether they received life-sustaining interventions.
TABLE 2 Test Characteristics of Cut Points for the Time to Life-Sustaining ICU Interventions Group and/or
Cut Point
CHCA Codes Outside the ICU Measure
ICU Transfer + Life-Sustaining Intervention
Within 1 Hour
ICU Transfer + Life-Sustaining Intervention
Within 4 Hours
ICU Transfer + Life-Sustaining Intervention
Within 12 Hours (Critical Deterioration Metric)
ICU Transfer With or Without Interventions
Admissions 12 68 97 114 270
Deaths 5 14 17 19 22
In-hospital mortality rate, % (95% CI)
41.7 (15.2–72.3) 20.6 (11.7–32.1) 17.5 (10.6–26.6) 16.7 (10.3–24.8) 8.1 (5.2–12.1)
Sensitivity, % (95% CI) 20.0 (6.8–40.7) 56.0 (34.9–75.6) 68.0 (46.5–85.1) 76.0 (54.9–90.6) 88.0 (68.8–97.4) Specificity, % (95% CI) 98.8 (97.4–99.5) 90.4 (87.6–92.7) 85.8 (82.6–88.5) 83.1 (79.7–86.1) 52.0 (47.7–56.2) PPV, % (95% CI) 41.7 (15.2–72.3) 20.6 (11.7–32.1) 17.5 (10.6–26.6) 16.7 (10.3–24.8) 7.5 (4.8–11.1) NPV, % (95% CI) 96.5 (94.7–97.9) 97.9 (96.2–98.9) 98.4 (96.8–99.3) 98.7 (97.3–99.5) 99.0 (97.0–99.8) RR of death, % (95% CI) 12.0 (5.4–26.6) 9.7 (4.6–20.5) 10.7 (4.8–24.2) 13.1 (5.4–32.1) 7.4 (2.2–24.5)
NPV, negative predictive value; PPV, positive predictive value; RR, relative risk.
adult hospitals, high MET utilization“dose” (.25 calls per 1000 admissions) is asso-ciated with improved patient outcomes.21
Further optimization of RRSs requires
finding the optimal MET utilization dose beyond which there is marginal improve-ment in critical deterioration rates.
There were a few limitations to this project. First, we developed the critical deterioration metric by using data from a single center. Multicenter validation is needed. Second, the positive predictive value of the critical deterioration metric was lower (16.7%; 95% CI: 10.3–24.8) than the CHCA metric (41.7%; 95% CI: 15.2–72.3). Although this difference may be a limitation, owing to the low number of patients with CPA and ARC,
Third, the expected 30-minute MET re-sponse time is longer than the 5- to 15-minute expected response times in other studies.5,6,10This difference in
re-sponse time may have resulted in se-lection bias, identifying a slightly different population than that served by RRSs at other hospitals. Fourth, this metric depends in part on the quality of care provided in the ICU. Variations in ICU care within or between centers may change the critical deterioration rate just as they may change the in-hospital mortality rate or other metrics, without directly reflecting differences in RRS effective-ness. Fifth, because we demonstrated the association between the critical deterioration metric and in-hospital
RRS implementation) predict changes in the in-hospital mortality rate, it does not yet fulfill formal criteria for a surrogate endpoint.22,23Future studies should seek
to establish that relationship.
CONCLUSIONS
We developed the critical deterioration metric, a rate defined as the number of patients transferred to the ICU and re-quiring life-sustaining interventions within 12 hours per 1000 non-ICU patient-days. We showed that it is a pragmatic, valid proximate outcome for in-hospital mortality with great potential for com-plementing existing patient safety met-rics to evaluate RRS performance.
REFERENCES
1. DeVita MA, Smith GB, Adam SK, et al.
“Identifying the hospitalised patient in crisis”—a consensus conference on the afferent limb of rapid response sys-tems. Resuscitation. 2010;81(4):375– 382
2. Institute for Healthcare Improvement. Over-view of the Institute for Healthcare Improve-ment Five Million Lives Campaign. Available at: www.ihi.org/IHI/Programs/Campaign/ Campaign.htm?TabId=1. Accessed December 22, 2008
3. Institute for Healthcare Improvement. About IHI. Available at: www.ihi.org/ihi/about. Accessed July 18, 2010
4. Institute for Healthcare Improvement. De-ploy rapid response teams. Available at: www.ihi.org/IHI/Programs/Campaign/Rapi-dResponseTeams.htm. Accessed July 18, 2010
5. Kotsakis A, Lobos A-T, Parshuram C, et al; Ontario Pediatric Critical Care Response Team Collaborative. Implementa-tion of a multicenter rapid response system in pediatric academic hospitals is effective.Pediatrics. 2011;128(1):72– 78
6. Brilli RJ, Gibson R, Luria JW, et al. Imple-mentation of a medical emergency team
in a large pediatric teaching hospital prevents respiratory and cardiopulmonary arrests outside the intensive care unit.
Pediatr Crit Care Med. 2007;8(3):236–246, quiz 247
7. Tibballs J, Kinney S, Duke T, Oakley E, Hennessy M. Reduction of paediatric in-patient cardiac arrest and death with a medical emergency team: preliminary results.Arch Dis Child. 2005;90(11):1148– 1152
8. Chan PS, Jain R, Nallmothu BK, Berg RA, Sasson C. Rapid response teams: a sys-tematic review and meta-analysis. Arch Intern Med. 2010;170(1):18–26
9. Hunt EA, Zimmer KP, Rinke ML, et al. Tran-sition from a traditional code team to a medical emergency team and categoriza-tion of cardiopulmonary arrests in a child-ren’s center.Arch Pediatr Adolesc Med. 2008; 162(2):117–122
10. Sharek PJ, Parast LM, Leong K, et al. Effect of a rapid response team on hospital-wide mortality and code rates outside the ICU in a Children’s Hospital. JAMA. 2007;298(19): 2267–2274
11. Zenker P, Schlesinger A, Hauck M, et al. Implementation and impact of a rapid re-sponse team in a children’s hospital. Jt
Comm J Qual Patient Saf. 2007;33(7):418– 425
12. Tibballs J, Kinney S. Reduction of hospital mortality and of preventable cardiac arrest and death on introduction of a pediatric medical emergency team.Pediatr Crit Care Med. 2009;10(3):306–312
13. Hanson CC, Randolph GD, Erickson JA, et al. A reduction in cardiac arrests and duration of clinical instability after im-plementation of a paediatric rapid re-sponse system. Postgrad Med J. 2010;86 (1015):314–318
14. Ranji SR, Auerbach AD, Hurd CJ, O’Rourke K, Shojania KG. Effects of rapid response systems on clinical outcomes: systematic review and meta-analysis. J Hosp Med. 2007;2(6):422–432
15. Child Health Corporation of America. Avail-able at: www.chca.com. Accessed August 1, 2011
16. Evans R, Elwyn G, Edwards A. Review of in-struments for peer assessment of physi-cians.BMJ. 2004;328(7450):1240
18. Benneyan JC. Number-between g-type sta-tistical quality control charts for monitor-ing adverse events.Health Care Manage Sci. 2001;4(4):305–318
19. Fieldston ES, Ragavan M, Jayaraman B, Allebach K, Pati S, Metlay JP. Scheduled admissions and high occupancy at a child-ren’s hospital.J Hosp Med. 2011;6(2):81–87
20. Fieldston ES, Hall M, Sills MR, et al. Child-ren’s hospitals do not acutely respond to high occupancy. Pediatrics. 2010;125(5): 974–981
21. Jones D, Bellomo R, DeVita MA. Effective-ness of the Medical Emergency Team: the importance of dose.Crit Care. 2009;13(5): 313
22. Fleming TR, DeMets DL. Surrogate end points in clinical trials: are we being misled?Ann Intern Med. 1996;125(7):605– 613
23. Prentice RL. Surrogate endpoints in clinical trials: definition and opera-tional criteria.Stat Med. 1989;8(4):431– 440
(Continued fromfirst page)
www.pediatrics.org/cgi/doi/10.1542/peds.2011-2784
doi:10.1542/peds.2011-2784
Accepted for publication Nov 25, 2011
Address correspondence to Christopher P. Bonafide, MD, MSCE, The Children’s Hospital of Philadelphia, 34th St and Civic Center Blvd, Suite 12NW80, Philadelphia, PA 19104. E-mail: bonafi[email protected]
PEDIATRICS (ISSN Numbers: Print, 0031-4005; Online, 1098-4275).
Copyright © 2012 by the American Academy of Pediatrics
FINANCIAL DISCLOSURE:Drs Bonafide and Keren receive funding from the Pennsylvania Health Research Formula Fund Award to perform research on the effectiveness of pediatric rapid response systems; the other authors have indicated they have nofinancial relationships relevant to this article to disclose.
FUNDING:No external funding.
DOI: 10.1542/peds.2011-2784 originally published online March 5, 2012;
2012;129;e874
Pediatrics
Tibbetts, Emily Huang, Vinay M. Nadkarni and Ron Keren
Services
Updated Information &
http://pediatrics.aappublications.org/content/129/4/e874
including high resolution figures, can be found at:
References
http://pediatrics.aappublications.org/content/129/4/e874#BIBL
This article cites 17 articles, 5 of which you can access for free at:
Subspecialty Collections
sub
http://www.aappublications.org/cgi/collection/emergency_medicine_
Emergency Medicine following collection(s):
This article, along with others on similar topics, appears in the
Permissions & Licensing
http://www.aappublications.org/site/misc/Permissions.xhtml
in its entirety can be found online at:
Information about reproducing this article in parts (figures, tables) or
Reprints
http://www.aappublications.org/site/misc/reprints.xhtml
DOI: 10.1542/peds.2011-2784 originally published online March 5, 2012;
2012;129;e874
Pediatrics
Tibbetts, Emily Huang, Vinay M. Nadkarni and Ron Keren
Christopher P. Bonafide, Kathryn E. Roberts, Margaret A. Priestley, Kathleen M.
Response Systems
Development of a Pragmatic Measure for Evaluating and Optimizing Rapid
http://pediatrics.aappublications.org/content/129/4/e874
located on the World Wide Web at:
The online version of this article, along with updated information and services, is
http://pediatrics.aappublications.org/content/suppl/2012/02/29/peds.2011-2784.DCSupplemental
Data Supplement at:
by the American Academy of Pediatrics. All rights reserved. Print ISSN: 1073-0397.