* Corresponding author Tel.: +91-9419250828 E-mail: [email protected] (M. Junaid Mir)
© 2018 Growing Science Ltd. All rights reserved. doi: 10.5267/j.ijiec.2017.4.004
International Journal of Industrial Engineering Computations 9 (2018) 63–74
Contents lists available at GrowingScience
International Journal of Industrial Engineering Computations
homepage: www.GrowingScience.com/ijiec
Modelling and analysis of tool wear and surface roughness in hard turning of AISI
D2 steel using response surface methodology
M. Junaid Mir* and M. F. Wani
Tribology Laboratory,Department of Mechanical Engineering, National Institute of Technology,Hazratbal, Srinagar, Kashmir – 190006, J&K, India
C H R O N I C L E A B S T R A C T
Article history:
Received January 15 2017 Received in Revised Format April 1 2017
Accepted April 27 2017 Available online April 28 2017
The present work deals with some machinability studies on tool wear and surface roughness, in finish hard turning of AISI D2 steel using PCBN, Mixed ceramic and coated carbide inserts. The machining experiments are conducted based on the response surface methodology (RSM). Combined effects of three cutting parameters viz., cutting speed, cutting time and tool hardness on the two performance outputs (i.e. VB and Ra), are explored employing the analysis of variance (ANOVA).The relationship(s) between input variables and the response parameters are determined using a quadratic regression model. The results show that the tool wear was influenced principally by the cutting time and in the second level by the cutting tool hardness. On the other hand, cutting time was the dominant factor affecting workpiece surface roughness followed by cutting speed. Finally, the multiple response optimizations of tool wear and surface roughness were carried out using the desirability function approach (DFA).
© 2018 Growing Science Ltd. All rights reserved Keywords:
Cutting parameters Tool wear Surface roughness RSM
ANOVA
Desirability function
Nomenclature
Vc cutting speed (m/min) RSM response surface methodology
t cutting time (min) df degrees of freedom
VB flank wear (mm) HV Vickers Hardness
TH Cutting tool hardness (HV) bj coefficients of linear terms
HRC Rockwell Hardness bii quadratic terms
Ra arithmetic mean roughness (μm) bij cross-product terms R² determination coefficient
1. Introduction
operations. To meet these challenges, hard turning has emerged as an effective single step metal cutting process to replace grinding operation and give substantial savings in both cost and productivity rates (Lin et al., 2008). Hard turning process differs from conventional turning because of the workpiece hardness i.e., work-piece hardness range of 40-62 HRC (Özel et al., 2007). Hard turning offers a number of potential advantages over traditional grinding process, including shorter setup time, greater process flexibility, lower power consumption, fewer process steps and usually there is no need of coolant. Hard turning, if applied to fabricate complex parts, could reduce manufacturing costs up to 30 times (Huang et al., 2007).
Many studies have been conducted to investigate the performance of CBN, mixed ceramic and coated carbide tool in the cutting of various hardened materials. Bensouilah et al., (2016) applied taguchi based method to determine the effect of cutting parameters on cutting force and surface roughness components in hard turning of AISI D3 cold work tool steel using coated and uncoated CC650 ceramic inserts. The analysis of variance (ANOVA), the signal-to-noise ratio and response surface methodology (RSM) techniques were adopted. It was observed that the surface quality obtained with the coated ceramic insert was 1.6 times better than the one obtained with uncoated CC650 ceramic insert. However, the uncoated ceramic insert was useful in reducing the machining force.
Asiltürk and Akkas (2011) used taguchi experimental design to obtain optimum cutting parameters in minimizing surface roughness while turning hardened AISI 4140 (51 HRC) with coated carbide tools. Experiments were conducted using the L9 orthogonal array in a CNC turning machine They also investigated the effects of cutting parameters on surface roughness by applying statistical methods of signal to noise ratio (SNR) and ANOVA. It was reported that the feed rate has the most significant effect on Ra and Rz. Davim and Figueira (2007) performed an experimental and statistical investigation of the machinability of AISI D2 tool steel. Hard turning operation was performed on AISI D2 steel having hardness 60 HRC, the tests were conducted by using cutting speed, feed rate and cutting time as main parameters and analysis was done based on the responses. The influence of cutting parameters under flank wear, surface roughness and cutting forces on machinability evaluation in turning with wiper and traditional ceramic tools using ANOVA was presented. Cutting time and cutting velocity were found to be the main parameters that affected the flank tool wear of ceramic cutting tools. However, feed rate was the most influential parameter affecting surface roughness. It was also reported that wiper ceramic tools performed better than traditional ceramic tools.
Suresh et al., (2012) investigated the influences of machining parameters on surface roughness, tool wear, machining forces and cutting forces during machining of AISI 4340 steel with coated carbide tools using taguchi technique. The analysis of the result revealed that higher values of feed rates are necessary to minimize the specific cutting force. It was observed that the machining power and cutting tool wear increases almost linearly with increase in cutting speed and feed rate. Furthermore, it was reported that the combination of high cutting speed and low feed rate is important for minimizing the surface roughness. Azizi et al., (2012) investigated the influences of cutting speed, feed rate, depth of cut and workpiece hardness on surface roughness and cutting force during machining of AISI 52100 steel with coated mixed ceramic tools. Taguchi L27 orthogonal array was used for planning the experiments. Analysis of variance (ANOVA) was used to check the validity of linear regression model and to determine the significant parameters affecting the surface roughness and cutting forces. It was reported that the significant parameters in reducing surface roughness were feed rate, workpiece hardness and cutting speed, whereas, depth of cut, workpiece hardness and feed rate were statistically significant on the cutting force components.
M. Junaid Mir and M. F. Wani
2.5 times better than the uncoated ceramic insert. Moreover, it was also reported that the feed rate and depth of cut were the most significant factors in reducing the surface roughness. Aouici et al. (2014) used a 33 full factorial design, 27 experiments were carried out to determine the effects of feed , cutting speed,
and depth of cut on surface roughness, power, and specific cutting force in hard turning of AISI D3 hardened steel using ceramic cutting tool. It was observed that the feed rate is the most influencing factor on surface roughness. Cutting force was affected mostly by feed rate followed by depth of cut. They recommended machining with lower depth of cut and higher cutting speed and recommended limiting the range of feed rate (0.12-0.13 mm/rev) to ensure better surface roughness and minimum cutting forces.
Özel et al., (2005) used a four-factor, two-level factorial design (24) with 16 replications to determine the effects of cutting tool edge geometry, feed rate workpiece hardness and cutting speed on resultant forces and surface roughness in finish hard turning of AISI H13 steel using CBN tools. It was reported that the effect of cutting edge geometry was very significant on the surface roughness. Honed edge geometry and lower workpiece surface hardness resulted in better surface roughness. Also, it was reported that workpiece hardness, cutting edge geometry and cutting speed significantly influenced the force component. Aouici et al., (2012) studied the effects of cutting speed; feed rate, depth of cut and work-piece hardness on surface roughness and force components in hard turning of AISI H11 steel using CBN tools. Mathematical models and analysis of results were performed using RSM. The results demonstrated that feed rate and workpiece hardness were the significant parameters affecting surface roughness, whereas depth of cut and work-piece hardness were principal parameters influencing cutting force components. Bouacha et al. (2010) applied response surface methodology (RSM) to investigate the effect of cutting parameters on cutting force and surface roughness components in hard turning of AISI 52100 with CBN tool. The results showed that feed rate and cutting speed parameters mainly influenced surface roughness, while depth of cut exhibited maximum influence on the cutting forces as compared to feed rate and cutting speed. Sahin (2009) compared the tool life of coated CBN, uncoated and coated ceramic inserts in hard turning of AISI 52100 bearing steel using the Taguchi method. The effects of cutting speed, tool hardness and feed rate on tool life were determined by using orthogonal array, signal to noise ratio (SNR) and ANOVA. It was reported that the effects of cutting speed followed by tool hardness and feed rate on tool life were 41.63%, 32.68% and 25.22%, respectively.
Several researchers have made attempts to optimize and understand the effect of various machining parameters using different techniques for the control of the turning process. Experiments on turning of various grades of steels were conducted using different kinds of cutting tools to identify different factors
affecting surface roughness, tool wear, cutting force and power consumption (Chinchanikar &
Choudhury, 2013; Gaitonde et al., 2009 ; Saravanan et al.,2015; Tamang & Chandrasekaran, 2015). In the pre-cited general framework, most of the machining studies have been focused on hard and hardened steels using ceramic or CBN cutting tools. However, relatively few works related to machining steels or hardened steels based on the tool wear or surface roughness prediction models have been reported by the response surface methodology. The main objective of the present study is to analyze the effects of machining operation parameters such as cutting speed, cutting time and cutting tool hardness on different aspects like tool wear and surface roughness. The novelty of the present work lies in the comparison between the performance of mixed ceramic, CBN and coated carbide inserts when machining AISI D2 cold work steel using combination of cutting speed, cutting time and tool hardness as input parameters. Particularly the effect of cutting parameters on surface roughness and tool wear of the inserts is highlighted by applying RSM methodology.
2. Experimental procedure
2.1. Workpiece and tool materials
stamping and punching operations. The composition of the as received material used in this study is listed in Table 1. The workpiece was thorough-hardened steel followed by a tempering process to attain a hardness value of 45.1 HRC (442 HV). Removable type cutting inserts with four squared working edges were used in the study. The cutting tools used are commercially available and are manufactured by Sandvik coromant. The chemical composition and physical properties of cutting inserts are summarized in Table 1.
Table 1
Workpiece material and cutting tool descriptions
Material Name/Description Composition Hardness
Work-piece AISI D2 Chem. Comp :C (1.70),Si (0.30),
Mn (0.30), Cr (12.00 ),
W(0.50),V(0.10),Mo (0.60), Fe (balance)
45.1 HRC (442 HV)
Cutting tools Mixed Alumina 70%Al2O3+30% TiC 2200 HV
PCBN CBN +TiN binder +TiN coating 2950 HV
Coated Carbide Multilayer TiC/TiCN/Al2O3 coated
by TiN over a carbide tool 1635 HV
The cutting inserts were clamped to a right-hand tool holder with ISO designation PCLNR 25 25 M 12 having −6° rake angle, −6° clearance angle, and 95°approach angle. Instantaneous roughness criteria measurements (arithmetic mean roughness, Ra), for each cutting condition, are obtained by means of a contact stylus profilometer - Hommel Etamic, Jenoptik, Germany, (Model W5) with traverse length of 3.20 mm and cut-off width of 0.8 mm with a stylus tip radius of 2µm.The flank tool wear was evaluated by Leica DM 6000 advanced microscope and having image characterized, using Leica image analysis software.
2.2. Experimental design
2.2.1. Response surface methodology
The objective of response surface methodology (RSM) is to determine a relationship between independent input process parameters with the studied responses (Gaitonde et al., 2010). This procedure includes following six steps (Aouici et al., 2012). These are, (1) definition of independent input variables and the desired output responses, (2) adoption of an experimental design plan, (3) performing regression analysis with the quadratic model of RSM, (4) calculate analysis of variance (ANOVA) for the independent input variables in order to find significant parameters that affect the responses, (5) determination of the situation of the quadratic model of Response Surface Methodology and decide whether the model of RSM needs screening variables or not and finally, (6) optimization, conduction of confirmation experiments and verifying the predicted performance characteristics. In the current study, the relationship between the input, called the cutting conditions, cutting speed (Vc), cutting time (t), tool hardness (TH) and the output Y, defined as the desired machinability (tool wear, surface roughness,) is given as
Y = Ø ( Vc, t, TH ), (1)
where Ø is the response function. The approximation of Y is proposed by using a quadratic mathematical model, which is suitable for studying the interaction effects of process parameters on machinability characteristics. In the present context, the RSM based second order mathematical model is given by:
M. Junaid Mir and M. F. Wani
where b0 is the free term of the regression equation, the coefficients, b1, b2,b3 . . . , bk are the linear terms
and b11, b22,…., bkk are quadratic terms while b12, b13, bk-1 are the interacting terms. Xi represents input
parameters (Vc, t, and TH). The output, tool wear (VB) and surface roughness (Ra) are also called response factors.
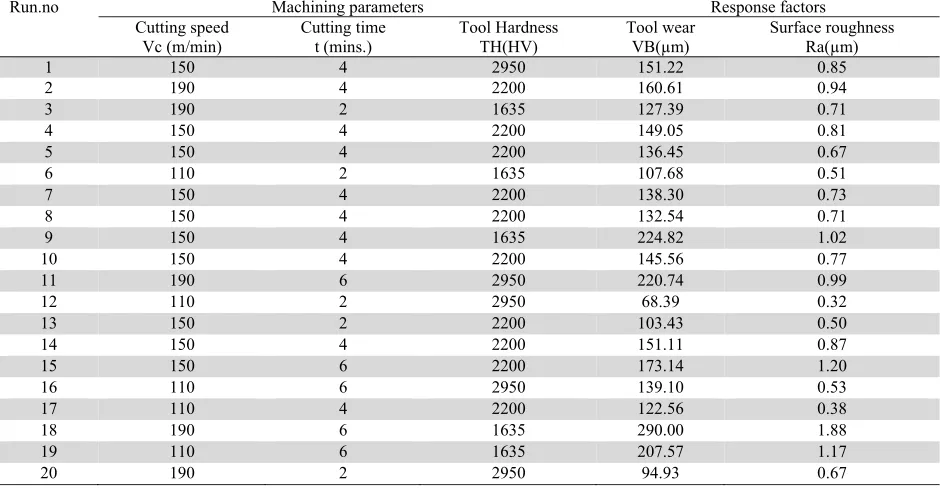
Face central composite design (FCCD) test matrix with an alpha value of 1 was used for planning of tool wear and surface roughness experiments. In the present work, 20 experiments were performed on the work material to develop tool wear and surface roughness models. The experimental plan is developed to assess the influence of cutting speed (Vc), cutting time (t) and tool hardness (TH) on the surface roughness (Ra) and tool wear (VB) parameter. The levels of the three factors on machining parameters are reported in Table 2 and the experimental design consists of 20 runs as outlined in Table 3.
Table 2
Assignment of the factor levels
S. No Parameters Units Low level High level
1 Cutting speed m/min -1 +1
2 Cutting time mins. -1 +1
3 Tool hardness (TH) HV -1 +1
Table 3
Experimental results for tool wear and surface roughness parameters
Run.no Machining parameters Response factors
Cutting speed
Vc (m/min) Cutting time t (mins.) Tool Hardness TH(HV) Tool wear VB(µm) Surface roughness Ra(µm)
1 150 4 2950 151.22 0.85
2 190 4 2200 160.61 0.94
3 190 2 1635 127.39 0.71
4 150 4 2200 149.05 0.81
5 150 4 2200 136.45 0.67
6 110 2 1635 107.68 0.51
7 150 4 2200 138.30 0.73
8 150 4 2200 132.54 0.71
9 150 4 1635 224.82 1.02
10 150 4 2200 145.56 0.77
11 190 6 2950 220.74 0.99
12 110 2 2950 68.39 0.32
13 150 2 2200 103.43 0.50
14 150 4 2200 151.11 0.87
15 150 6 2200 173.14 1.20
16 110 6 2950 139.10 0.53
17 110 4 2200 122.56 0.38
18 190 6 1635 290.00 1.88
19 110 6 1635 207.57 1.17
20 190 2 2950 94.93 0.67
3. Results and discussion
Table 3 shows all the values of the response factors, tool wear and surface roughness components. The surface roughness (Ra) was obtained in the range of (0.32–1.88) µm and tool wear was obtained in the
range (68.39–290) µm, respectively.
3.1. Statistical analysis
analysis was out for 5% significance level, i.e., for 95% confidence level. Table 4 presents the ANOVA results for tool wear. The Model F-value of 30.47 implies the model is significant. Values of "Prob > F" less than 0.0500 indicate model terms are significant. The "Lack of Fit F-value" of 5.27 implies there is a 4.60% chance that a "Lack of Fit F-value" could occur due to noise. "Adeq Precision" measures the signal to noise ratio. A ratio greater than 4 is desirable. The ratio of 22.624 indicates an adequate signal. It is, therefore, concluded that this model is significant and can be used to navigate the design space. The sum of squares, the mean square, the F value as well as the residual is shown in the ANOVA table. Cutting speed (Vc), cutting time (t), cutting tool hardness (TH); interaction effect of cutting speed and cutting time (Vc × t) and the square of cutting tool hardness (TH) 2 have significant effect on the tool
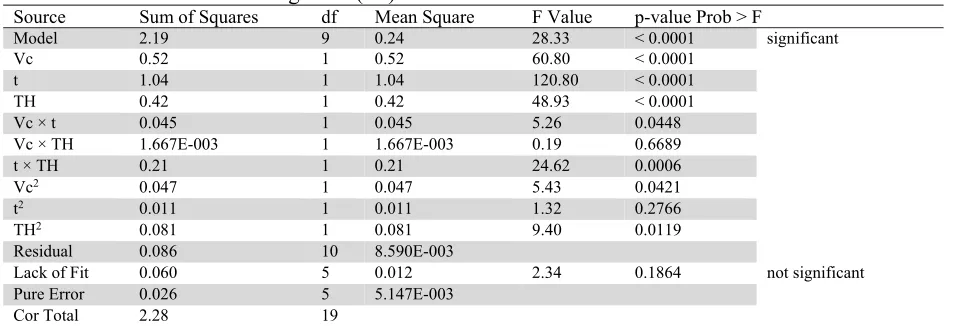
wear. But the effect of cutting time (57%) and tool hardness (23%) are the most significant factors associated with tool wear. The analysis of influence on surface roughness is summed up in Table 5. The value of “P-value” for model is less than 0.05 which indicates that the model is significant, which is desirable as it indicates that model terms have a significant effect on the output response. For “adeq precision” the signal to noise ratio is 22.028 (>4) which indicates an adequate signal and therefore the model is significant and can be used to navigate the design space. It is, therefore, concluded that this model. Cutting time (t) cutting speed (Vc) and tool hardness (TH), interaction of cutting speed and cutting time (Vc × t ), interaction of cutting time and tool hardness (t × TH), product of cutting time (t2)
and product of tool hardness (TH2) are found to be significant factors and contributed more for the
surface roughness response. The cutting time (45%) followed by the cutting speed (22.8%) and tool hardness (18.4%) had the most effect on surface roughness.
Table 4
ANOVA results for tool wear (VB)
Source Sum of Squares df Mean Square F Value p-value Prob > F
Model 47999.47 9 5333.27 30.47 < 0.0001 significant
Vc 6020.22 1 6020.22 34.39 0.0002
t 28417.23 1 28417.23 162.33 < 0.0001
TH 11485.02 1 11485.02 65.61 < 0.0001
Vc × t 1734.81 1 1734.81 9.91 0.0104
Vc × TH 7.35 1 7.35 0.042 0.8418
t × TH 461.82 1 461.82 2.64 0.1354
Vc2 288.84 1 288.84 1.65 0.2279
t2 504.94 1 504.94 2.88 0.1203
TH2 4414.24 1 4414.24 25.22 0.0005
Residual 1750.62 10 175.06
Lack of Fit 1471.47 5 294.29 5.27 0.0460 not significant
Pure Error 279.15 5 55.83
Cor Total 49750.09 19
Std. Dev. = 13.23 Mean =152.23 C.V. 8.69 % R-Squared=0.9648 Adj R-Squared = 0.933 Adeq precision=22.624
Table 5
ANOVA results for surface roughness (Ra)
Source Sum of Squares df Mean Square F Value p-value Prob > F
Model 2.19 9 0.24 28.33 < 0.0001 significant
Vc 0.52 1 0.52 60.80 < 0.0001
t 1.04 1 1.04 120.80 < 0.0001
TH 0.42 1 0.42 48.93 < 0.0001
Vc × t 0.045 1 0.045 5.26 0.0448
Vc × TH 1.667E-003 1 1.667E-003 0.19 0.6689
t × TH 0.21 1 0.21 24.62 0.0006
Vc2 0.047 1 0.047 5.43 0.0421
t2 0.011 1 0.011 1.32 0.2766
TH2 0.081 1 0.081 9.40 0.0119
Residual 0.086 10 8.590E-003
Lack of Fit 0.060 5 0.012 2.34 0.1864 not significant
Pure Error 0.026 5 5.147E-003
Cor Total 2.28 19
M. Junaid Mir and M. F. Wani
3.2. Regression equations
The relationship between the factors and the performance measures were modelled by quadratic regression. The regression equations obtained were as follows. The tool wear (VB) model is given below in Eq. (3). Its coefficient of determination (R2) is 96.48%
Final equation in terms of actual factors:
Tool Wear (VB) =411.391 + 1.72352 × Vc + 39.0394 ×t -0.460125 ×TH + 0.184073 × Vc × t + 3.63656e-005 × Vc × TH -0.00576643 × t ×TH - 0.00640531 × Vc2 - 3.38763 × t2 +
9.48049e-005 × TH2 (3)
The surface roughness model Ra is given in Eq. (4). Its coefficient of determination (R2) is 96.23%
Final equation in terms of actual factors:
Surface roughness = - 0.245263 + 0.0276161 × Vc + 0.164338 × t - 0.0015745 × TH +
0.000939063 × Vc × t - 5.47811e-007 × Vc ×TH -0.00012341 × t × TH -8.13636e-005 × t2
+ 0.0160795 × t2 + 4.05398e-007 × TH2 (4)
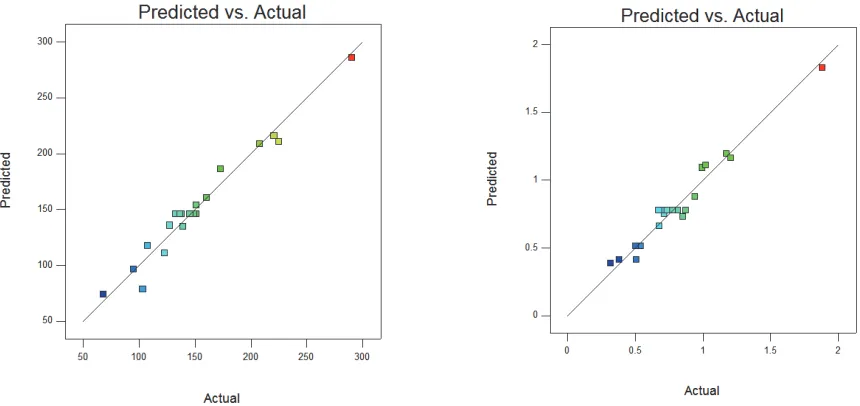
The predicted values of response factors illustrating tool wear (VB) and surface roughness (Ra), are obtained from regression Eqs. (3-4) and the experimental values corresponding to different combinations of machining parameters are reported in Table 4. The predicted values are compared with the corresponding experimental values. This is depicted in Fig. 1 and Fig. 2.
Fig. 1. Comparison between measured and
predicted values for tool wear
Fig. 2. Comparison between measured and
predicted values for surface roughness
3.3 Effect of machining parameters on surface response parameters
3.3.1 Tool Wear
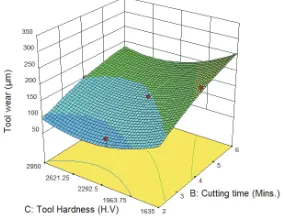
significant on tool wear. Interaction plots, in Figs (3-5), illustrate the evolution of the tool wear (flank wear) according to the cutting speed (Vc), cutting time (t) and tool hardness (TH) parameters. Fig. 3 shows the estimated response surface for the tool wear in relation to the cutting time and cutting speed. According to the figure, the increasing effects of cutting speed and cutting time increases tool wear. It was also observed from the figure that cutting time exhibits the maximum influence on tool wear, as was also reported by (Berkani et al., 2015). This is due the fact that with the increase in cutting speed (110-190 m/min), the rubbing action between the cutting tool and the workpiece material is faster and more heat is produced even though less contact time exists. This increased temperature at contact zone with increased speed is significantly high, which even causes the cutting material to exceed its limit of thermal stability. This generation of heat, at the flank face of the tool, softens the cutting edge and more wear occurs (Suresh et al., 2012). The maximum value of tool flank wear was found with high levels of cutting time and cutting speed.
From the interaction plots Fig. 4 and Fig. 5, it can be observed that, the tool wear has a tendency to reduce with increase in tool hardness up to a certain point with all cutting speeds used. Conversely, the figures also indicate that the increase of tool hardness from 2200 HV to 2950 HV leads to the increase of tool wear with increasing time and cutting speed. From the above discussion and the study of Figs. (4-5), it
is obvious that the characteristic wear of tool is caused by the fact that, the speed and time are the influential factor on wear and it is more likely that wear is the consequence of the speed and time of cut. From the above discussions, it is clear that a combination of middle values of tool hardness, low cutting speed, and minimum cutting time is favorable in reducing tool wear.
Fig. 3. Effect of cutting speed
and cutting time on tool wear and tool hardness on tool wear Fig. 4. Effect of cutting speed and tool hardness on tool wear Fig. 5. Effect of cutting time
3.3.2 Surface Roughness
The estimated response surface for the surface roughness in relation to the cutting parameters cutting speed, cutting time and tool hardness is presented in Figs 5-8. From Fig 5, it can be observed that the cutting time (t) and cutting speed (Vc) had a significant influence on machined surface roughness (Ra).
M. Junaid Mir and M. F. Wani
Fig. 6. Effect of cutting speed and cutting time on surface roughness
Fig.7. Effect of cutting speed and tool hardness on surface roughness
Fig. 8. Effect of cutting time and tool hardness on surface roughness
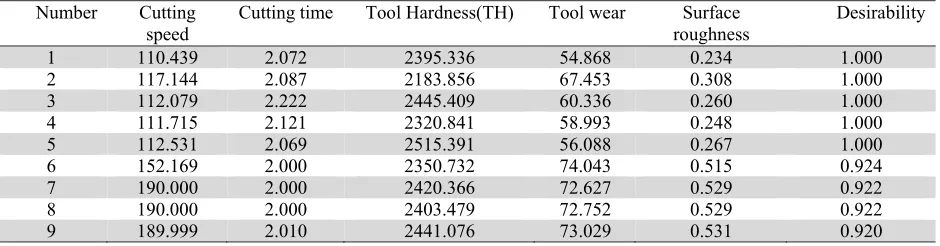
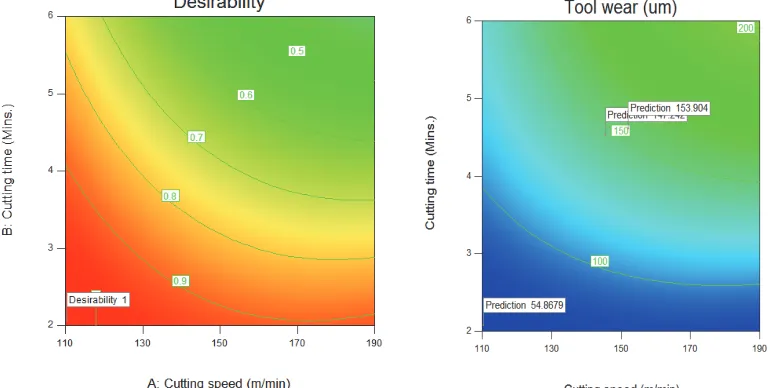
3.4 Optimization of cutting conditions
Desirability function is not a direct optimization method (Berkani et al., 2015). It has been used to optimize multiple response factors (VB and Ra). Desirability function is a decision support tool used to identify process parameters that results in near-optimal settings for process responses. During the optimization process, the aim is to find the optimum values of machining parameters in order to produce the lowest tool wear and minimize surface roughness (VB and Ra). Table 6 summarizes the goals and parameter ranges for the optimization process. The RSM optimization results for VB and Ra are defined
in Table 7 in order of their decreasing desirability levels. The optimized tool wear (VB) and surface roughness (Ra) results are (54.868-74.043) µm and (0.234-0.531) µm, respectively.
Fig. 9 shows two dimensional contour plots that explain the optimization results in terms of composite desirability. The figure clearly explains that the increasing cutting speed and cutting time decreases the composite desirability level.
Table 6
Goals and parameter ranges for optimization of cutting conditions
Name Goal Lower
Limit Upper Limit Lower Weight Upper Weight Importance
Cutting speed is in range 110 190 1 1 3
Cutting time is in range 2 6 1 1 3
Tool Hardness(TH) is in range 1200 2950 1 1 3
Tool wear minimize 68.39 290 1 1 5
Surface roughness minimize 0.32 1.88 1 1 5
Table 7
Response optimizations for tool wear and surface roughness parameters
Number Cutting
speed Cutting time Tool Hardness(TH) Tool wear roughness Surface Desirability
1 110.439 2.072 2395.336 54.868 0.234 1.000
2 117.144 2.087 2183.856 67.453 0.308 1.000
3 112.079 2.222 2445.409 60.336 0.260 1.000
4 111.715 2.121 2320.841 58.993 0.248 1.000
5 112.531 2.069 2515.391 56.088 0.267 1.000
6 152.169 2.000 2350.732 74.043 0.515 0.924
7 190.000 2.000 2420.366 72.627 0.529 0.922
8 190.000 2.000 2403.479 72.752 0.529 0.922
9 189.999 2.010 2441.076 73.029 0.531 0.920
Fig. 9. Composite desirability for tool wear and surface roughness
4. Conclusions
This paper presented an investigation of cutting parameters effect on tool wear and surface roughness in machining of AISI D2 steel. Mathematical models were developed to define a relationship between input parameters (cutting speed, cutting time and tool hardness) and output variables using Response surface methodology (RSM). Analysis of variance (ANOVA) was used to check the adequacy of the model and its respective variables. Combined effects of machining parameters on tool wear and surface roughness were evaluated through 3D surface graphs. Finally, the multiple response optimizations of tool wear (VB) and surface roughness (Ra) were carried out using the desirability function approach (DFA). Following conclusions can be drawn from this study:
1. The analysis of machining parameters, using RSM approach, allows the investigation of the influence of each factor on the response outputs, such as tool wear and surface roughness.
M. Junaid Mir and M. F. Wani
3. ANOVA table for surface roughness has shown that the main effects of cutting time, cutting speed, tool hardness, the product of cutting speed, the product of tool hardness, the interaction effect of cutting speed and cutting time (Vc × t) and the interaction of cutting time and tool hardness (t × TH) had significant effects on surface roughness. Moreover, the cutting time (45%), the cutting speed (22.8%) had the most effect on surface roughness.
4. Based on multi-response optimization process, the optimum cutting variables for minimum tool wear with maximum surface finish were cutting speed of 110.439 m/min, cutting time of 2.072 mins and tool hardness of 2395.336 respectively.
Acknowledgement
The authors acknowledge the help and support of the centre research facility Centre (CRFC), NIT Srinagar for the characterization of samples.
References
Aouici, H., Bouchelaghem, H., Yallese, M. A., Elbah, M., & Fnides, B. (2014). Machinability investigation in hard turning of AISI D3 cold work steel with ceramic tool using response surface methodology. The International Journal of Advanced Manufacturing Technology, 73(9-12), 1775-1788.
Aouici, H., Yallese, M. A., Chaoui, K., Mabrouki, T., & Rigal, J. F. (2012). Analysis of surface roughness and cutting force components in hard turning with CBN tool: Prediction model and cutting conditions optimization. Measurement, 45(3), 344-353.
Asiltürk, I., & Akkuş, H. (2011). Determining the effect of cutting parameters on surface roughness in hard turning using the Taguchi method. Measurement, 44(9), 1697-1704.
Azizi, M. W., Belhadi, S., Yallese, M. A., Mabrouki, T., & Rigal, J. F. (2012). Surface roughness and cutting forces modeling for optimization of machining condition in finish hard turning of AISI 52100 steel. Journal of mechanical science and technology, 26(12), 4105-4114.
Bensouilah, H., Aouici, H., Meddour, I., Yallese, M. A., Mabrouki, T., & Girardin, F. (2016). Performance of coated and uncoated mixed ceramic tools in hard turning process. Measurement, 82, 1-18.
Berkani, S., Bouzid, L., Bensouilah, H., Yallese, M. A., Girardin, F., & Mabrouki, T. (2015). Modeling and optimization of tool wear and surface roughness in turning of austenitic stainless steel using response surface methodology. S09d Procédés d'usinage.
Bouacha, K., Yallese, M. A., Mabrouki, T., & Rigal, J. F. (2010). Statistical analysis of surface roughness and cutting forces using response surface methodology in hard turning of AISI 52100 bearing steel with CBN tool. International Journal of Refractory Metals and Hard Materials, 28(3), 349-361. Chinchanikar, S., & Choudhury, S. K. (2013). Effect of work material hardness and cutting parameters
on performance of coated carbide tool when turning hardened steel: An optimization approach. Measurement, 46(4), 1572-1584.
Davim, J. P., & Figueira, L. (2007). Comparative evaluation of conventional and wiper ceramic tools on cutting forces, surface roughness, and tool wear in hard turning AISI D2 steel. Proceedings of the Institution of Mechanical Engineers, Part B: Journal of Engineering Manufacture, 221(4), 625-633. Elbah, M., Yallese, M. A., Aouici, H., Mabrouki, T., & Rigal, J. F. (2013). Comparative assessment of
wiper and conventional ceramic tools on surface roughness in hard turning AISI 4140 steel. Measurement, 46(9), 3041-3056.
Gaitonde, V. N., Karnik, S. R., Faustino, M., & Davim, J. P. (2010). Machinability analysis in turning tungsten–copper composite for application in EDM electrodes. International Journal of Refractory metals and hard materials, 28(2), 221-227.
Huang, Y., Chou, Y. K., & Liang, S. Y. (2007). CBN tool wear in hard turning: a survey on research progresses. The International Journal of Advanced Manufacturing Technology, 35(5-6), 443-453. Lin, H. M., Liao, Y. S., & Wei, C. C. (2008). Wear behavior in turning high hardness alloy steel by CBN
tool. Wear, 264(7), 679-684.
Özel, T., Hsu, T. K., & Zeren, E. (2005). Effects of cutting edge geometry, workpiece hardness, feed rate and cutting speed on surface roughness and forces in finish turning of hardened AISI H13 steel. The International Journal of Advanced Manufacturing Technology, 25(3-4), 262-269.
Özel, T., Karpat, Y., Figueira, L., & Davim, J. P. (2007). Modelling of surface finish and tool flank wear in turning of AISI D2 steel with ceramic wiper inserts. Journal of materials processing technology, 189(1), 192-198.
Sahin, Y. (2009). Comparison of tool life between ceramic and cubic boron nitride (CBN) cutting tools when machining hardened steels. Journal of materials processing technology, 209(7), 3478-3489. Saravanan, I., Perumal, A. E., Vettivel, S. C., Selvakumar, N., & Baradeswaran, A. (2015). Optimizing
wear behavior of TiN coated SS 316L against Ti alloy using Response Surface Methodology. Materials & Design, 67, 469-482.
Suresh, R., Basavarajappa, S., & Samuel, G. L. (2012). Some studies on hard turning of AISI 4340 steel using multilayer coated carbide tool. Measurement, 45(7), 1872-1884.
Tamang, S. K., & Chandrasekaran, M. (2015). Modeling and optimization of parameters for minimizing surface roughness and tool wear in turning Al/SiCp MMC, using conventional and soft computing techniques. Advances in Production Engineering & Management, 10(2), 59.