ISSN: 2231-5381
http://www.ijettjournal.org
Page 380
Indian Iris Recognition System using Ant Colony
Optimization
Anupam Tiwari
#1, Vinay Jain
*2#1 M.E. Student, *2 Associate Professor, Department of ET&T Engineering, Shri Shankaracharya College of Engineering and
Technology, Bhilai, India
Abstract— Iris recognition has become popular now a day’s due to its uniqueness and stability. Among all the others biometrics as face, thumb, voice recognitions, iris recognition getting more popular in research areas in biometrics recognition. In other biometrics other than iris, it will be seen that there is some sort of biological alteration in face, voice, and thumb over human life of span from birth to older age. In this paper we are using modified way of Libor masek method. In modified Libor masek method mainly three phases preprocessing, feature extraction is based on Ant Colony Optimization(ACO), template matching plus calculation of centre coordinates, inner and outer radius of iris in eye image. Here we are using IIT Delhi database for our iris recognition system.
Keywords—Iris recognition, ant colony optimization, Segmentation
I.INTRODUCTION
A
utomatic recognition of an individual based on his uniquefeatures influenced by the individuals and biometric system is one which done this work on finger print, facial features , voice and iris [1] is one of among all the biometrics ,which are possess unique features & characteristics of individual physiology.
The questions is arises that how biometric system works. In any biometric system first we capture samples of features of an individual through a camera we take image of face in face recognition and similarly record a digitized vocal sound for voice recognition. Then samples are preprocessed and some form of mathematical operations has to be done on samples to transform it in to a template. The templates are normalized preprocessed form of samples. The biometric templates possess high single out and distinct features, which are discriminate it to other template and compare with other template to decide identity for a individual.
Eye is a complex human organ, which is lying between the cornea and the lens of the human eye. The iris is penetrated close to its iris centre by a circular type of aperture is known as pupil. The function of iris is important in a way to control the amount of light coming in the pupil. The externally visible surface of iris is multi-layered comprises two zones, which frequently differ in colour. The inner ciliary zone and outer ciliary zone, and these two zones are divided by collarette which seem as zigzag form [3] .The average diameter of iris is 12 mm, and pupil size is changing according 10% to 80% of the iris diameter [2].The iris is starts forming from the third
month of birth. The stability and unique feature of iris patterns formed during the first year of human life and remain unique and stable up to death of human eye. The important thing is that in iris pattern there is no influence of human genetic. Only colour of iris pattern affected by genetic [3], due to epigenetic behaviour of iris the left and right irises are different in patterns. So there is no chance of twins having similar iris pattern.
Iris is outwardly seen, due to epigenetic nature whose pattern will be in same state throughout adult life. These unique feature make it suitable for use in analysis of biological data as biometric for distinguish individuals. Image preprocessing techniques is apply to evoke the unique iris pattern from a digital eye image, and further using to encode it into a biometric template. This can be stored in database for further use. The unique information stored in the iris is determined by some form of mathematical transformation gives biometric template, and these are used for make a equivalence or comparison between template. When any one wants to identify himself through iris recognition system, the eye image is first captured by using a camera and some transformation is apply to make a template for iris region in a eye image. Currently made template put on iris recognition system to compare with the other template stored in a database, until the final result has come as subject is identified or subject is unidentified.
In early nineties the Cambridge researcher, John Daugman discovered and implemented a commercial fully functional, working automatic iris recognition system [1] [2]. The Iridian Technologies own the rights after Daugman system has patented [5]. The Daugman iris recognition system has famous and get more publicity due to its successful working, after that in area of iris recognition system many other systems have been developed by other researchers and also different techniques have been developed in iris recognition. The system developed by Wildes et al.[4][7], Boles and Boashash [8], Lim et al.[9], and Noh et al[10]. Algorithms by Lim et al. are employed in iris recognition system developed by Evermedia and Sensex companies. Also, the Noh et al. are employing in the ‘IRIS 200’ system, sold by IriTech. These are the only known commercial implements, apart from Daugman iris recognition system.
ISSN: 2231-5381
http://www.ijettjournal.org
Page 381
images [7],and Lim et al. system achieve a recognition rate 98.4% on database of around 6000 eye images.
In section II we explained the literature review of iris recognition system. In section III we explained the related work proposed method in segmentation and feature extraction. In section IV we explain the process of template matching. In section V we discuss the results regarding ant colony optimization.VI we discuss the conclusion of work.
II.LITERATURE REVIEW OF IRIS RECOGNITION SYSTEM
Iris recognition system comprises of mainly three stages. These stages are preprocessing, feature extraction, and final is template matching. Image are first captured by using camera and applying this captured images to sub sequential stages of iris recognition showing in fig.1
Fig. 1 sequential flow of iris recognition
A. PREPROCESSING
Eye image is pre-processed to incur desired iris image area. Iris preprocessing comprises of segmentation-localization of iris region in an eye image, iris normalization and image enhancement. Iris region in eye image roughly approximated by circles, here we are using two circles; one is for outer circle iris-sclera boundary and inner circle iris–pupil boundary. The eyelid and eye lashes normally obstruct the upper and lower portion of the iris image region, also mirror like nature iris region causes reflection, which partially corrupt the iris pattern, and it is desired to get a iris region which are free from these obstacles. Many techniques have been developed to keep apart these obstacles. The successful performance is reckons i.e. based on the resolution that we are selecting to capture eye image. Image found in IIT Delhi [13] database not have any secular reflections because at the capturing time iris image is illuminated by using near infrared light, which are desired for successful performance for any iris recognition
system. So preprocessing is necessary stage in iris recognition system.
1) SEGMENTATION: The Hough transform is a standard algorithm that can be used to find out the parameters of simple geometric objects, such as lines, circles, and arcs in an image. The circular Hough transform can be applied to derive the radius and centre coordinates of the pupil and iris regions in eye image. A reflexive segmentation algorithm program grounded on the circular Hough transform is employed by Wildes et al. [7], Kong and Zhang [15], Tisse et al. [12], and Maet al. [16]. Firstly, an edge map is generated by computing the first derivatives of intensity values in an eye image and then threshold value is changed the result. From the edge map, voting are applied in Hough space for the parameters of circles passed through each edge point in eye image. These
parameters are the centre coordinates and , and the radius r,
which are define any circle according to the eq. (1).
(1)
Eyelash and eyelid are detected using parabolic Hough transform, due to threshold is required it has problem having most of edge points are not detected and affect the performance of iris recognition system.
Daughman’s Differential Operator Integro-differential used as a extension of Hough transform, because it also uses first derivative of eye image and look for finding geometric parameters except threshold phenomenon required in Hough transform, because it require only raw information of derivative. This algorithms is fails where image having noise as reflections, eq. (2) define the operator.
(2)
Where I(x, y) is the eye image , r is radius look for , Gaussian smoothing function, and s is contour of circle define
by , the operator trace a circular path where it gets
maximum change in pixel values in eye image.
Active contour models also employ for localize the pupil in a eye image. Ritter et. al[14] using of active contour models for locating the pupil region in eye images. Contour model comprises of vertices, position of vertices changes by apply two opposite forces, external force depends upon image, where internal force depends on wanted characteristics, each vertex change its position during time t and t+1 by in eq. (3).
Here is the internal force, is the external force and is
the positions of vertex i.Here we are employ circular Hough transform to localize the pupil and iris region in eye image, as well as linear Hough transform keep apart eyelid. First we are applying canny edge detection to change eye image in to edge map. As evoke by Wildes et al. gradients are predetermine in vertical direction for outer boundary of iris–sclera [4]. Gradients in vertical and horizontal direction were weighted equally for inner boundary of iris –pupil. Eyelids are keep
Eye image
Preprocessing
Feature Extraction
Template Matching
Iris recognition
ISSN: 2231-5381
http://www.ijettjournal.org
Page 382
apart by using linear Hough transform, which first accommodating a line to upper and lower eyelid. Then another second horizontal line crosses first line at the iris edge which is closest to the pupil.
Noise and Eyelash detection in eye image suggested by Kong and Zhang [15] has introduce a method towards eyelash detection, where eyelashes are belonging to separable eyelashes, which are insulated in the eye image, and multiple eyelashes, which are bundled together and over lapin the eye image. Separable eyelashes are observed using 1D Gabor filters, because the convolution of a separable eyelash with the Gaussian smoothing function outcomes in a low output value. Hence, if a resultant point is lower than a threshold, it is observed that this pointed to an eyelash. Multiple eyelashes are detected using the variance of intensity volume in the eye image. If we are get the variance of intensity values in a small window is smaller than a threshold, the centre field of the window is regarded as a point in an eyelash in eye image. The Kong and Zhang [20] model using of conjunctive standards, so that each point in an eyelash had better connect to some other point in an eyelash or to an eyelid. Secular reflections on the eye image are observed using threshold values.
2) NORMALIZATION: When the iris image region is perfectly segmented from an eye image, the following step is to transform the iris region, so that it has fixed proportion in
order to provide comparisons. The proportional
inconsistencies among eye images are primarily because the diluting of the iris induced by pupil dilation of changing levels of illumination. Other cause of inconsistency let in, changing seeing length, revolution of the camera, head tilt, and rotation of the eye on the eye cavity. The normalization action will develop iris regions in the eye image, which have the same constant proportions, so that two pictures of the same iris underneath unlike conditions will have features at the same spatial position. Some other point of mention is that the pupil region is not always concentric inside the iris region.
Daugman’s Rubber Sheet Model as suggested by Daugman[1] prepared by homogenous rubber sheet modal in which it remaps each point are in iris image region to a another polar coordinates (r, ) where r is varying to interval
[0,1] and is varying to interval [0,2 ]. The Cartesian
coordinates (x, y) are remaps in normalized eccentric polar coordinates (r, ).where I (x. y) iris image region eq. (4).
(4)
The rubber sheet model carried out into account pupil dilation and size inconsistencies to give raise a normalized delegacy with constant proportions. In this manner there is region is prototyped as a flexible rubber sheet grounded at the iris boundary with reference point as pupil centre. Yet although the homogenous rubber sheet prototype describe for pupil dilation, imaging length and eccentric pupil translation, it doesn’t correct for rotational inconsistencies. In the Daugman system, rotation is reported for throughout matching until two iris templates are aligned by changing the iris templates in the θ direction.
Virtual Circles as iris image is scaled out to get
constant diameter in Boles [8] iris recognition system to compare two images, first one is taken as reference image. Here first task is to seeking to match two iris image regions then employ normalization. Before this technique we do normalization first then matching template. Once two iris images are correlated successfully in same dimensions, by storing the intensity values, with virtual concentric circle,with origin are find at centre of the pupil region. Then we decide the resolution which we are selected in normalization. There has a similarity as Daughman’ rubber sheet model, except scaling is performed at match time.
Image Registration as suggested by Wildes et al. iris recognition system apply an image registration technique, which linearly enclose a newly gained image, into alliance with a chose database image [4]. When selecting a mapping function to translate the original coordinates, the new image intensity values are made to be near to those of representing points in the reference image.
Normalization of iris image regions technique established on Daugman’s rubber sheet model. The centre of the pupil was looked at as the reference point, and radial vectors extend by the iris image region, numbers of data points are picked out on each radial line and this is determined as the radial solution. The number of radial lines departing around the iris region is defined as the angular resolution. Because the pupil is to be eccentric to the iris, a remapping pattern is required to resize points calculating on the angle around the circle. A constant number of points are selected on each radial line, such that a constant number of radial data points are carried, regardless of how narrow or wide the radius is at a peculiar angle. The normalized pattern was produced by backtracking to find the Cartesian coordinates of data points from the radial and angular position in the normalized pattern. From the ‘doughnut’ iris region, normalization produces a 2D array with horizontal dimensions of angular resolution and vertical dimensions of radial resolution. Another 2D array was created for marking reflections, eyelashes, and eyelids detected in the segmentation stage.
B. FEATURE EXTRACTION
Feature extraction is to extract the information of an iris normalized image as colour and texture, as compared with colour of the iris image, Texture possess most discriminating features in iris image. We are discussing here some methods used in feature extraction of eye image.
ISSN: 2231-5381
http://www.ijettjournal.org
Page 383
Gabor filters are capable to furnish optimal conjoined representation of a signal in space and spatial frequencies. A Gabor filter is made by toning a sine or cosine wave with a Gaussian function; hence a sine wave is absolutely placed in frequency, but not placed in space. Intonation of the sine with a Gaussian function allows for place in space, while with of placing in frequency. Breaks down of a signal is done employing a pair of Gabor filters, with a real part defined by a cosine modulated by a Gaussian function, and an imaginary part defined by a sine modulated by a Gaussian function. The combinations of real and imaginary filters are also known as the even symmetric and odd symmetric components respectively. The centre frequency of the filter is denoted by the frequency of the sine or cosine wave, and the band width of the filter is denoted by the width of the Gaussian. Daugman[1] demodulates the output results of the Gabor filters to compact the data. This is caused by quantizing the phase selective information into four levels, for each possible quadrant in the complex plane possible quadrant of four. It has been further demonstrated by Oppenheim and Lim [23] that using phase information, instead of amplitude information allows the most substantial selective information inside an image. Taking only the phase information only will provides encoding of separating information in the iris image, hence putting out surplus information such as illumination, is represented by the amplitude portion
These four levels are represented by two bits of data information, so each pixel value in the normalized iris pattern represents two bits of data in the iris template. A total number of 2,048 bits are computed towards the template, and also an adequate number of masking bits are generated in order that mask out corrupted or damaged iris image regions inside the iris. This creates a compress 256-byte template, which appropriate for effective storage and comparison of irises templates
Limitation of the Gabor filter is that the even symmetric filter will have comprises of a DC portion if the bandwidth is greater than one octave [16]. Still, zero less DC component can be found for any bandwidth by employing a Gabor filter which is Gaussian on a logarithmic scale also, this is called as the Log-Gabor filter. The frequency response of a Log-Gabor filter is given as in eq. (5).
(5)
Where represents the centre frequency, and σ gives the
bandwidth of the filter. Details ofthe Log-Gabor filter are examined by Field
Zero-crossing of the 1D wavelet Boles and Boashash [8]. The mother wavelet is defined as the second derivative of a smoothing function θ(x) as define by eq. (6)
(6)
The zero crossings of dyadic scales of these filters are then used to encode features. The wavelet transform of a signal f(x)at scale sand position x is given by eq. (7).
(7)
Is proportional to the second derivative of f(x)
smoothed by , and the zero crossings of the transform
correspond to points of inflection in . The motivation
for this technique is that zero-crossings correspond to significant features with the iris region.
Haar Wavelet as suggested by Lim et al. [9] employed the wavelet transform to extract features from the iris region from normalized iris image. Both the Gabor transform and the Haar wavelet are considered as the mother wavelet as considering wavelet transformation. From multi-dimensionally filtering, a feature vector with 87dimensions is calculated. While each dimension has a real value rang varying from-1.0 to +1.0, the feature vector is sign quantized such that any positive value is denoted by 1, and negative value denotes as 0. This results in a compact, compress biometric template consisting of only 87 bits. Lim et al. compare the use of Gabor transform and Haar wavelet transform, and show that the recognition rate of Haar wavelet transform is slightly better than Gabor transform by 0.9%.
Laplacian of Gaussian Filters In order to encode features, the Wildes et al. system decomposes the iris region by application of Laplacian of Gaussian filters to the iris region image. The filters are given as in eq. (8).
(8)
Where σ is the standard deviation of the Gaussian and ρ is the radial distance of a point from the centre of the filter. The filtered image is denoted as a Laplacian pyramid which is capable to compress i.e. compact the data, such that only important significant data persist. Particulars of Laplacian Pyramids are delivered by Burt and Adelson [17]. A Laplacian pyramid is constructed with four different resolution levels in order to generate.
III.RELATED WORK AND PROPOSED METHOD IN SEGMENTATION AND FEATURE EXTRACTION
For Feature extraction their different algorithms are available based on extracted feature as colour, shape, texture. Texture is most important feature in iris image recognition. Perfect recognition of individuals has to be done through extracting the most acute feature as information present in a iris image region. Texture is based visualise by grey image.
ISSN: 2231-5381
http://www.ijettjournal.org
Page 384
However, an ant colony is highly, coordinated refined and effective. Ants convey by bringing out a kind of chemical content called a pheromone, and the observed intensity of the pheromone will impress ants’ conclusion of preferring which direction to go. In such a way, ants are capable to detect the littlest path from nestle to a food origin. Even if the specifies change, an ant colony can also adapt their scheme to acquire a new littlest path. This content determines the selection they build: the bigger the quantity of pheromone on a path, the higher the chance that an ant will choose the path. The quantity of pheromone banked will lead other ants going to the path with firmest density of pheromone. This cooperative nature of ant colony enjoys a positive feedback of data. Accommodative interaction of ants conducts to emersion of the shortest path. The aspiration of ACO got from such reflections of real ants to resolve discrete optimization problems. The research of ACO on digital images was suggested by Ramos and Almeida [19], and exposed that unreal ant colonies can respond and adjust to any type of digital home ground. To section an image, feature differentiation between unlike parts in the image must be established. There are many features of an image, such as
object, background, edge, colours, etc. proposed an algorithm
for swarm-based colour segmentation, where two specified type of factors acquire over RGB images, and results to colour
segmentation problems issue from the swarm
behaviour. [20]Presents a study on the edge-detection of different grey-level images with artificial swarm intelligence, and resolves that artificial swarms can do feature extraction in digital images. [21] Presents an evolutionary swarm algorithm for image segmentation where dissimilar populations of individuals compete with each other to invade a bi-dimensional landscape being the image to be treated.
Assuming there is a large number of artificial ants casting in their territory dominion. The territory is regarded as a totoroidal, bidimensional lattice like, which is represented by an M N cells territory array. At the beginning, each ant is randomly located on a cell (x, y) in the territory array. When an ant goes, it prefers cell in the 8cellneighbor of the location looking at two components: pheromone intensity and movement momentum. Concerning the movement momentum,
a direction probability vector
is set, where denotes the weight
for candidate cell. The final transition probability for
candidate cell is thus given by eq. (9), where is the
current pheromone intensity at the cell.
(9)
Here, α is a coefficient that balances the importance of the accumulated pheromone to the movement momentum factor. The value of α may be defined either experimentally or
heuristically. To ACO, ants choose their next stay point c
depending on the maximum transition probability . Clearly, different definitions of the movement momentum and the evolution of pheromone should fit the demands of various application problems.
Evaluation of Pheromone Let θ(x, y) stands for the pheromone intensity at the cell (x, y). At the starting, each θ(x, y) is put to zero for the all territory array, 1≤x≤M, 1≤y≤N. Each time an ant inflicts a cell, it discharges a constant amount η of pheromone, addition with a dynamic amount ε. Δ ((x, y), (x0, y0)), which is monotonic to the trouble of this movement. Here, ε is a constant, Δ ((x, y), (x0, y0)) expresses the trouble of movement from the previous cell (x0, y0) to cell in eq. (10).
(10)
In addition, during every iteration all cell’s pheromone is reduced exponentially by a constant K, 0<K<1. Thus, the evolution of pheromone is given by eq. (11).
(11)
A. IMAGE SEGMENTATION BASED ON ACO
Under the suggested model, here we present two algorithms that intention at iris image segmentation and feature texture extraction separately. The fundamentals pertaining to the
design of the direction probability vector and the
movement difficulty Δ ((x, y), ( , ))
Image segmentation aims at decompose an image into various homogeneous disjoint regions. We thus design a method to stress the sameness of pixel grey level and local texture resemblance. Moving under such supervision of another ant’s, ants run to range inside homogeneous regions. And as a result, the pheromone intensity inside each region come along to be monotone, and allows for a relatively lower pheromone intensity path between disjoint regions.
1) DIRECTION PROBABILITY VECTOR DEFINITION:
Direction probability vectors employ to be check in advance and stay unique during the all ant movement action. Traditionally, an ant runs to keep its movement direction, and weights for all directions are put according to the deformation among the campaigner direction and the original direction. i.e., if an ant arrives from south, and the eight cells have no pheromone, the probability of departing north is higher, adopted by the probability of departing northeast or northwest, and so on, until the likeliness of returning south, which is very low. In our work, we apply this mechanism as predetermine, but we also apply other 2 standards to imply the landscape information. Thus our direction probability vector contains 3 parts as defined in eq. (12).
(12)
To do things easy, we numerate the 8 neighbour cells as the 1st cell is the one where arrive the ant, the others are
considered clockwise. The 1st item for each is
assigned by the vector. Clearly, this part
is the basic movement momentum.The 2nd items is
arrange according to the resemblance of grey level among
ISSN: 2231-5381
http://www.ijettjournal.org
Page 385
an experimentally selected parameter to adjust these factors.
Clearly, this part reflects the resemblance among
neighbouring pixels. The more similar the grey levels of the pixels, the more possible it is that the pixels belong to the
same class. The 3rd items is denoted by the local texture
resemblance among the sub-image W(i) which is covered
from the cell, and the centre sub-image W(0):
. γ is also an experimentally selected posing
parameter. Here, the centre cell with the 8 neighbours naturally form a 3×3 pixels sub-image W (0). Around W(0),
there exit also 8 neighbours of 3×3 pixels
sub-image: W(1),W(2),…,W(8), which can be as numerated in same path as that for neighbouring cells. The space between 2 sub-images d (W (), W (0)) may have many classes; however we employ the histogram length. The more similar the distributions are, the higher the chance that the sub-images are belonging to the same class.
2) MOVEMENT DIFFICULTY DEFINITION: Usually, the
grey level of an object is very unlike from that of background object. In also, edge points are generally points where grey values abruptly change. The gradient, which furnishes measure of this change, is another important feature to determine edge point from the background or object region. Trying to decrease the pheromone intensity at edge cells, we let the movement trouble to be the grey level gradient, and
thus simply define , where A is just a constant.
3) PROCEDURE FOR ALGORITHM: The procedure to
implement the aimed algorithm above, the Ant Colony Optimization Image Segmentation Algorithm.
Step-1: Initialize parameters such as α, β, γ, K and A, etc. Initialize pheromone distribution θ(x, y).
Step-2: For all ants, arrange: locate each ant agent arbitrarily on the territory array;
Step-3: For t=1 to , arrange: Step-4 to Step-12;
here controls the maximum iterations.
Step-4: For all ants, arrange: Step-5 to Step-10;
Step-5: calculate global direction probabilities Pi, according to eq. (9) and (12).
Step-6: Select the adjacent cell with the greatest Pi.
Step-7: If the selected cell is filled by another ant, do: continue for the next ant.
Step-8: Move the ant.
Step-9: Increase the pheromone at the cell according to eq. (10).
Step-10: Continue for the next ant.
Step-11: Evaporate pheromone by K, at all cells according to eq. (11).
Step-12: Continue for the next iteration.
Step-13: End.
B. TEXTURE FEATURE EXTRACTION BASED ON ACO
After the original image is composed into several regions, we aim another ACO based mechanism to define the texture characteristics inside each region, so the definition of the direction probability vector and the movement difficulty will change accordingly.
1) DIRECTION PROBABILITY VECTOR DEFINITION: The generalized form for the direction probability vector rest the
same as formula, and the 1st item stays unchanged.
However, the 2nd items is now set to emphasize the
difference of gray levels between the cell f(i) and the
centre cell f(0): The 3rd items is also given
by the local texture difference between the sub
image W( ) and the centre sub image W(0):
2) MOVEMENT DIFFICULTY DEFINITION: Trying to
increase the pheromone intensity at edge cells according to
texture change, here we let , where B is just a
constant.
3) PROCEDURE TEXTURE FEATURE EXTRACTION BASED ON ACO: The procedure of this ACO based texture representation is slightly modified from ACO image segmentation algorithm, and all the procedure is same as in section III-A-3).
IV.TEMPLATE MATCHING
A. HAMMING DISTANCE
The Hamming distance establishes a measure of how many bits are the same between two bit patterns, which we are, get from feature extraction process. Employing the Hamming distance of two bit patterns, a conclusion as to whether the two patterns were generated belongs to other irises or from the same one. In comparing the bit patterns X and Y, the Hamming distance, HD, is define as the sum of disagreeing bits (sum of the exclusive-OR between X and Y) over N, the total number of bits in the bit pattern as define in eq. (13)
ISSN: 2231-5381
http://www.ijettjournal.org
Page 386
distance is taken only with bits that are produced from the actual iris region.
B. WEIGHTED EUCLIDEAN DISTANCE
The weighted Euclidean distance (WED) can be used to compare two templates, especially if the template is composed of integer values. The weighting Euclidean distance gives a measure of how similar a collection of values are between two templates. This metric is employed by Zhu et al. [11] and is specified as in equation (14).
(14)
Where is the feature of the unknown iris, and is the
feature of iris template, k, and is the standard deviation
of the features in iris template k. The unknown iris template is found to match iris template k, when WED is a minimum at k.
C. NORMALIZED CORELATION
Wildes et al. [4] make use of normalized correlation among the acquired and database representation for goodness of match. This is represented as in equation (15).
(15)
Where and are two images of size , and are the
mean and standard deviation of , and and are the mean
and standard deviation of . Normalized correlation is
advantageous over standard correlation, since it is able to account for local variations in image intensity that corrupt the standard correlation calculation.
For matching, the Hamming distance was chosen as a metric for recognition in our proposed method, because bit-wise comparisons were requirement. The Hamming distance algorithm used also integrate noise masking, such that only significant bits are used in computing the Hamming distance between two iris templates. Now when taking the Hamming distance, only those bits in the iris pattern that regards to ‘0’ bits in noise masks of both iris patterns will be used in the calculation. The Hamming distance will be calculated using only the bits generated from the true iris region, and this
modified Hamming distance formula is given as in equation (16).
(16)
Where, and are the two bit-wise templates to
compare, and are the corresponding noise masks
for and , and N is the number of bits represented by each
template. Although, in theory, two iris templates generated from the same iris will have a Hamming distance of 0.0, in practically this will not often occur. Normalization is not perfect and complete, and also there will be some noise that goes underdetermine, so some alteration will be delivering when comparing two intra-class iris templates. In order to account for rotational inconsistencies in normalization process, when the Hamming distance of two templates is calculated, one template is shifted left and right bit-wise and a number of Hamming distance values are calculated from successive shifts. This bit-wise shifting in the horizontal direction corresponds to rotation of the original iris region by an angle given by the angular resolution used. If an angular resolution of 180 is used, each shift will correspond to a rotation of 2 degrees in the iris region. This method is suggested by Daugman [1], and corrects for misalignments in the normalized iris pattern caused by rotational differences during imaging. From the calculated Hamming distance values, only the lowest is taken, since this corresponds to the best match between two templates. The number of bits displaced at each shift is given by two times the number of filters used, since each filter will produce two bits of information data from one pixel of the normalized region of iris image. The actual
number of shifts required to normalize rotational
inconsistencies will be determined by the maximum angle difference between two images of the same eye, and one shift is defined as one shift to the left, followed by one shift to the right.
V. RESULTS AND DISCUSSIONS
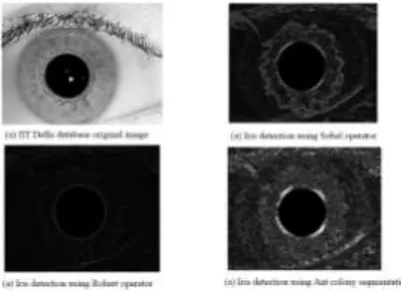
To evaluate the applicability of the proposed algorithm, Iris recognition process discussed above has been applied for IIT Delhi database. The results obtained has been shown in fig. 2
ISSN: 2231-5381
http://www.ijettjournal.org
Page 387
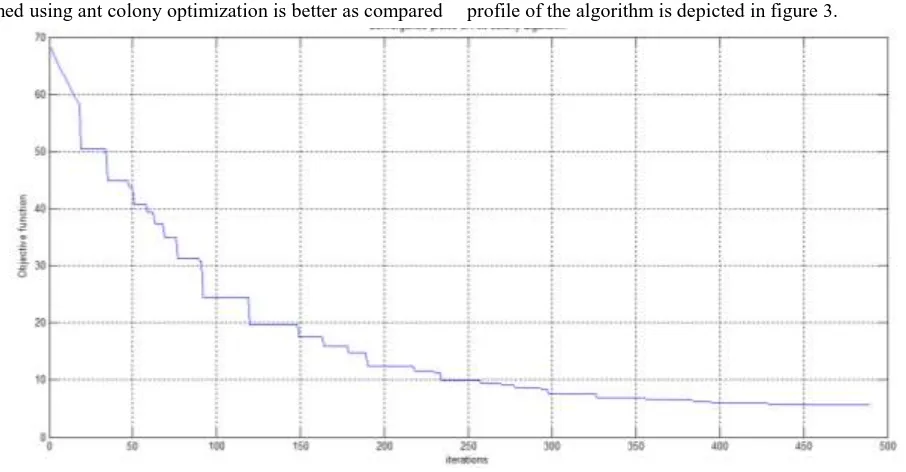
It can be observed from fig. 3 that the iris segmentation performed using ant colony optimization is better as compared
to Sobel operator and Robert operator. The convergence profile of the algorithm is depicted in figure 3.
Fig. 3 Convergence profile of ant colony optimization
VI.CONCLUSIONS
The accuracy of iris recognition is dependent on the performance of the iris segmentation and matching method. The proposed algorithm is an improvement over existing algorithm in terms of its performance and efficiency in segmentation and feature extraction.
ACKNOWLEDGMENT
The authors wish to thank to Indian Institute of Technology Delhi for providing iris data base and necessary support for carrying out this research work.
REFERENCES
[1] S. Sanderson, J. Erbetta. Authentication for secure environments based on iris scanning technology. IEEE Colloquium on Visual Biometrics, 2000.
[2] J. Daugman. How iris recognition works. Proceedings of 2002 International Conference on Image Processing, Vol. 1, 2002. [3] E. Wolff. Anatomy of the Eye and Orbit. 7th edition. H. K. Lewis &
Co. LTD, 1976.
[4] R. Wildes. Iris recognition: an emerging biometric technology. Proceedings of the IEEE, Vol. 85, No. 9, 1997.
[5] J. Daugman. Biometric personal identification system based on iris analysis. United States Patent, Patent Number: 5,291,560, 1994. [6] J. Daugman. High confidence visual recognition of persons by a test of
statistical independence. IEEE Transactions on Pattern Analysis and Machine Intelligence, Vol. 15, No. 11, 1993.
[7] R. Wildes, J. Asmuth, G. Green, S. Hsu, R. Kolczynski, J. Matey, S. McBride. A system for automated iris recognition. Proceedings IEEE Workshop on Applications of Computer Vision, Sarasota, FL, pp. 121-128, 1994.
[8] W. Boles, B. Boashash. A human identification technique using images of the iris and wavelet transform. IEEE Transactions on Signal Processing, Vol. 46, No. 4, 1998.
[9] S. Lim, K. Lee, O. Byeon, T. Kim. Efficient iris recognition through improvement of feature vector and classifier. ETRI Journal, Vol. 23, No. 2, Korea, 2001.
[10] S. Noh, K. Pae, C. Lee, J. Kim. Multi resolution independent component analysis for iris identification. The 2002 International
Technical Conference on Circuits/Systems, Computers and Communications, Phuket, Thailand,
[11] Y. Zhu, T. Tan, Y. Wang. Biometric personal identification based on iris patterns. Proceedings of the 15th International Conference on Pattern Recognition, Spain, Vol. 2, 2000.
[12] C. Tisse, L. Martin, L. Torres, M. Robert. Person identification technique using human iris recognition. International Conference on Vision Interface, Canada, 2002.
[13] Portions of the work tested on the IITD Iris Database version 1.0" A citation to "IIT Delhi Iris Database version 1.0, http://web.iitd.ac.in/~biometrics/Database_Iris.htm
[14] C. Barry, N. Ritter. Database of 120 Grayscale Eye Images. Lions Eye Institute, Perth Western Australia.
[15] W. Kong, D. Zhang. Accurate iris segmentation based on novel reflection and eyelash detection model. Proceedings of 2001 International Symposium on Intelligent Multimedia, Video and Speech Processing, Hong Kong, 2001.
[16] D. Field. Relations between the statistics of natural images and the response properties of cortical cells. Journal of the Optical Society of America, 1987.
[17] P. Burt, E. Adelson. The laplacian pyramid as a compact image code. IEE Transactions on Communications, Vol. COM-31, No. 4, 1983. [18] L.U. Jue, An Self-Adaptive Ant Colony Optimization Approach for
Image Segmentation, International Conference on Space Information Technology, 5985 (2005) pp.647–652
[19] V. Ramos, F. Almeida, Artificial Ant Colonies in Digital Image Habitats—A mass Behavior Effect Study on Pattern Recognition, in: Proc. of 2nd Int. Wksp. on Ant Algorithms, Belgium, September 2000, pp. 113–116
[20] X. Zhuang, N.E. Mastorakis Image processing with the artificial swarm intelligence WSEAS Transactions on Computers, 4 (4) (2005), pp. 333 –341
[21] L. Bocchi, L. Ballerini, S. Hassler A new evolutionary algorithm for image segmentation EuroGP’05 Evo Workshops, LNCS series, Springer-Verlag (2005)
[22] J. Breckling, Ed., The Analysis of Directional Time Series:
Applications to Wind Speed and Direction, ser. Lecture Notes in
Statistics. Berlin, Germany: Springer, 1989, vol. 61.
[23] A. Oppenheim, J. Lim. The importance of phase in signals