for furthering stakeholder engagement within the realms of Real Estate 4.0 and Facility Management (FM), especially in a spatial representation context. In this paper, we propose a general system architecture that integrates point cloud data and sensor data for visualization and analysis. We further present a prototypical web-based implementation of that architecture and demonstrate its application for the integration and visualization of sensor data from a typical office building, with the aim to communicate and analyze occupant comfort. The empirical results obtained from our prototypical implementation demonstrate the feasibility of our approach for the provisioning of light-weight software components for the service-oriented integration of Building Information Modeling (BIM), Building Automation Systems (BASs), Integrated Workplace Management Systems (IWMSs), and future Digital Twin (DT) platforms.
Keywords:point clouds, indoor sensor data, 3D visualization, facility management, digital twins
1. Introduction
One of the key challenges in FM is visualization of historic and current sensor data within as-is built environment representations, e.g., digital floor plans or 3D building models, derived from a building’s DT. Sensors measuring building-related natural and man-made phenomena can provide information and insights about the current operational status of a building or a site. Using 3D point clouds, we are able to routinely capture theas-is
state of the built environment at varying resolutions, and to keep the geometric dimension of a building’s DT up to date. Continuously measured sensor data can then be mapped to point cloud representations. Visualizing sensor data within its spatial context offered by point cloud representations, which depict the physical locations of where this data occurs and is measured in, can enhance analysis, intervention, forecasting, and decision making processes within the context of FM (specifically, Operations and Maintenance (OM)). In that sense, the combined visualization of sensor data and indoor point clouds forms a key component of representation for DTs. However, the linking of captured sensor data to the physical assets (e.g., rooms, Mechanical, Electrical and Plumbing (MEP) components) they refer to, and their combined visualization and resulting enhancement of decision making and communication, remains a key challenge in today’s Architecture, Engineering and Construction (AEC) domains.
There is a lack of approaches and related methods in current research for service-oriented systems integration and visualization of indoor sensor data with 3D point cloud representations. The presented research addresses this problem by providing a conceptual system architecture and approach for combined visualization of indoor sensor data and as-is point cloud representations.
With this architecture, we address the following requirements and challenges: (1) routine acquisition and processing of the digital representation of the built environment using low-cost devices (e.g., commodity mobile devices), (2) acquisition and processing of data from multiple sensors, and (3) its interactive mapping and visualization in a service-oriented system.
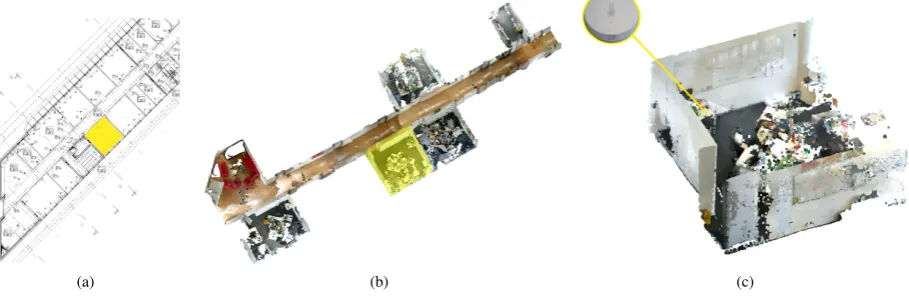
We implement and test key components of the conceptual system architecture, which are used to enable combined visualization of sensor and indoor point cloud data, using web-based 3D visualization. We focus on as-is point cloud representations instead of as-built and as-is BIM representations. With a case study and empirical results, we further evaluate our visualization approach, using point cloud representations of actual indoor offices (Fig. 1).
2. Foundations and Related Work
2.1 Point Cloud Representations
The main benefit of point clouds is that they can capture
spatial attributesof a physical scene (Qu and Sun, 2015), encode as XY Z Cartesian or longitude/latitude coordinates, as well as appearance characteristics, such as Red-Green-Blue (RGB) color data (Otepka et al., 2013). Initially acquired point clouds need to be further processed, which can be automated using established point cloud processing methods (Berger et al., 2017), (Kehoe et al., 2015). The fact that they can encode the physical attributes of a given location in 3D space makes them useful for generating further semantics using, for example, specific shape-grammar rules (Tran et al., 2018), clustering (Xue et al., 2019) or deep-learning methods (Griffiths and Boehm, 2019).
(a) (b) (c)
Figure 1. The case study office area. (a) The office area floor plan, (b) The acquired and processed 3D point cloud used for the case study, and (c) Point cloud representation of the specific room according to the office floor plan, and an illustration of where one of the sensors (temperature sensor) is located within the room.
and flexible comparison with existing as-built or
as-designed BIM geometry, as well as possibilities for reconstruction toas-isBIM data (Volk et al., 2014). Coupled with the fact that point clouds can be acquired routinely and flexible (especially using commodity mobile hardware (Froehlich et al., 2017), (Kalyan et al., 2016)), and are cheaper and easier to generate than BIM models (encoded e.g., in Industry Foundation Classes (IFC) format), makes point clouds a desirable entity for indoor built environment representations.
2.2 Service-Oriented Systems
An important feature of service-oriented systems is that they can decouple hardware requirements, needed for computing complex visualizations and analytics, from client devices that may not have certain hardware capabilities (Hildebrandt et al., 2011). Service-oriented systems can benefit FM by seamlessly integrating various data sources required for creating a complete DT of the built environment (Teizer et al., 2017). Due to the routine and frequent nature of FM operations, a centralized online system with on-demand processing capabilities and streaming to thick, medium or thin clients provides an advantage over using monolithic enterprise software on workstations (Discher et al., 2019). This facilitates routine acquisition, processing and visualization of required data, and allows for analytic insight into various operational data, such as occupant comfort features of indoor spaces (Teicholz et al., 2013).
In recent years, a number of specifications for integrating Internet-of-Things (IOT) devices, related digital data and web-based services have emerged, e.g., standards introduced and maintained by the Open Geospatial Consortium (OGC)1 (e.g., OGC SensorThings, OGC SOS, OGC SensorML), as well as the experimental Building Information Modelling Sensor Language (BIMSL) (Alves et al., 2017), and IFCSensor
data representations for BIM models2.
Schefferet al. describe a prototype system for integrating sensor data readings into simple IFC model
1http://www.opengeospatial.org/standards 2http://www.buildingsmart-tech.org/ifc/IFC4/
final/html/schema/ifcbuildingcontrolsdomain/lexical/ ifcsensor.htm
representations (Scheffer et al., 2018). Santhanavanich
et al. present a prototypical service-oriented platform for integrated sensor and geospatial information representation (Santhanavanich et al., 2018). They evaluate three different sensor specifications (OGC SensorThings, OGC SOS and Advanced Sensor Data Delivery Service (ASDDS)). We make use of a REST-based system for acquiring the sensor data from an
edgecontroller prior to further visualization.
2.3 BIM and Sensors Technology Integration
BIM enables multidimensional modeling and simulation of various aspects of the built environment (e.g., 3D geometry, cost, time, etc (Smith, 2014)). This allows BIM models or other as-is built environment representations, such as point clouds, to be used alongside spatio-temporal data to simulate, assess and forecast various scenarios associated with the as-is state of a built environment (Khan and Hornbæk, 2011).
Lu et al. describe the development and testing of a prototypical DT of their University of Cambridge campus. They propose an integrated system architecture, making use ofas-isBIM models as the main representational data source, along with other data sources (e.g., real-time sensor data, IoT devices, asset management data, tags and other digital documentation) (Lu et al., 2019).
A web-based BAS system was developed by Leeet al. , intended to provide better insight into energy efficiency monitoring and decision making (Lee et al., 2016). This web-based visualization system uses 3D visualization of a simplified as-built BIM of a school building, alongside graph-based 2D visualization of sensor data readings.
Arthur et al. simulate the use of integrating numerous sensors within a given building (Arthur et al., 2018). Their approach simulates the use of temperature and humidity sensors using a Data as a Service Platform paradigm, which allows for empirical results to be collected and analyzed for further implementation feasibility studies.
decision making concerning construction progress monitoring, focusing on lean construction concepts (Tezel et al., 2017). They state the advantages of integrating ”Site Data Collection” (e.g., GPS, LIDAR, RFID and other sensor data), and transmitting this data via WLAN or 3G/4G networks to a database and associated Enterpise Resource System (ERP), as well as to thin, medium and thick clients for further digital documentation and visualization.
Chien et al. describe AssetHub, a cloud BIM-based integrated platform for building services (Chien et al., 2017). The authors make use of a Level-of-Detail (LOD) 500 as-built BIM model together with associated digital object identification numbers, and then map location specific sensor data analysis and visualization outputs.
Research by Khalidet al. describes the development of a prototypical BMS using a game engine to enable combined interactive 3D visualization of built environment and sensor data (Khalid et al., 2017). The authors state the benefit of using a modern 3D graphics engine to visualize the information-rich BIM models in 3D and enhance stakeholder engagement through visual communication.
2.5 Visualization of Indoor Sensor Data
Different visualization approaches for sensor data include examples of: thematic color mapping of segmented indoor areas (Patlakas et al., 2017), textual information displayed alongside the 3D model (Pouke et al., 2018), abstracted 3D visualization elements such as 3D bar graphs (Virtanen et al., 2016), and combined 2D data results with spatially corresponding 3D scene markers for linked visualization of energy-related building data (Sihombing and Coors, 2018).
Changet al. describe the design and implementation of a BIM-based sensor data visualization platform for assessing occupant comfort in a classroom, based on temperature data readings and visualization (Chang et al., 2018). Additionally, they map an RGB color-based scale to this data, over a finite element 3D mesh, placed at a given height in the BIM representation of the given classroom. They also note that their approach of sensor data visualization offers FM operators greater insight into occupant comfort and energy usage, in comparison the original 2D analytics and textual-based system they previously used.
The cited research has influenced us to make use of modern web-based 3D visualization frameworks that allow for rapid prototyping focusing on suitable visualization styles for sensor data analytics.
cost) and its interfaces, and the expertise required to combine these two areas in one as-is built environment representation. We therefore focus on use of affordable hardware for sensing of room properties, e.g., temperature, humidity, and carbon dioxide concentration, and processing corresponding data. We then map this processed sensor data onto the point cloud using the visualization techniques outlined in Sec. 4.
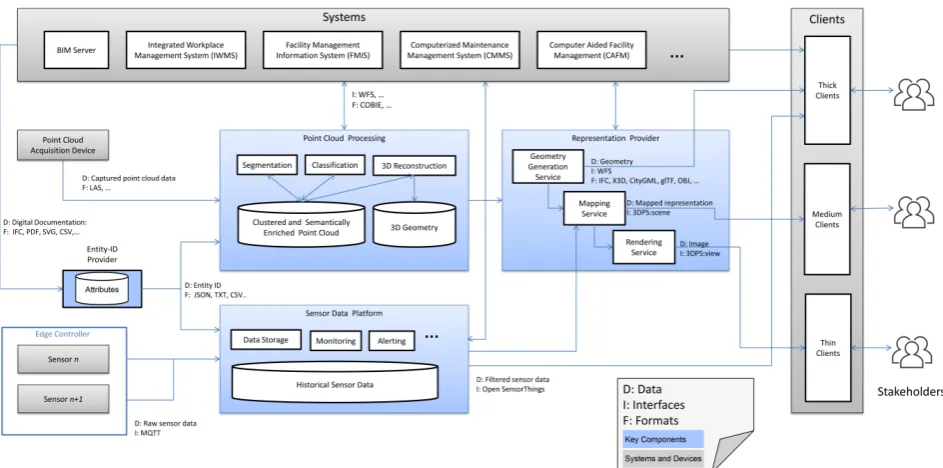
The sensor data is filtered and stored by theSensor Data Platform, from where it can be queried by the
Representation Provider and external FM realted IT systems, such as Facility Management Information Systems (FMISs) and Computerized Maintenance Management Systems (CMMSs). The filtered sensor data, along with the point cloud representation, is given additional attributes via the Entity-ID Provider
component. This component extracts location and other information from existing building documentation (e.g., longitude and latitude coordinates and room dimensions acquired from as-built BIM model, radio-frequency identification (RFID) or near-field communication (NFC) tags, etc.), in order to enable automated or manual adding of semantics into the combined point cloud and sensor data information model. These semantics can then be used by stakeholders to identify important physical and location aspects, using the as-is point cloud representation. The generated visualization result, as well as the acquired and filtered sensor data, are sent to clients.
Clients are distinguished by their hardware specifications and processing capabilities as thick, medium, and thin
clients. Thick clientsare typically PCs that have hardware specification similar to that of the server (e.g., high-end workstation PCs). Such computers can be used to process the acquired point cloud data as well as the sensor data visualization, thus they can receive the full 3D point cloud, sensor data and other associated data required for generating the final visualization result. Medium clients
Figure 2. Proposed general system architecture for combined analysis and visualization of indoor sensor data and point cloud representations using a service-oriented approach.
Acquisition of indoor point clouds is accomplished using a mobile scanning device. Modern mobile devices can be used to generate a 3D point cloud for indoor space using photogrammetry and/or depth sensing. Once this acquired point cloud is processed, it can be used to map different sensor data visualizations onto. We present the process for point cloud acquisition and processing in Sec. 3.2.
3.1 Sensor Data Platform
The Sensor Data Platform component is responsible for the storage, analysis, monitoring, querying, and web-based streaming of sensor data. Sensors can either be connected through the industry standard MQTT3protocol for lightweight data transmission, or by issuing Hypertext Transfer Protocol (HTTP) POST requests, with both containing JavaScript Object Notation (JSON)-formatted data as payload. There are numerous types of communication protocols for sensors based on low-energy, low-bandwidth radio transmission (e.g., ZigBee, Z-Wave, EnOcean, or LoRaWAN), or wired bus connections. Low-cost edge controllers translate the local sensor data messages sent through such low-level protocols into JSON data packets that can be evaluated by the services of the Sensor Data Platform.
For querying sensor data (stored e.g., in a temporal database) and corresponding metadata, the platform provides an Application Programming Interface (API) following the Representational State Transfer (REST) paradigm and JSON:API specification4. Further, live updates of sensor data values can be subscribed using a websocket message-based API. Through this, sensor value changes are propagated e.g., to the Mapping Service to be visually reflected in the final visualization. Historical sensor data is stored in a time series database that combines efficient access to sensor values as well as
3MQTT 5 OASIS Standard: https://docs.oasis-open.org/
mqtt/mqtt/v5.0/mqtt-v5.0.html
4https://jsonapi.org
memory efficient data organization. The Monitoring
sub-component of the Sensor Data Platform evaluates given rules for sensor data and generates events in case of identified matches. For such events, an Alerting
sub-component can calls previously registered notification targets, such as IWMS or FMIS APIs. These systems are then able to react to the changes or by triggering automated responses such as turning on the air-conditioning if the recorded temperature value is above a certain temperature at a given time of day.
3.2 Point Cloud Processing
ThePoint Cloud Processingcomponent is responsible for the processing and generation of a semantically-enriched
as-is point cloud of a given indoor environment. It provides three sub-components, which can be used individually or combined, to segment, classify and reconstruct a given 3D point cloud.
The Segmentation sub-component is used to divide and mark the homogeneous regions of point clusters, which allows for quicker identification of physical features (Nguyen and Le, 2013). After segmentation, the normal vectors for each of the point clusters are pre-computed. The use of normal vectors is required for tasks such as those performed by the 3D reconstruction
component (Mitra and Nguyen, 2003).
The Classification sub-component generates labels for certain point clusters, thus contributing significantly to the semantic-enrichment of the complete point cloud representation. Point clusters are typically classified using a Convolutional Neural Network (CNN) (Ioannidou et al., 2017), though varying data sources can be used to training a CNN, as well as using different deep-learning models (Griffiths and Boehm, 2019).
TheGeometry Generation Serviceis used to create the as-isgeometry from the semantically-enriched point cloud or reconstructed geometry.
TheMapping Serviceis used to map the acquired sensor data values to a given point cloud or reconstructed triangular mesh geometry partition. This may include sensor data that maps specific attributes such as temperature for a given room. Semantically-enriched point clusters are critical to this this task, as semantics allow for the association of labelled geometry segments with sensor data that is physically located in the real-world counterpart of the 3D representation (e.g., labelled point clusters that distinguish different types of typical office furniture or other indoor environment elements e.g., doors, radiators or lighting fixtures — obtained from the Classification sub-component of the
Point Cloud Processingcomponent).
The Rendering Service is responsible for generating the final visualization result. The rendering service can make use of low or high-level graphics APIs and frameworks (e.g., OpenGL, WebGL, etc.) in order to generate rendered images (usually in real-time), which can easily be displayed on the client side (either partially/fully processed and displayed by the client hardware, or partially/fully streamed from the server).
4. Case Study
For the case study we implemented and made use of all of the key components from the proposed general system architecture (Fig. 2), and tested our approach using a prototypical web-based application for visualizing indoor sensor data. We used amedium clientfor generating the final visualization results (a commodity laptop with an Intel i51.8 GHzCPU,8 GBRAM, and NVidia GeForce MX150 GPU with2 GBvideo memory, using the FireFox 67.0 web browser). The main focus of our case study was to visualize room temperature, humidity and carbon dioxide recordings for occupant comfort assessment of a typical office environment (Fig. 1) by linking this data to a given point cloud representation that visualizes the physical features of the corresponding room location.
While we acquired the point cloud representation of the majority of the office area, we focused on visualizing temporal changes for a single office where the sensors are located (Fig. 1(c)). The indoor point cloud was acquired using an ASUS ZenFone AR mobile device with a depth-sensing camera. The point cloud was then registered using the provided floor plan, cleaned, and segmented (using both manual and automated segmentation methods). The processed point cloud contains 3 435 027 points, with additionally computed
perform any texture-based rendering tasks (e.g., mapping the given sensor data readings to a given color value). The client application is implemented in JavaScript and HTML5, while the majority of the server components are also implemented in JavaScript. We make use of Node.js6 for implementing anexpress server7for parsing processed sensor data stored as JSON files on the server. We make use of the Socket.io8 framework for implementing a simple WebSockets-based client-server system. For our prototype implementation, we did not make explicit use of a database, but instead used JSON files stored on the server to access processed sensor valuess obtained for a given time period.
We used temperature, humidity and carbon dioxide sensors to record room temperatures over a period of one month during April 2019. Since the sensors produced a large amount of sensor data, for practicality we sampled 100time points in increments from the filtered sensor data and visualized it. Based on the reviewed visualization examples in Sec. 2.5, we decided to make use of combined visualization styles to visually convey temporal changes alongside the associated point cloud representation. We used three different visualization methods: (1) thematic color-mapping, (2) textual data display, and (3) abstracted 3D geometric representation. The selected visualization methods are based on establishedvisualization idiomsused to convey geometric and textual abstractions of processed numerical data (Haber and McNabb, 1990)
The first method maps the given temperature, carbon dioxide and humidity sensor data to a given color, using three different thematic color scales based on diverging, saturated and multi-hue color scales to visually represent the related changes. The color scales were based on research by Engel et al. looking at qualitative and quantitative evidence collected from user study evaluating impact of rendering techniques on information and spatial perception (Engel et al., 2013).
We mapped the sensor data by taking into account the maximum and minimum room temperatures, humidity and carbon dioxide levels that were recorded in the sampled sensor data time-series. The minimum and maximum values were then used to interpolate between the selected color ranges every time new sensor data was parsed and sent to the visualization component. We use ranges from0 to 30degrees Celsius for the temperature mapping,0to100percent for humidity mapping, and0to
1000 parts per million (ppm) for the carbon dioxide mapping.
The second visualization method makes use of a vertically scaled 3D cuboid for 3D bar-graph style visualization. The scaling and the RGB color value of the cuboid is based on the current sensor value.
The third method renders the parsed sensor data as a 2D billboard (Akenine-M¨oller et al., 2018), displaying the current temperature. The billboard is further associated with each 3D cuboid used in the second visualization method, using a line element whose starting point changes with the current height of the 3D cuboid. Billboard rendering is accomplished using the provided 2D text rendering functionality offered by the Three.js framework. This method is useful for giving better context alongside the other two visualization methods.
An additional 2D bar graph is also included alongside the main visualization of each individual sensor data type to provide better visualization context in relation to previous and future sensor data values.
Empirical Results. We present empirical results showing the visualization outputs obtained using the prototypical implementation of our described approach (Figs. 3 to 5). We demonstrate the temporal visualization changes using two different time points (t0,
t1), with different temperature, humidity and carbon dioxide readings. We also show simultaneous visualization results using a combined approach, featuring thematic color-mapping, textual and abstracted geometry visualization for each parsed time point of the temperature, humidity and carbon dioxide readings (Fig. 6).
5. Discussion and Conclusions
The obtained experimental results demonstrate a simple but effective method for mapping acquired sensor data to an interactive 3D visualization, using the spatially corresponding indoor 3D point cloud representations of a typical office space. We also address how the proposed system architecture meets the original requirements outlined in Sec. 1.
Firstly, the prototypical application demonstrates that lower-fidelity RGB point cloud representations, acquired using photogrammetry and/or depth sensing with commodity mobile devices, provide enough visual information to enhance the spatially-aligned sensor data visualization. This means that they can be used as a practical alternative to BIM models for combined sensor data visualization.
Secondly, we have demonstrated that multiple sensor data sources can be utilized for capturing different natural and man-made phenomena from a given indoor environment, by processing and visualizing room temperature, humidity and carbon dioxide levels.
Thirdly, with the use of Web3D-based visualization frameworks, which are implemented as visualization components within the proposed service-oriented system architecture, we can interactively and simultaneously visualize the indoor point cloud with the corresponding
spatially correlated sensor readings for a given period of time — allowing us to intuitively present insights into the underlying spatio-temporal data through visualization to stakeholders.
Finally, our proposed general system architecture has potential for integration as a flexible and practical solution for IWMSs that require sensor data acquisition and visualization of indoor environments.
Acknowledgements
This work has been partially funded by the German Federal Ministry of Economic Affairs and Energy (BMWi) as part of the ZIM program, and the Research School on Service-Oriented Systems Engineering of the Hasso Plattner Institute, Faculty of Digital Engineering, University of Potsdam, Germany.
References
Akenine-M¨oller, T., Haines, E., Hoffman, N., Pesce, A., Iwanicki, M. and Hillaire, S., 2018. Real-Time Rendering 4th Edition. A K Peters/CRC Press, Boca Raton, FL, USA. Alves, M., Carreira, P. and Costa, A. A., 2017. Bimsl: A generic approach to the integration of building information models with real-time sensor data. Automation in Construction84, pp. 304–314.
Arthur, S., Li, H. and Lark, R., 2018. The emulation and simulation of internet of things devices for building information modelling (bim). In: Workshop of the European Group for Intelligent Computing in Engineering, Springer, pp. 325–338.
Berger, M., Tagliasacchi, A., Seversky, L. M., Alliez, P., Guennebaud, G., Levine, J. A., Sharf, A. and Silva, C. T., 2017. A survey of surface reconstruction from point clouds. In: Computer Graphics Forum, Vol. 36number 1, Wiley Online Library, pp. 301–329.
Chang, K.-M., Dzeng, R.-J. and Wu, Y.-J., 2018. An automated iot visualization bim platform for decision support in facilities management. Applied Sciences8(7), pp. 1086.
Chien, S.-c., Chuang, T.-c., Yu, H.-S., Han, Y., Soong, B. H. and Tseng, K. J., 2017. Implementation of cloud bim-based platform towards high-performance building services. Procedia environmental sciences 38, pp. 436– 444.
Discher, S., Richter, R. and D¨ollner, J., 2019. Concepts and techniques for web-based visualization and processing of massive 3d point clouds with semantics.Graphical Models
p. 101036.
D¨ollner, J., Hagedorn, B. and Klimke, J., 2012. Server-based rendering of large 3d scenes for mobile devices using g-buffer cube maps. In: Proceedings of the 17th International Conference on 3D Web Technology, ACM, pp. 97–100.
Engel, J., Semmo, A., Trapp, M. and D¨ollner, J., 2013. Evaluating the perceptual impact of rendering techniques on thematic color mappings in 3d virtual environments. In:
Vision, Modeling and Visualization, pp. 25–32.
Froehlich, M., Azhar, S. and Vanture, M., 2017. An investigation of google tangoR tablet for low cost 3d scanning. In: ISARC. Proceedings of the International Symposium on Automation and Robotics in Construction, Vol. 34.
Griffiths, D. and Boehm, J., 2019. A review on deep learning techniques for 3d sensed data classification.
Figure 3. Visualization of room temperature captured for two time points: (a)t0:23.3Celsius. (b)t1:25.6Celsius.
(a) (b)
Figure 4. Visualization of room humidity captured for two time points: (a)t0:38%. (b)t1:22%.
(a) (b)
Figure 5. Visualization of room carbon dioxide captured for two time points: (a)t0:681ppm. (b)t1:406ppm.
(a) (b)
Haber, R. B. and McNabb, D. A., 1990. Visualization idioms: A conceptual model for scientific visualization systems.Visualization in scientific computing74, pp. 93. Hildebrandt, D., Klimke, J., Hagedorn, B. and D¨ollner, J., 2011. Service-oriented interactive 3d visualization of massive 3d city models on thin clients. In: Proceedings of the 2nd International Conference on Computing for Geospatial Research & Applications, ACM, p. 6.
Ioannidou, A., Chatzilari, E., Nikolopoulos, S. and Kompatsiaris, I., 2017. Deep learning advances in computer vision with 3d data: A survey. ACM Computing Surveys (CSUR)50(2), pp. 20.
Kalyan, T. S., Zadeh, P. A., Staub-French, S. and Froese, T. M., 2016. Construction quality assessment using 3d as-built models generated with project tango. Procedia Engineering145, pp. 1416–1423.
Kehoe, B., Patil, S., Abbeel, P. and Goldberg, K., 2015. A survey of research on cloud robotics and automation.
IEEE Transactions on automation science and engineering
12(2), pp. 398–409.
Kensek, K., 2014. Integration of environmental sensors with bim: case studies using arduino, dynamo, and the revit api.
Khalid, M. U., Bashir, M. K. and Newport, D., 2017. Development of a building information modelling (bim)-based real-time data integration system using a building management system (bms). In: Building Information Modelling, Building Performance, Design and Smart Construction, Springer, pp. 93–104.
Khan, A. and Hornbæk, K., 2011. Big data from the built environment. In: Proceedings of the 2nd international workshop on Research in the large, ACM, pp. 29–32. Lee, D., Cha, G. and Park, S., 2016. A study on data visualization of embedded sensors for building energy monitoring using bim. International journal of precision engineering and manufacturing17(6), pp. 807–814. Lim, S. P. and Haron, H., 2014. Surface reconstruction techniques: a review. Artificial Intelligence Review42(1), pp. 59–78.
Lu, Q., Parlikad, A., Woodall, P., Don Ranasinghe, G. and Heaton, J., 2019. Developing a dynamic digital twin at a building level using cambridge campus as a case study. Mitra, N. J. and Nguyen, A., 2003. Estimating surface normals in noisy point cloud data. In: Proceedings of the nineteenth annual symposium on Computational geometry, ACM, pp. 322–328.
Nguyen, A. and Le, B., 2013. 3d point cloud segmentation: A survey. In: 2013 6th IEEE conference on robotics, automation and mechatronics (RAM), IEEE, pp. 225–230. Otepka, J., Ghuffar, S., Waldhauser, C., Hochreiter, R. and Pfeifer, N., 2013. Georeferenced point clouds: A survey of features and point cloud management.ISPRS International Journal of Geo-Information2(4), pp. 1038–1065.
Pasini, D., Ventura, S. M., Rinaldi, S., Bellagente, P., Flammini, A. and Ciribini, A. L. C., 2016. Exploiting internet of things and building information modeling framework for management of cognitive buildings. In:
2016 IEEE International Smart Cities Conference (ISC2), IEEE, pp. 1–6.
Patlakas, P., Koronaios, G., Raslan, R., Neighbour, G. and Altan, H., 2017. Case studies of environmental visualization. Energies10(10), pp. 1459.
Pouke, M., Virtanen, J.-P., Badri, M. and Ojala, T., 2018. Comparison of two workflows for web-based 3d smart home visualizations. In: 2018 IEEE International Conference on Future IoT Technologies (Future IoT), IEEE, pp. 1–8.
Qu, T. and Sun, W., 2015. Usage of 3d point cloud data in bim (building information modelling): Current applications and challenges. Journal of Civil Engineering and Architecture9(11), pp. 1269–1278.
Santhanavanich, T., Schneider, S., Rodrigues, P. and Coors, V., 2018. Integration and visualization of heterogeneous sensor data and geospatial information.
ISPRS Annals of Photogrammetry, Remote Sensing & Spatial Information Sciences.
Scheffer, M., Konig, M., Engelmann, T., Tagliabue, L., Ciribini, A., Rinaldi, S. and Pasetti, M., 2018. Evaluation of open data models for the exchange of sensor data in cognitive building. In: 2018 Workshop on Metrology for Industry 4.0 and IoT, IEEE, pp. 151–156.
Sihombing, R. and Coors, V., 2018. Linking 3d building models, maps and energy-related data in a web-based visualization system. ISPRS Annals of Photogrammetry, Remote Sensing & Spatial Information Sciences.
Smith, P., 2014. Bim & the 5d project cost manager.
Procedia-Social and Behavioral Sciences 119, pp. 475– 484.
Teicholz, P. et al., 2013. BIM for facility managers. John Wiley & Sons.
Teizer, J., Wolf, M., Golovina, O., Perschewski, M., Propach, M., Neges, M. and K¨onig, M., 2017. Internet of things (iot) for integrating environmental and localization data in building information modeling (bim). In:
ISARC. Proceedings of the International Symposium on Automation and Robotics in Construction, Vol. 34. Tezel, B., Aziz, Z. et al., 2017. From conventional to it based visual management: a conceptual discussion for lean construction. Journal of Information Technology in Construction22, pp. 220–246.
Tran, H., Khoshelham, K., Kealy, A. and D´ıaz-Vilari˜no, L., 2018. Shape grammar approach to 3d modeling of indoor environments using point clouds.Journal of Computing in Civil Engineering33(1), pp. 04018055.
Virtanen, J.-P., Kurkela, M., Hyypp¨a, H., Niemi, S., Kalliokoski, S., Vanhatalo, S., Hyypp¨a, J., Haggr´en, H., Nenonen, S., Junnonen, J.-M. et al., 2016. Visualization of building models and sensor data using open 3d platforms. In: Proceedings of the CIB World Building Congress, Vol. 4, Tampere University of Technology, pp. 178–189. Volk, R., Stengel, J. and Schultmann, F., 2014. Building information modeling (bim) for existing buildings—literature review and future needs.Automation in construction38, pp. 109–127.
Xiong, X., Adan, A., Akinci, B. and Huber, D., 2013. Automatic creation of semantically rich 3d building models from laser scanner data. Automation in construction31, pp. 325–337.