Bubble-Flux: Precise Online QoS Management for
Increased Utilization in Warehouse Scale Computers
Hailong Yang
∗Alex Breslow
Jason Mars
Lingjia Tang
University of California, San Diego{h5yang, abreslow, mars, lingjia}@cs.ucsd.edu
ABSTRACT
Ensuring the quality of service (QoS) for latency-sensitive applications while allowing co-locations of multiple appli-cations on servers is critical for improving server utiliza-tion and reducing cost in modern warehouse-scale computers (WSCs). Recent work relies on static profiling to precisely predict the QoS degradation that results from performance interference among co-running applications to increase the number of “safe” co-locations. However, these static profil-ing techniques have several critical limitations: 1) a priori knowledge of all workloads is required for profiling, 2) it is difficult for the prediction to capture or adapt to phase or load changes of applications, and 3) the prediction technique is limited to only two co-running applications.
To address all of these limitations, we present Bubble-Flux, an integrated dynamic interference measurement and online QoS management mechanism to provide accurate QoS control and maximize server utilization. Bubble-Flux uses a
Dynamic Bubbleto probe servers in real time to measure
the instantaneous pressure on the shared hardware resources and precisely predict how the QoS of a latency-sensitive job will be affected by potential co-runners. Once “safe” batch jobs are selected and mapped to a server, Bubble-Flux uses
anOnline Flux Engineto continuously monitor the QoS
of the latency-sensitive application and control the execu-tion of batch jobs to adapt to dynamic input, phase, and load changes to deliver satisfactory QoS. Batch applications remain in a state of flux throughout execution. Our results show that the utilization improvement achieved by Bubble-Flux is up to 2.2x better than the prior static approach.
1.
INTRODUCTION
Improving utilization in modern warehouse-scale comput-ers (WSCs) has been identified as a critical design goal for reducing thetotal cost of ownership (TCO) for web service providers [5]. However, the over-provisioning of compute
re-∗Hailong was a visiting student at UCSD from Beihang
Uni-versity at the time of this work.
Permission to make digital or hard copies of all or part of this work for personal or classroom use is granted without fee provided that copies are not made or distributed for profit or commercial advantage and that copies bear this notice and the full citation on the first page. To copy otherwise, to republish, to post on servers or to redistribute to lists, requires prior specific permission and/or a fee.
ISCA’13,Tel-Aviv, Israel.
Copyright 2013 ACM 978-1-4503-2079-5/13/06 ...$15.00.
sources in WSCs to ensure high quality of service (QoS) of latency-sensitive applications, such as Web-seach, continues to be prohibitive in realizing high utilization.
Arguably the most challenging obstacle to improving uti-lization in modern WSCs is in providing precise QoS pre-diction and management for latency-sensitive applications when co-running with other applications. The lack of soft-ware and hardsoft-ware mechanisms to dynamically and instan-taneously detectpreciselyhow jobs interfere when co-located on a single server has resulted in WSC operators simply dis-allowing co-location for user-facing latency sensitive appli-cations. This challenge is a major contributor to low utiliza-tion in WSCs with average utilizautiliza-tion typically under 50%, even at large companies such as Microsoft and Google [6]. In fact, a recent article from Wired reported that Mozilla’s and VMWare’s data centers operate at 6% utilization and at 20 to 30% utilization respectively [27].
Recent work [24,25] has proposed a static profiling tech-nique to precisely predict the QoS interference and degra-dation for latency-sensitive applications when co-located. Based on the prediction, the cluster scheduler can identify batch applications that provide “safe” co-locations without causing significant QoS degradation, effectively improving server utilization while enforcing QoS requirements. How-ever, this technique has several limitations that critically affect its generality and effectiveness. These include:
1. [A Priori Knowledge Required]Static techniques
requirea prioriknowledge about all workloads and the profiling for each type of workload. This requirement limits both the types of workloads for which such a technique can be applied and, more broadly, the type of datacenters that can adopt the approach.
2. [Inability to Adapt]Static profiling and prediction
techniques cannot capture nor adapt to application phase, input, and load changes during execution and across executions.
3. [Limited Co-location Scalability]Prior techniques
are limited to predicting interference between two co-located applications and cannot scale to three or more. This limitation is particularly problematic consider-ing the increasconsider-ing core counts in newer generations of servers.
These challenges result from the requirement that a static approach be overly conservative in its prediction. As de-scribed in prior work [24,25], static techniques produce con-servative predictions by profiling under peak load conditions,
which, as we show in this work, significantly limits the po-tential utilization improvement especially during low-load periods for latency-sensitive applications. In addition, the lack of online adaptability of the static approaches may lead to QoS violations due to dynamic behaviors unseen during the profiling period.
In this work, we presentBubble-Flux, a holistic runtime approach that provides prediction-based “safe” co-location identification and online precise QoS management to deliver satisfactory QoS and maximize utilization. Bubble-Flux ad-dresses each of the three limitations described above. By using novel mechanisms for instantaneous, precise interfer-ence prediction and runtime QoS enforcement, Bubble-Flux requires 1) no a priori knowledge of applications, 2) can adapt to phase, input, and load changes in both the latency-sensitive and batch applications, and 3) scales beyond pair-wise co-locations to co-locations of three or more applica-tions.
Bubble-Flux consists of two main components: the Dy-namic BubbleandOnline Flux Engine. Instead of profiling latency-sensitive applications in a controlled environment, aDynamic Bubble is used to probe each server to measure shared resource pressure in real-time and quantify the in-stantaneous QoS sensitivity of the latency-sensitive applica-tion online with negligible overhead. The cluster scheduler performs this probe before scheduling, and by doing so, is able to capture various factors in a production environment that may have a significant impact on the QoS sensitivity of latency-sensitive applications. These factors include the current load for the application and the load of batch ap-plications that are co-running on the server, among others. This in turn facilitates the cluster scheduler to identify more “safe” co-loation opportunities. For example, during a low load period when the latency-sensitive application is not as vulnerable to interference, more co-location opportunities can be identified.
When batch applications are launched and co-located with latency-sensitive applications they remain in a state of flux. TheOnline Flux Engineemploys a dynamic phase-in/phase-out (PiPo) mechanism to monitor the QoS of the latency-sensitive applications and adaptively adjust the execution rate of batch applications to meet the specified QoS thresh-old. With this Flux Engine in place, the batch applications can respond to execution phase changes, input changes, and load variations, guaranteeing the QoS of latency-sensitive applications while maximizing machine utilization. PiPo can scale up beyond pairwise co-locations and manage multiple batch applications. In addition, PiPo is also particularly useful for managing new applications that have not been profiled before by gradually phasing in these applications to control their QoS interference. This capability to manage interference without a priori knowledge is critical for both the general adoption of Bubble-Flux and to exploit a large portion of co-location opportunities found in typical produc-tion environments.
Together, the Dynamic Bubble and Flux Engine com-prise Bubble-Flux, a holistic, scalable, and adaptive solu-tion for precisely managing QoS and maximizing utilizasolu-tion in WSCs. The specific contributions of this work are as follows:
• We design the Dynamic Bubble, a novel technique to
accurately measure the instantaneous QoS sensitiv-ity of a latency-sensitive application online with
lit-tle overhead. The Dynamic Bubble enables the clus-ter scheduler to, in real-time, betclus-ter identify “safe co-locations” to improve utilization.
• We design theOnline Flux Engine, a lightweight
mech-anism to precisely manage the QoS of latency-sensitive applications in the presence of co-locations and ag-gressively improve machine utilization while guaran-teeing QoS. The Flux Engine uses a PiPo mechanism to control and dynamically adjusts the execution rate of batch applications to enforce QoS guarantees. The Flux Engine does not require profiling and is adaptive to phase, input, and load changes.
• We conduct a comprehensive evaluation of
Bubble-Flux using open source WSC applications as well as benchmark applications on real server-grade hardware, demonstrating its effectiveness and advantages over the state-of-art static Bubble-Up approach.
Our results show that the utilization improvement achieved by Bubble-Flux is up to 2.2x better than the state-of-practice Bubble-Up. In addition, Bubble-Flux can achieve significant utilization in cases where Bubble-Up fails to utilize any idle cores.
Next, in Section2 we discuss the background and moti-vation of our work. We then present an overview of Bubble-Flux in Section3. Section4discusses the design of the Dy-namic Bubble. Section 5presents the design of the Online Flux Engine. We present an in-depth evaluation of Flux including comparative analysis with the prior Bubble-Up technique in Section6. We present related work in Sec-tion7, and finally, we conclude in Section8.
2.
BACKGROUND AND MOTIVATION
In this section, we briefly describe the QoS and utilization challenges in modern WSCs. We then discuss the limitations of the-state-of-art static approach for QoS prediction and utilization improvement.
2.1
QoS and Utilization in WSC
Eachweb-service in modern warehouse scale computers is composed of one to hundreds of applicationtasks. Atask is composed of an application binary, associated data, and a configuration file that specifies the machine level resources required, including the number of cores and amount of mem-ory. Task placement is conducted by acluster-level manager
that is responsible for a number of servers. Based on the re-source requirement specified by each task, the cluster man-ager uses an algorithm similar to bin-packing to place each task in a cluster of machines [30].
Multicore servers have become widely adopted in datacen-ters. The cluster manager consolidates multiple disparate applications on a single server to improve the machine uti-lization. However, due to contention for the shared memory resources such as the last level cache and memory band-width, when multiple applications are co-located, significant performance and quality of service (QoS) degradation may occur. User-facing applications such as web search, maps, email and other Internet services arelatency-sensitive, and need to provide satisfactory QoS. To avoid the threat that shared resource contention poses to application QoS, dat-acenter operators and system designers typically disallow co-locations of latency-sensitive jobs with otherbatch jobs.
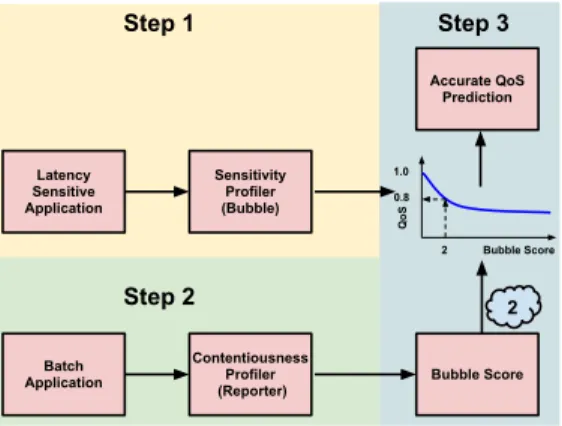
Batch Application Contentiousness Profiler (Reporter) Latency Sensitive Application Sensitivity Profiler (Bubble) Q oS 1.0 0.8 Bubble Score 2 Bubble Score Accurate QoS Prediction Step 1 Step 2 Step 3 2
Figure 1: Bubble-Up Methodology
This unnecessary over-provisioning of compute resources re-duces the overall utilization of WSCs, recently reported to be below 30% on average [28], which translates to low energy efficiency and high total cost of ownership.
2.2
Static Approach and Its Limitations
To address the QoS and utilization challenge, prior work presentsBubble-Up[24,25], a characterization and profil-ing methodology to precisely predict the QoS interference between pairwise application co-locations. Using the pre-cise QoS prediction by Bubble-Up, the cluster scheduler can identify “safe” co-locations, essentially trading a very small QoS degradation for a significant increase in utilization.
2.2.1
Bubble-Up Methodology
Figure1illustrates the Bubble-Up methodology. As shown in the figure, Bubble-Up is composed of three primary steps. In the first step, a latency sensitive application is profiled using a memory subsystem stress test called the “bubble”. The bubble iteratively increases the amount of pressure ap-plied to the memory subsystem with a particular focus on last level cache and memory bandwidth. By measuring the amount of degradation an application suffers at the varying levels of pressure, Bubble-Up generates a QoS sensitivity curve for the application. In the second step, a batch appli-cation is profiled using areporter, whose sensitivity curve is known. By tracing the degradation caused to the reporter to an equivalent bubble size, the system characterizes the con-tentiousness of each batch application, identifying its bubble score. Finally, by mapping the batch application’s bubble score to the sensitivity curve of each latency sensitive ap-plication, Bubble-Up predicts the QoS performance of the latency-sensitive application when co-located. The cluster manager then can rely on the precise prediction to identify batch applications that are safe to run with the latency sen-sitive application without causing much QoS interference.
2.2.2
Limitations of Bubble-Up
Bubble-Up is shown to be effective at generating precise QoS predictions and significantly improving utilization in WSCs. However, there are several primary limitations of the work, including requiring a priori knowledge of appli-cation behavior, the lack of adaptability to changes in ap-plication dynamic behaviors, and being limited to pairwise co-locations. Figure2illustrates a number of scenarios that expose these limitations.
LS B B B B B ? Server 2 1 5 Job Queue A LS Server B C D E Sensitivity Curve Sensitivity Curve Sensitivity Curve La te nc y Se ns iti ve A pp lic ati on L oa d
Figure 2: Limitations of Bubble-Up Methodology
Limitation 1. Requiring a priori knowledge.
Bubble-Up assumes a priori knowledge of applications. When a batch application to be scheduled has not been seen or profiled before, such as shown in Scenario E of Figure2, Bubble-Up will not be able to predict the interference it might cause to latency-sensitive applications, and thus no co-location can happen with a precise QoS guarantee.
Limitation 2. Lack of adaptability.
A critical limitation when using the static Bubble-Up ap-proach in a production datacenter is its lack of adaptivity to the dynamic behaviors of applications. Lack of adaptabil-ity significantly limits the potential utilization improvement opportunities. In addition, it also risks QoS violations when the application behavior is unexpected and differs from its profiled behavior.
An example of dynamic behaviors includes load fluctu-ations of the latency sensitive applicfluctu-ations. Many latency sensitive applications such as Web-search, social networking or email services experience significant load fluctuations [8] typically due to the user behavior patterns. For example, email service often experiences fairly high load at 8AM on Mondays but significantly lower load at 3AM. Figure 2 il-lustrates three example scenarios A, B and C with various load levels. Since Bubble-Up is static, to create conser-vative QoS predictions, profiling must occur at peak load (Scenario A). Bubble-Up is quite effective at producing near optimal utilization while guaranteeing target QoS when the load remains at the peak level. However, when system ex-periences low load (Scenario B), the latency sensitive appli-cation may become less vulnerable to the interference, as illustrated by the rather flat real-time instantaneous sensi-tivity curve shown at Scenario B. When we use the sensitiv-ity curve generated at Scenario A to make QoS prediction at B, our prediction becomes overly conservative. Because the low load period can comprise a significant portion of time [29], the lack of adaptability to exploit the low load co-location opportunities significantly limits the potential utilization improvement. On the other hand, when there is an unexpected load spike such as Scenario C, the sensitiv-ity of latency-sensitive applications may increase. By using the sensitivity curve generated from A for QoS prediction
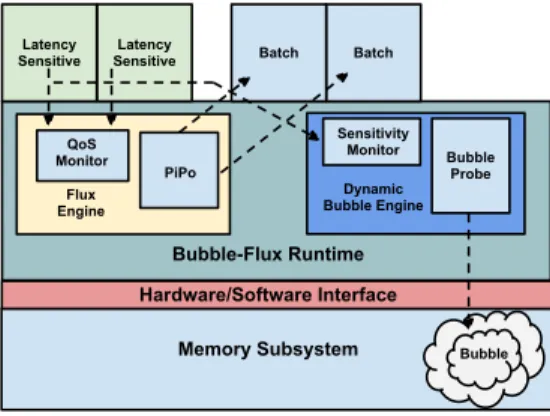
)OX[ (QJLQH '\QDPLF %XEEOH(QJLQH /DWHQF\ 6HQVLWLYH 6HQVLWLYH/DWHQF\ %DWFK %DWFK 3L3R 4R6 0RQLWRU %XEEOH 3UREH 6HQVLWLYLW\ 0RQLWRU %XEEOH)OX[5XQWLPH 0HPRU\6XEV\VWHP %XEEOH +DUGZDUH6RIWZDUH,QWHUIDFH
Figure 3: Bubble-Flux Overview
at C, we risk severely violating the quality of service of that latency sensitive application for a prolonged period.
In addition to load fluctuations, input and phase changes for both latency-sensitive and batch applications may al-ter the latency-sensitive application’s QoS sensitivity or the batch application’s pressure score, effectively skewing Bubble-Up’s prediction.
Limitation 3. Pairwise limitation.
Another key limitation of Bubble-Up is that the predic-tion islimited to addressing pairwise co-locations. When we have already co-located a batch application with our latency-sensitive application, such as in Scenario D, Bubble-Up can-not predict how adding additional batch applications would affect the QoS. As the number of cores increase with every hardware generation, being able to co-locate more than just two applications on a single server becomes more important in WSCs [18].
The combination of the a-priori requirement, the lack of adaptability, and the pairwise limitation significantly affect the applicability of Bubble-Up. In this paper, we argue that a dynamic approach is necessary to address these limita-tions by capturing real-time QoS sensitivity and precisely managing QoS online.
3.
BUBBLE-FLUX OVERVIEW
In this section, we describe the Bubble-Flux runtime sys-tem. Figure3presents the overview of the Bubble-Flux de-sign. The Bubble-Flux Runtime is a user-level daemon that runs on each server. It is composed of two main components: theDynamic Bubble and theOnline Flux Engine.
[Dynamic Bubble] The primary objective of the
Dy-namic Bubble is to conduct online lightweight characteri-zation of the latency sensitive application. Based on the instantaneous QoS sensitivity of the application, it precisely predicts the potential QoS interference due to co-location and thus facilitates the identification of “safe” co-locations to improve utilization. To achieve this, the Dynamic Bub-ble engine spawns a memory bubBub-ble when needed (i.e., a bubble probe), incrementally dialing up its pressure on the memory subsystem and measuring how various levels of pres-sure affect the QoS of the latency sensitive application. To minimize the characterization overhead, the Dynamic Bub-ble runs for a short burst of time, spending a few seconds at each pressure level. The Flux Engine is used to limit
the performance interference generated by the bubble it-self while allowing the bubble probe to generate accurate sensitivity curves (described in detail in Section 4). When the cluster scheduler needs to schedule batch applications, it probes the server with a Dynamic Bubble, retrieving the instantaneous QoS sensitivity curve of the latency-sensitive application running on that server. The sensitivity curve is then used for precise QoS interference prediction, which is used by the scheduler to map batch applications accordingly.
[Online Flux Engine] The Flux Engine uses a
phase-in/phase-out (PiPo) mechanism to dynamically enforce ap-plication QoS requirements. PiPo leverages lightweight on-line QoS monitoring and precise QoS management to adap-tively control the execution of batch applications. As dis-cussed earlier, load fluctuations in addition to other sources of variability can render a previously safe co-location un-safe. In such circumstances, the Flux Engine works to guar-antee the QoS of the latency sensitive application. When a QoS violation is detected by the monitoring component of the Flux Engine, PiPophases out the batch application by rapidly pausing the execution such that satisfactory QoS is preserved. By alternating between resuming batch appli-cations (phasing in) and pausing the appliappli-cations (phasing out), PiPo balances the tradeoffs between the QoS of the latency-sensitive application and the utilization gained by batch applications. Adaptively adjusting the ratio between phase-in and phase-out based on QoS monitoring, PiPo can reach the right level of throttling down to achieve precise QoS guarantees while significantly improving utilization. In the case where we have first-time batch applications for which predictions cannot be made, The Flux Engine can phase in the application gradually and continuously moni-tor their QoS impact. In addition, the Flux Engine is de-signed to manage multiple applications, scaling up beyond pair-wise co-locations. The design of the Flux Engine is de-scribed in detail in Section5.
[Summary]The Dynamic Bubble and Online Flux
En-gine work in a complementary manner. The Flux EnEn-gine provides a safety mechanism against potential QoS misdictions or unexpected dynamic behaviors that render pre-viously correct prediction irrelevant. In addition, when no safe co-location is available, the Flux Engine can be used to further increase utilization by running partially phased-out batch applications. When unknown applications are en-countered and no prediction can be made, the Flux Engine can improve utilization without QoS violations by a gradual phase in. On the other hand, the QoS prediction provided by the Dynamic Bubble facilitates more intelligent co-locations of more compatible applications so that aggressive phase-out can be avoided or minimized.
4.
DYNAMIC BUBBLE
The Dynamic Bubble generates instantaneous QoS sensi-tivity curves of a latency sensitive application online. We utilize a modified version of the bubble from Bubble-Up [24,
25], a carefully designed memory stress kernel that provides knobs to adjust the amount of pressure it applies to the last level cache and memory bandwidth. At runtime, the Dynamic Bubble engine inserts a bubble and gradually di-als up its pressure. As we expand the bubble, we measure the QoS impact it has on the latency sensitive application, generating the sensitivity curve.
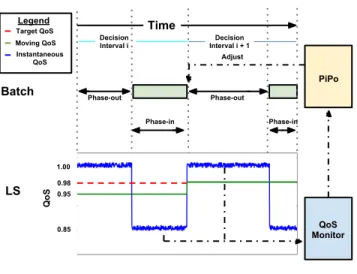
3KDVHLQ 3KDVHRXW 3KDVHRXW 7LPH %DWFK /6 /HJHQG 7DUJHW4R6 0RYLQJ4R6 ,QVWDQWDQHRXV 4R6 3L3R 4R6 0RQLWRU 3KDVHLQ $GMXVW 'HFLVLRQ ,QWHUYDOL ,QWHUYDOL'HFLVLRQ 4 R6
Figure 4: Online Flux Engine
In contrast to the profiling environment for Bubble-Up, the main challenge for the Dynamic Bubble is to provide ac-curate sensitivity curve measurements with minimum run-time overhead and interference. To minimize overhead, we first execute the bubble for a short burst (250ms) at each pressure score in succession. However, due to short sam-pling periods and the limited amount of samsam-pling at each pressure level, such measurement can be much noisier than static Bubble-Up, which can afford to have a longer sampling window due to its offline nature. Also, it is challenging to dial up the bubble to generate a complete sensitivity curve without violating the QoS threshold of a latency-sensitive application. Therefore, to control the potential overhead and to avoid the interference, our design relies on the Flux Engine to manage the Dynamic Bubble’s execution. This allows us to extend our sampling period to 2 seconds per pressure score for a more stable QoS degradation measure-ment without the risk of a very aggressive bubble violating the QoS threshold of a latency-sensitive application. When the Flux Engine detects a QoS degradation during the bub-ble measurement, it uses PiPo to automatically phases out part of the bubble execution. Phase-in/phase-out does not affect the measurement of the QoS degradation. We use the average difference between the latency sensitive application’s QoS during the bubble phase-out period and its QoS during the bubble phase-in period to estimate the QoS degradation caused by the bubble. Using this measurement technique, we can generate a more complete and accurate sensitivity curve with more aggressive bubble. The details of this mea-surement technique are described in the following section.
5.
ONLINE FLUX ENGINE
The Online Flux Engine provides precise online QoS man-agement. The Flux Engine adaptively controls the execu-tion of the batch applicaexecu-tions to mitigate the interference they cause to the co-running latency-sensitive application to deliver satisfactory QoS while improving utilization. The execution-control strategy is determined and adjusted dy-namically based on the diagnosis of the amount of interfer-ence suffered by the latency sensitive application.
The Flux Engine decides the execution control strategy periodically throughout execution. Every decision interval
consists of aphase-in interval, where the batch applications execute in a normal fashion, and aphase-outinterval, where batch applications’ executions are paused. We call this tech-niquephase-in/phase-out(PiPo). PiPo adjusts the ratio be-tweenphase-in andphase-out every decision interval based on the estimated QoS degradation that batch applications caused to the latency-sensitive application during the most recent period.
Figure4illustrates the feedback control in the Flux En-gine and depicts two example PiPo decision intervals,iand
i+ 1. At the beginning of intervali, the Flux Engine decides the phase-in/phase-out ratio for a batch application and dic-tates its execution accordingly. During the execution, the
QoS monitor records the QoS of the latency-sensitive ap-plication (LS) during both phase-in and phase-out intervals of the batch application, QoSpi and QoSpo, respectively. Because the batch application’s execution is temporarily paused during phase-out, QoSpo of LS is close to the 100%
QoS without interference, as shown in Figure4. TheQoSpi
by comparison is relatively low due the interference when the batch resumes execution during phase-in. As a consequence, the average QoS during intervaliis below the QoS target, shown as the red dotted line. At the end of the intervali, the Flux Engine acquires the monitored QoS information from
QoS monitor, and adjusts the new phase-out ratio for the next interval,i+ 1. In this illustrated example, because the average QoS for decision intervaliis below a threshold, the Flux Engine increases the phase-out ratio for intervali+ 1. By closely monitoring QoS and adaptation, we achieve pre-cise QoS management while maximizing utilization.
The QoS monitor uses hardware performance counters for sampling. In this paper, we use instruction per cycle (IPC) as a proxy for an application’s QoS. We observed that for our applications, IPC was highly correlated with other application-specific metrics such as average query latency. This is consistent with the industry practice of profiling IPC for performance monitoring and QoS estimation in the pro-duction fleet using monitoring services such as Google Wide Profiling [33].
Since data center applications often have threads that spawn and die as part of their execution, such as Hadoop, the Flux Engine contains a Thread State Monitor, which is a status daemon that stores the process and thread IDs of the active threads on the system. When the daemon wakes up, it updates the table by deleting the metadata of terminated threads and adding the TIDs of threads that have spawned since the previous iteration of its core loop. By using this approach, we can guarantee that we can reliably control all latency-sensitive applications and batch application threads. To control the execution of batch applications, PiPo sends a SIGSTOP signal to pause batch applications and aSIGCONT signal to resume their execution.
The core algorithm for the Flux Engine is presented in Al-gorithm1. As shown in Algorithm1, the Flux Engine con-trols the execution of batch application by pausing their exe-cution for a short interval: phaseOut Ratioi∗phase window.
In our experimentation, we set thephase windowto be 250 ms. During each decision interval, the Flux Engine calls the
update phaseIn ratio() function to decide the next inter-val’s phase-out ratio based on the average IPCs of latency-sensitive application when the batch applications execute during phase-in (IP Cipi) and when the batch applications sleep during phase-out(IP Cipo). To determine the average
Algorithm 1:Flux Engine
Input: ALSa latency sensitive application,
Ba set of batch applications,
QoStargetthe target QoS value
1 i= 0
2 phaseIn Ratioi= 0.5
3 phaseOut Ratioi= 0.5
4 phase window= 250ms
5 whileALS.isAlive()do
6 phaseOut interval=phaseOut Ratioi∗phase window;
7 Phase out batch applications inBforphaseOut interval
ms;
8 IP Cpi
i =measureALSIPC(phaseOut interval); /* Measure the latency sensitive application’s IPC
during the B’s Phase-Out period */
9 End Phase-out period for all batch applications;
10 phaseIn interval=phaseIn Ratioi∗phase window;
11 Phase in batch applications inBforphaseIn intervalms;
12 IP Cpo
i =measureALSIPC(phaseIn interval);
13 End phase-in period for all batch applications;
14 phaseIn Ratioi+1=
update ratio(phaseIn Ratioi, IP Cipo, IP C
pi
i , QoStarget);
/* Update the Phase-in/Phase-out Ratio based on the monitored IPC */;
15 phaseOut Ratioi+1= 1−phaseIn Ratioi+1;
16 i+ = 1;
17 end
QoS for a latency sensitive application during the intervali, we utilize following equation:
QoSi=
phaseInRatioi∗IP Cipi+phaseOutRatioi∗IP Cipo
IP Cipo
(1) Using the QoS estimation calculated by Equation1, we up-date the next iteration’s phase-in ratio using the following equation:
phaseInRatiopii+1=phaseInRatio pi
i +
QoStarget−QoSi
QoStarget
(2) where QoStarget is the targeted threshold where the QoS
of the latency-sensitive application is deemed satisfactory. By taking this approach, PiPo consistently anneals to the correct QoS value and is neither overly aggressive nor overly conservative.
6.
EVALUATION
[Setup and Methodology]We conduct our experiments
on a 2.2Ghz dual-socket Intel Xeon E5-2660 (Sandy bridge) with 8 cores and 32GB of DRAM per socket. Each core has a 32KB L1 private instruction cache, a 32KB L1 private data cache, a 256 KB L2 cache, and each socket has a shared 20MB L3 cache. The OS is Ubuntu with linux kernel version 3.2.0-29.
Our workloads are shown in Table 1. We use a number of applications from CloudSuite [15] includingWeb-search and Data-serving (Cassandra) to represent our latency-sensitive applications and a mix of SPEC CPU2006 bench-marks and CloudSuite’s Data-analytics, a Hadoop-based benchmark, to represent our batch applications.
6.1
Effectiveness Without A Priori Knowledge
We first evaluate the effectiveness of Bubble-Flux for en-forcing targeted QoS without prior knowledge of
applica-with Bubble−Flux targeting 98% QoS
0.8x 0.82x 0.84x 0.86x 0.88x 0.9x 0.92x 0.94x 0.96x 0.98x 1x milc lbm libquant soplex mcf sphinx d−analytics Normalized QoS without Bubble−Flux with Bubble−Flux targeting 95% QoS
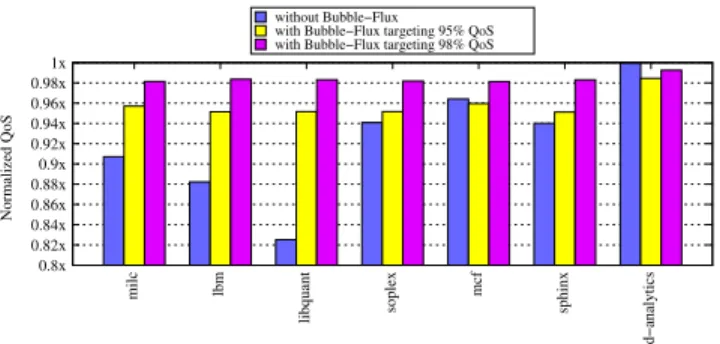
Figure 5: Web-search - Normalized QoS when
co-running with batch applications shown on the X-axis
0.65x 0.7x 0.75x 0.8x 0.85x 0.9x 0.95x 1x milc lbm libquant soplex mcf sphinx d−analytics Normalized QoS 0.6x without Bubble−Flux with Bubble−Flux targeting 95% QoS with Bubble−Flux targeting 98% QoS
Figure 6: Data-serving- Normalized QoS when
co-running with batch applications shown on the X-axis
0.8x 0.9x 1x milc lbm libquant soplex mcf sphinx d−analytics Normalized QoS without Bubble−Flux with Bubble−Flux targeting 95% QoS with Bubble−Flux targeting 98% QoS
0.4x 0.5x 0.6x 0.7x
Figure 7: Media-streaming - Normalized QoS when
co-running with batch applications shown on the X-axis
tions or profiling. In these experiments, the Flux Engine achieves precise QoS management, meeting 95% and 98% normalized QoS targets with 1-2% precision. Meanwhile, the Flux Engine also provides significant gains in utilization even in the absence of a QoS prediction provided by the Dynamic Bubble.
Figures 5, 6 and 7 present the normalized QoS of Web-search, Data-serving and Media-streaming respectively, when each of them co-runs with a series of batch applica-tions shown on the X-axis. In this experiment, the latency-sensitive application occupies 4 cores on an 8 core chip. Each SPEC benchmark executes 4 instances on the remaining 4 cores. Data-analytics, which is a multi-threaded Hadoop benchmark, runs on the remaining 4 cores as a batch
ap-Table 1: Workloads
Benchmark Set up Type
Web-search Open source Nutch v1.2 [19], Tomcat v7.0.6.23 and Faban. 30 GB index and segments, all of index terms cached in 32 GB main memory
latency-sensitive Data-serving NoSQL data storage software for massive amount of data. Cassandra
0.7.3 [3] with 50 GB Yahoo! Cloud Serving Benchmark (YCSB) [9] dataset
latency-sensitive
Media-streaming Darwin Streaming Server for video content. Faban load generator [4] latency-sensitive Data-analytics MapReduce framework to perform machine learning analysis on
large-scale dataset. We use Hadoop 0.20.2 [1], running the Bayesian classifi-cation algorithm in the Mahout 0.4 library [2] on 1GB set of Wikipedia pages
batch
SPEC CPU2006 milc, lbm, libquantum, soplex, mcf, sphinx batch
100% milc lbm libquant soplex mcf sphinx d−analytics Gained Utilization
with Bubble−Flux targeting 95% QoS with Bubble−Flux targeting 98% QoS
0% 20% 40% 60% 80%
Figure 8: Gained utilization of benchmarks (shown
on the X-axis) when co-running withWeb-search
us-ing Bubble-Flux 100% milc lbm libquant soplex mcf sphinx d−analytics Gained Utilization
with Bubble−Flux targeting 95% QoS with Bubble−Flux targeting 98% QoS
0% 20% 40% 60% 80%
Figure 9: Gained utilization of benchmarks (shown
on the X-axis) when co-running with Data-serving
using Bubble-Flux
plication. For each cluster of bars, the first bar presents the normalized QoS of a latency-sensitive application when co-running with the batch application without Bubble-Flux. The second bar shows the QoS Bubble-Flux achieves when it targets at 95% QoS for the latency-sensitive application; and the third bar with the 98% QoS target. These figures demonstrate that even without a priori knowledge, Bubble-Flux can effectively achieve the QoS target with impressive precision. The average QoS of Web-search with the Flux Engine is 95.8% when Flux targets 95% QoS, and 98.4% when the target is 98%, with 1% and 0.3% standard de-viation respectively. Similarly for both Data-servingand Media-streaming, the achieved average QoS is around 1% above the target with less than 1% standard deviation.
Figures 8, 9and 10present the utilization Bubble-Flux
100% milc lbm libquant soplex mcf sphinx d−analytics Gained Utilization
with Bubble−Flux targeting 95% QoS with Bubble−Flux targeting 98% QoS
0% 20% 40% 60% 80%
Figure 10: Gained utilization of benchmarks (shown
on the X-axis) when co-running withMedia-streaming
using Bubble-Flux 0.85 0.9 0.95 1 1.05 0 50 100 150 200 250 300 350 400 450 500 Normalized QoS time
Bubble-Flux targeting 95% QoS Bubble-Flux targeting 98% QoS
Figure 11: Web-search’s normalized QoS when
co-located with libquantum
achieves for cores on which batch applications are executing while guaranteeing the QoS as shown in Figures 5, 6 and
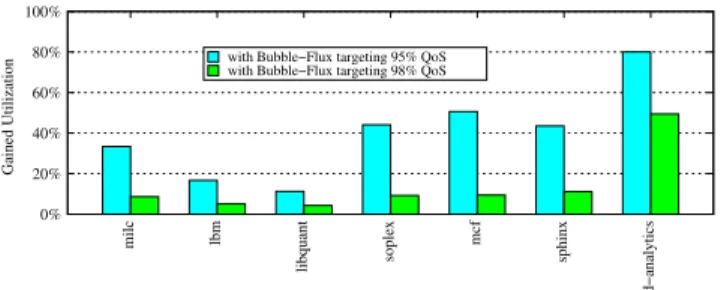
7. For example, 42% utilization when mcfis running with Web-searchwhile Bubble-Flux targets at 98% QoS indicates four instances ofmcfrun at 42% rate on 4 cores in order to enforce the QoS target forWeb-search.
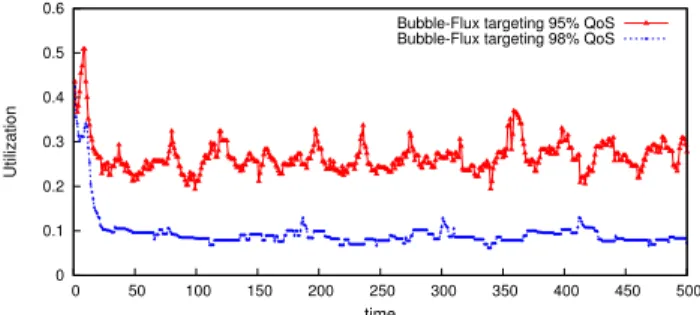
Figure 11 presents Web-search’s normalized QoS when co-running withlibquantumand the Bubble-Flux targets at 95% and 98% QoS respectively. The X-axis shows time. Fig-ure12presents the corresponding utilization forlibquantum achieved by Bubble-Flux. Figures 11and 12demonstrate that the Online Flux Engine consistently enforces high QoS in the presence of libquantum’s phases. It is particularly challenging to enforce the QoS when a latency-sensitive ap-plication is co-running with libquantum because
0 0.1 0.2 0.3 0.4 0.5 0.6 0 50 100 150 200 250 300 350 400 450 500 Utilization time
Bubble-Flux targeting 95% QoS Bubble-Flux targeting 98% QoS
Figure 12: Gained utilization of libquantum
(Web-search is the co-running latency-sensitive applica-tion)
tumis very contentious, generating 18% degradation without Bubble-Flux, as shown in Figure5. Note that prior work, the Bubble-Up approach, would perdict the 18% degrada-tion and determine that we could not co-locate libquan-tumwithWeb-search, gaining no utilization. However, the Flux Engine is able to yield an additional 30% utilization, as shown in Figure12, while still guaranteeing an average QoS above 95%. If more stringent requirements on QoS are nec-essary such as 98%, the Online Flux Engine can still deliver around 10% utilization on each of the four cores (Figure12). As Figure 11shows, at the 98% QoS target, the Online Flux Engine achieves very stable QoS, almost always above 96% of the baseline.
6.2
Capture and Adapt to Load Fluctuation
In this section, we evaluate Bubble-Flux’s effectiveness for adapting to the load fluctuations of latency-sensitive appli-cations and providing more utilization when the load is low.
[Adapt to Load Fluctuation]Figures 13and14present
Bubble-Flux’s effectiveness whenWeb-search’s load fluctu-ates. We conduct separate experiments with varying load levels that users generate, including 520, 450, 240 and 140 queries per second (QPS). We observe that as the load drops, the sensitivity ofWeb-searchto contention drops drastically. The Online Flux Engine dynamically detects this change and is able to increase the ratio that batch applications are phased in. As a result, in both scenarios of the 95% and 98% QoS targets, the Flux Engine approximately doubles the utilization across all batch applications when load drops from 520 QPS to 140 QPS. Meanwhile, the Flux Engine is able to achieve a QoS that is consistently within 0 to 2% above the targeted QoS of 95%, as shown in Figure 13, and 98%, as shown in Figure 14.
[Instantaneous sensitivity curve generation] In
dition to the capability of adapting to load changes by ad-justing the batch applications’ machine utilization over time, Bubble-Flux is simultaneously capable of capturing the la-tency sensitive application’s varying instantaneous QoS sen-sitivity to interference at different levels of load, which ex-poses more co-location opportunities to the cluster sched-uler.
Figures 15, 16, and 17 presents three sensitivity curves generated by the Dynamic Bubble when the load to Web-searchranges from 520 QPS to 140 QPS. The Y-axis shows the Bubble score, corresponding to bubble sizes from 5MB to 55MB with a step size of 5MB. These sensitivity curves demonstrate thatWeb-searchis quite sensitive to contention
80% milc lbm libquant soplex Utilization 520 queries/second 450 queries/second 240 queries/second 140 queries/second 0% 10% 20% 30% 40% 50% 60% 70%
Figure 13: Utilization achieved by Bubble-Flux
when targeting 95% QoS of Web-search with
vary-ing load levels
80% milc lbm libquant soplex Utilization 520 queries/second 450 queries/second 240 queries/second 140 queries/second 0% 10% 20% 30% 40% 50% 60% 70%
Figure 14: Utilization achieved by Bubble-Flux
when targeting 98% QoS of Web-search with
vary-ing load levels
0.75 0.8 0.85 0.9 0.95 1 0 2 4 6 8 10 Performance (norm.) Pressure (MB) 520 QPS
Figure 15: Sensitivity curve at520 QPS
0.75 0.8 0.85 0.9 0.95 1 0 2 4 6 8 10 Performance (norm.) Pressure (MB) 240 QPS
Figure 16: Sensitivity curve at240 QPS
0.75 0.8 0.85 0.9 0.95 1 0 2 4 6 8 10 Performance (norm.) Pressure (MB) 140 QPS
0.98x 1x
WL1 WL2 WL3
Normalized QoS
without Bubble−Flux with Bubble−Flux targeting 95% QoS with Bubble−Flux targeting 98% QoS
0.8x 0.82x 0.84x 0.86x 0.88x 0.9x 0.92x 0.94x 0.96x
Figure 18: Web-search - Normalized QoS when
co-running with workloads shown on the X-axis
when it is running at a high load (520 QPS), suffering a 20% QoS degradation at bubble score 5 (size 25MB) and higher. In addition, it is particularly sensitive to the bandwidth con-tention compared to cache concon-tention, as indicated by the sharp QoS drop when the bubble size increases from 20 MB (LLC size) to 25 MB. However,Web-searchat 240 QPS and 140 QPS is not as sensitive to interference, as illustrated by rather flat sensitivity curves, suffering 10% and 7% maxi-mum degradation when the bubble size is around 45 MB. Precisely capturing the sensitivity curve in production at runtime exposes more co-location opportunities to further improve the utilization. For example, at 520 QPS, a batch application needs to have a bubble size 20MB and less to be able to co-locate withWeb-searchand provide 90% QoS. However, at 140 QPS, most batch applications can be safely co-located withWeb-searchwithout generating beyond 10% degradation.
6.3
Scalability beyond Pairwise
Another advantage of Flux over the static Bubble-Up is Bubble-Flux’s capability to scale up beyond pairwise co-locations and provide precise QoS when multiple, differ-ent batch applications are co-running.
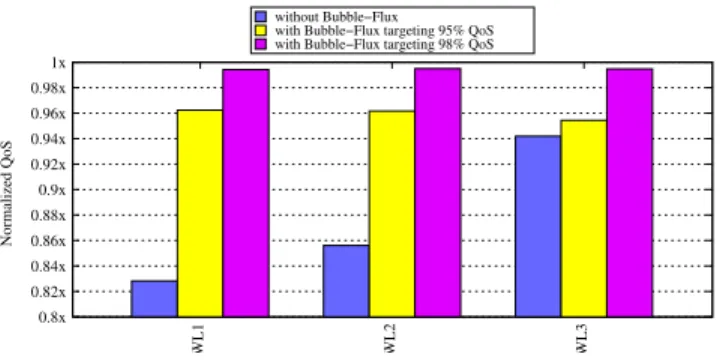
Figures18,19and20present the normalized QoS of Web-search,Data-servingand Media-streamingwhen each is running with a varying set of workloads shown in Table2. We observe that as before, the Online Flux Engine is partic-ularly effective at maintaining the QoS at the target level, although the gap between the QoS target and the achieved QoS increases slightly, from +0.3% to 1% with four of a single batch application (Figures5to 7) to +1.0% to 1.6% with four mixed applications (Figures18to20). Figures21,
22and23present the corresponding utilization. Workloads 1, 2 and 3 are composed of four of the top six most con-tentious SPEC CPU2006 benchmarks. We observe that for the 95% QoS threshold, the utilization gains are similar to the average utilization gain when each benchmark of the mixed workload co-runs with the latency-sensitive applica-tion. However, with 98% QoS target, the utilization gains are approximately 50% of the utilization achieved when the workload is composed of batch applications of the same benchmark type. This is due to the stacking of phases and the reactive nature of the Flux Engine. If one benchmark has a spike in contentiousness, all other benchmarks are ag-gressively phased out. With greater variety in benchmarks, the occurrence of such events increases.
with Bubble−Flux targeting 95% QoS with Bubble−Flux targeting 98% QoS
0.4x 0.5x 0.6x 0.7x 0.8x 0.9x 1x WL1 WL2 WL3 Normalized QoS without Bubble−Flux
Figure 19: Data-serving- Normalized QoS when
co-running with workloads shown on the X-axis with Bubble−Flux targeting 95% QoS
with Bubble−Flux targeting 98% QoS
0.4x 0.5x 0.6x 0.7x 0.8x 0.9x 1x WL1 WL2 WL3 Normalized QoS without Bubble−Flux
Figure 20: Media-streaming - Normalized QoS when
co-running with workloads shown on the X-axis
6.4
Applying Bubble-Flux in a WSC
In this section, we conduct experiments to apply Flux in real-world datacenter scenarios and compare Bubble-Flux with the state-of-the-art Bubble-Up.
Scenario 1: The datacenter is composed of 1000
ma-chines, 500 machines for Web-search, and the other 500 forData-serving. Each machine is loaded with a latency-sensitive application occupying 4 cores, leaving the rest of 4 cores idle. The batch workloads are composed of 1000 appli-cations, each composed of 4 instances of a batch application evenly selected from 7 types, including 6 SPEC benchmarks andData-analyticsshown in Table1, ready to be mapped. The QoS threshold for each latency-sensitive application is 95% and 98%.
Scenario 2: The datacenter is composed of 1500
ma-chines, 500 machines forWeb-search, 500 forData-serving and 500 for Media-streamingand 1500 batch applications evenly selected from the 7 types in Table1.
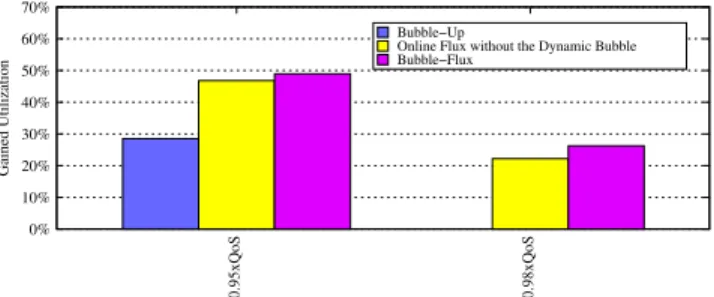
Figures24and25illustrate the utilization gains for Sce-narios 1 and 2 by applying Bubble-Up, the Online Flux En-gine alone, and Bubble-Flux, targeting at 95% and 98% QoS. For those two scenarios, all techniques have a comparably precise QoS guarantee, above 95% and 98% respectively. We observe that in Scenario 1, the Online Flux Engine yields sig-nificantly higher utilization than the Bubble-Up approach, as shown in Figure 24. At the 95% QoS target, the Flux Engine achieves 49.66% utilization per core on average for the 2000 (500x4) previously idle cores while Bubble-Up only generates 27% utilization gain. At the 98% QoS threshold, Bubble-Up’s prediction indicates that among all batch work-loads, there are no “safe” co-locaions available, thus yielding a 0% utilization for those 2000 cores. The Flux Engine on
Table 2: Batch Workloads WL1 lbm, lbm, libquantum, libquantum WL2 lbm, libquantum,soplex, milc WL3 mcf, mcf, sphinx, soplex 50% 60% 70% 80% WL1 WL2 WL3 Gained Utilization 95% QoS 98% QoS 0% 10% 20% 30% 40%
Figure 21: Gained utilization by
Bubble-Flux when each workload
is co-located withWeb-search
60% 70% 80% WL1 WL2 WL3 Gained Utilization 95% QoS 98% QoS 0% 10% 20% 30% 40% 50%
Figure 22: Gained utilization by Bubble-Flux when each workload
is co-located with Data-serving
60% 70% 80% WL1 WL2 WL3 Gained Utilization 95% QoS 98% QoS 0% 10% 20% 30% 40% 50%
Figure 23: Gain utilization by
Bubble-Flux when each workload
is co-located with Media-streaming
50% 60% 70% 0.95xQoS 0.98xQoS Gained Utilization Bubble−Up
Online Flux without the Dynamic Bubble Bubble−Flux 0% 10% 20% 30% 40%
Figure 24: Scenario 1. Gained Utilization achieved by Bubble-Up, the Flux Engine and Bubble-Flux (Web-search and Data-serving are latency-sensitive applications). 50% 60% 70% 0.95xQoS 0.98xQoS Gained Utilization Bubble−Up
Online Flux without the Dynamic Bubble Bubble−Flux 0% 10% 20% 30% 40%
Figure 25: Scenario 2. Gained Utilization achieved by Bubble-Up, the Flux Engine and Bubble-Flux (Web-search, Data-serving and Media-streaming are latency-sensitive applications).
the other hand, still provides 24.09% average utilization. In addition, Bubble-Flux provides even more utilization im-provement over the Flux Engine. At the 95% QoS thresh-old, Bubble-Flux increases utilization by 62.6%, and 36.9% at 98% QoS threshold.
The main advantage of Bubble-Flux over the Flux Engine alone is the QoS prediction provided by the Dynamic Bub-ble. With precise prediction, the cluster scheduler can map more contentious applications to the latency-sensitive appli-cations that generate less predicted QoS degradation. For example, in this scenario, the cluster-scheduler based on the Dynamic Bubble’s prediction maps top contentious bench-marks such aslbmandlibquantumtoWeb-searchinstead of Data-serving, which is more sensitive to contention. With intelligent mapping facilitated by the Dynamic Bubble’s QoS prediction, utilization achieved by the Flux Engine is greatly improved. Scenario 2 has similar results. However, the ad-ditional improvement provided by the Dynamic Bubble over the Flux Engine is not as obvious in this case. This is due to the fact thatData-servingandMedia-streaminghave sim-ilar sensitivity to contention and interference, so the random mapping without the prediction can achieve similar results as an intelligent mapping.
In conclusion, our results show that Bubble-Up has diffi-culty co-locating moderately contentious batch applications
with latency-sensitive applications without violating their QoS guarantees. In contrast, the utilization achieved by Bubble-Flux is up to 2.2x better than the state-of-practice Up (62% vs. 27% utilization). In addition, Bubble-Flux can achieve significant utilization when Bubble-Up fails to utilize any idle cores (24% vs. 0% utilization). These results demonstrate that Bubble-Flux is effective at signifi-cantly improving utilization while precisely guaranteeing the QoS of latency-sensitive applications.
7.
RELATED WORK
There has been significant research into mitigating mem-ory resource contention to improve the performance, fair-ness and QoS. The closest related work is Bubble-Up [25], which uses static methods such as profiling to predict per-formance interference and QoS degradation to identify “safe” colocations and improve utilization in datacenters. In this work, we present the Dynamic Bubble mechanism to predict performance degradation on the fly and the Flux Engine to enforce QoS once a co-location has been selected. Be-cause the Dynamic Bubble operates online, it can capitalize on variations in application sensitivity due to load fluctua-tions to increase utilization. Scheduling techniques for QoS management are proposed for both CMPs [14,17,21,38,42] and SMT architectures [13,35]. Other OS mechanisms such
as page-coloring are also proposed [23]. Besides OS solu-tions, compiler-based approaches and runtime systems are presented and evaluated [7,34,36,37,39]. Hardware tech-niques including cache partitioning have been explored to decrease inter-application contention [12,16,20,23,31,32]. In addition to mitigating contention, there has been work on detecting and measuring contention both in single servers and large scale systems [10,11,18,22,26,41]. Vasic et al. present the DejaVu system, which utilizes an online cluster-ing algorithm paired with a lookup table of virtual machine signatures to adapt to load variations [40]. In addition, a growing number of research projects now employ AI tech-niques for cluster level management, increasing utilization, and reducing resource conflicts [11,22].
8.
CONCLUSION
In conclusion, we present an effective solution for sig-nificantly increasing utilization while simultaneously pre-cisely guaranteeing QoS. Our approach is more robust than the prior Bubble-Up work, which, similar to all static ap-proaches, is unable to adapt when the profile data diverges from the actual runtime application behavior. By designing an approach that exhibits greater generality than Bubble-Up, our solution is viable in a larger number of data center environments and can gracefully adapt to runtime scenarios where its initial predictions are violated.
In addition, by combining the Online Flux Engine with the Dynamic Bubble, we are able to not only increase WSC utilization in the general cases but to do so even in an adver-sarial application environment where the latency-sensitive applications are highly sensitive and batch applications are particularly contentious. In these cases, we are able to cap-italize on a previously missed opportunity and increase uti-lization by 10 to 90%, while strictly enforcing a range of QoS targets.
9.
REFERENCES
[1] Apache hadoop. http://hadoop.apache.org. [2] Apache mahout: scalable machine-learning and
data-mining library. http://mahout.apache.org/. [3] Cassandra. http://cassandra.apache.org. [4] Faban harness and benchmark framework.
http://java.net/projects/faban/.
[5] L. Barroso and U. H¨olzle. The datacenter as a computer: An introduction to the design of warehouse-scale machines.Synthesis Lectures on Computer Architecture, 4(1):1–108, 2009. [6] L. A. Barroso and U. H¨olzle. The case for
energy-proportional computing.Computer, 40(12):33–37, Dec. 2007.
[7] B. Bin and C. Ding. Defensive loop tiling for shared cache. InProceedings of the Tenth International Symposium on Code Generation and Optimization, CGO ’13.
[8] J. S. Chase, D. C. Anderson, P. N. Thakar, A. M. Vahdat, and R. P. Doyle. Managing energy and server resources in hosting centers.SIGOPS Oper. Syst. Rev., 35(5):103–116, Oct. 2001.
[9] B. F. Cooper, A. Silberstein, E. Tam,
R. Ramakrishnan, and R. Sears. Benchmarking cloud serving systems with ycsb. InProceedings of the 1st ACM symposium on Cloud computing, SoCC ’10, pages 143–154, New York, NY, USA, 2010. ACM.
[10] C. Delimitrou and C. Kozyrakis. Paragon: Qos-aware scheduling for heterogeneous datacenters. In
Proceedings of the eighteenth international conference on Architectural support for programming languages and operating systems, ASPLOS ’13, pages 77–88, New York, NY, USA, 2013. ACM.
[11] T. Dwyer, A. Fedorova, S. Blagodurov, M. Roth, F. Gaud, and J. Pei. A practical method for estimating performance degradation on multicore processors, and its application to hpc workloads. In
Proceedings of the International Conference on High Performance Computing, Networking, Storage and Analysis, SC ’12, pages 83:1–83:11, Los Alamitos, CA, USA, 2012. IEEE Computer Society Press.
[12] E. Ebrahimi, C. Lee, O. Mutlu, and Y. Patt. Fairness via source throttling: a configurable and
high-performance fairness substrate for multi-core memory systems.ASPLOS 2010, Mar 2010. [13] S. Eyerman and L. Eeckhout. Probabilistic job
symbiosis modeling for smt processor scheduling.
ASPLOS ’10: Proceedings of the fifteenth edition of ASPLOS on Architectural support for programming languages and operating systems, Mar 2010. [14] A. Fedorova, M. Seltzer, and M. Smith. Improving
performance isolation on chip multiprocessors via an operating system scheduler.PACT 2007, Sep 2007. [15] M. Ferdman, A. Adileh, O. Kocberber, S. Volos,
M. Alisafaee, D. Jevdjic, C. Kaynak, A. D. Popescu, A. Ailamaki, and B. Falsafi. Clearing the clouds: a study of emerging scale-out workloads on modern hardware. InProceedings of the seventeenth
international conference on Architectural Support for Programming Languages and Operating Systems, ASPLOS ’12, pages 37–48, New York, NY, USA, 2012. ACM.
[16] F. Guo, Y. Solihin, L. Zhao, and R. Iyer. A framework for providing quality of service in chip
multi-processors. InProceedings of the 40th Annual IEEE/ACM International Symposium on
Microarchitecture, MICRO 40, pages 343–355,
Washington, DC, USA, 2007. IEEE Computer Society. [17] Y. Jiang, K. Tian, and X. Shen. Combining locality
analysis with online proactive job co-scheduling in chip multiprocessors.High Performance Embedded Architectures and Compilers, pages 201–215, 2010. [18] M. Kambadur, T. Moseley, R. Hank, and M. A. Kim.
Measuring interference between live datacenter applications. InProceedings of the International Conference on High Performance Computing, Networking, Storage and Analysis, SC ’12, pages 51:1–51:12, Los Alamitos, CA, USA, 2012. IEEE Computer Society Press.
[19] R. Khare and D. Cutting. Nutch: A flexible and scalable open-source web search engine. Technical report, 2004.
[20] S. Kim, D. Chandra, and Y. Solihin. Fair cache sharing and partitioning in a chip multiprocessor architecture.PACT 2004, Sep 2004.
[21] R. Knauerhase, P. Brett, B. Hohlt, T. Li, and S. Hahn. Using os observations to improve performance in multicore systems.IEEE Micro, 28(3):54–66, 2008.
[22] S.-H. Lim, J.-S. Huh, Y. Kim, G. M. Shipman, and C. R. Das. D-factor: a quantitative model of application slow-down in multi-resource shared systems. InProceedings of the 12th ACM
SIGMETRICS/PERFORMANCE joint international conference on Measurement and Modeling of
Computer Systems, SIGMETRICS ’12, pages 271–282, New York, NY, USA, 2012. ACM.
[23] J. Lin, Q. Lu, X. Ding, Z. Zhang, X. Zhang, and P. Sadayappan. Gaining insights into multicore cache partitioning: Bridging the gap between simulation and real systems.HPCA 2008, pages 367–378, 2008. [24] J. Mars, L. Tang, R. Hundt, K. Skadron, and M. L.
Soffa. Increasing utilization in warehouse scale computers using bubbleup! IEEE Micro.
[25] J. Mars, L. Tang, R. Hundt, K. Skadron, and M. L. Soffa. Bubble-up: Increasing utilization in modern warehouse scale computers via sensible co-locations. In
MICRO ’11: Proceedings of The 44th Annual IEEE/ACM International Symposium on
Microarchitecture, New York, NY, USA, 2011. ACM. [26] J. Mars, N. Vachharajani, R. Hundt, and M. Soffa.
Contention aware execution: online contention detection and response.CGO ’10: Proceedings of the 8th annual IEEE/ACM international symposium on Code generation and optimization, Apr 2010. [27] R. McMillan. Data center servers suck - but nobody
knows how much. October, 2012.
[28] D. Meisner, B. Gold, and T. Wenisch. Powernap: eliminating server idle power.ASPLOS ’09: Proceeding of the 14th international conference on Architectural support for programming languages and operating systems, Feb 2009.
[29] D. Meisner, C. M. Sadler, L. A. Barroso, W.-D. Weber, and T. F. Wenisch. Power management of online data-intensive services. InProceedings of the 38th annual international symposium on Computer architecture, ISCA ’11, pages 319–330, New York, NY, USA, 2011. ACM.
[30] A. Mishra, J. Hellerstein, W. Cirne, and C. Das. Towards characterizing cloud backend workloads: insights from google compute clusters.ACM SIGMETRICS Performance Evaluation Review, 37(4):34–41, 2010.
[31] M. Moreto, F. Cazorla, A. Ramirez, R. Sakellariou, and M. Valero. Flexdcp: a qos framework for cmp architectures.SIGOPS Operating Systems Review, 43(2), Apr 2009.
[32] M. K. Qureshi and Y. N. Patt. Utility-based cache partitioning: A low-overhead, high-performance,
runtime mechanism to partition shared caches. In
Proceedings of the 39th Annual IEEE/ACM International Symposium on Microarchitecture, MICRO 39, pages 423–432, Washington, DC, USA, 2006. IEEE Computer Society.
[33] G. Ren, E. Tune, T. Moseley, Y. Shi, S. Rus, and R. Hundt. Google-wide profiling: A continuous profiling infrastructure for data centers.IEEE Micro, pages 65–79, 2010.
[34] S. Rus, R. Ashok, and D. Li. Automated locality optimization based on the reuse distance of string operations. CGO ’11, pages 181 –190, Apr 2011. [35] A. Snavely and D. Tullsen. Symbiotic jobscheduling
for a simultaneous multithreaded processor.
ASPLOS-IX: Proceedings of the ninth international conference on Architectural support for programming languages and operating systems, Dec 2000.
[36] S. Son, M. Kandemir, M. Karakoy, and
D. Chakrabarti. A compiler-directed data prefetching scheme for chip multiprocessors.PPoPP 2009, Feb 2009.
[37] L. Tang, J. Mars, and M. L. Soffa. Compiling for niceness: mitigating contention for qos in warehouse scale computers. InProceedings of the Tenth International Symposium on Code Generation and Optimization, CGO ’12, pages 1–12, New York, NY, USA, 2012. ACM.
[38] L. Tang, J. Mars, N. Vachharajani, R. Hundt, and M. L. Soffa. The impact of memory subsystem resource sharing on datacenter applications. pages 283–294, 2011.
[39] L. Tang, J. Mars, W. Wang, T. Dey, and M. L. Soffa. Reqos: reactive static/dynamic compilation for qos in warehouse scale computers. InProceedings of the eighteenth international conference on Architectural support for programming languages and operating systems, ASPLOS ’13, pages 89–100, New York, NY, USA, 2013. ACM.
[40] N. Vasi´c, D. Novakovi´c, S. Miuˇcin, D. Kosti´c, and R. Bianchini. Dejavu: accelerating resource allocation in virtualized environments.SIGARCH Comput. Archit. News, 40(1):423–436, Mar. 2012.
[41] Q. Zhao, D. Koh, S. Raza, D. Bruening, W. Wong, and S. Amarasinghe. Dynamic cache contention detection in multi-threaded applications.VEE 2011, pages 27–38, 2011.
[42] S. Zhuravlev, S. Blagodurov, and A. Fedorova. Addressing shared resource contention in multicore processors via scheduling.SIGARCH Comput. Archit. News, 38(1):129–142, Mar. 2010.