http://www.sciencepublishinggroup.com/j/earth doi: 10.11648/j.earth.20180701.15
ISSN: 2328-5974 (Print); ISSN: 2328-5982 (Online)
Fast Landform Position Classification to Improve the
Accuracy of Remote Sensing Land Cover Mapping
Wenjuan Qi
1, 2, Xiaomei Yang
1, 3, *, Zhihua Wang
1, 2, Zhi Li
2, 4, Fengshuo Yang
1, 2, Zhiling Zheng
51
State Key Laboratory of Resources and Environmental Information System, Institute of Geographic Science and Natural Resources Research, Chinese Academy of Sciences, Beijing, PR China
2University of Chinese Academy of Science, Beijing, PR China 3
Jiangsu Center for Collaborative Innovation in Geographical Information Resource Development and Application, Nanjing, China 4
Xin Jiang Institute of Ecology and Geography, Chinese Academy of Sciences, Urumchi, PR China 5Heilongjiang Institute of Technology, Harbin, PR China
Email address:
*Corresponding author
To cite this article:
Wenjuan Qi, Xiaomei Yang, Zhihua Wang, Zhi Li, Fengshuo Yang, Zhiling Zheng. Fast Landform Position Classification to Improve the Accuracy of Remote Sensing Land Cover Mapping. Earth Sciences. Vol. 7, No. 1, 2018, pp. 23-33. doi: 10.11648/j.earth.20180701.15
Received: October 11, 2017; Accepted: October 24, 2017; Published: January 19, 2018
Abstract:
With the increase in the availability of high resolution remote sensing imagery, land cover classification and mapping by high-resolution remote sensing images is becoming an increasingly useful technique for providing a large area of detailed land-cover information. High-resolution images have the characteristics of abundant geometric and detail information, which are beneficial to detailed classification and mapping. However, in such images, similar features may present different land-cover types in various topographic positions, but these differences are hard to recognize in high remote sensing images. When dealing with such problems, ground surveys or rough classifications of elevations are common methods. Ground surveys are time and labor consuming and lack strong real-time capability. A rough classification cannot reflect subtle changes in terrain. In order to make full use of characteristics of high remote sensing images and avoid their insufficient, a topographic position index landform position classification method is utilized in this research. The meaning of using this method is to reduce the amount of misclassification and wrongly mapping land cover types. The Topographic Position Index landform position classification method compares the elevation of each pixel in a digital elevation model to the mean elevation of the neighborhood and defines landform position class of the each pixel. Such landform position classification method allows a variety of nested landforms to be distinguished. This gives a new input for remote sensing land cover classification and mapping. The experimental results in this research proved that a GaoFen-1(GF-1)remote sensing image land cover classification accuracy is significantly improved by using the Topographic Position Index landform position classification method after image segmentation and classification.Keywords:
High Resolution Remote Sensing Images, Land Cover, Topographic Position Index (TPI), Topographic Position Index Landform Position1. Introduction
Generally, the accuracy of remote-sensing image mapping is mainly influenced by the spatial resolution of a remote-sensing image because the size of the image pixels defines the size of the minimum distinguishable land unit on the map, which cannot be smaller than four image pixels [1]. Hence, the smaller the image pixels are, the smaller the land
remote-sensing imagery remains particularly challenging [2]. Such differences can only be recognized when topographic factors are integrated into the land-cover classification and mapping process.
Many topographic factors are testified whether they are efficient for differences recognition. In Li's research, the land use change decreases with the increase of the elevation and the slope, and the sunny slope is larger than the shady slope, and is mainly concentrated in the semi-sunny area with the elevation of 300 ~ 600m and slope <25°, among which the land between the cultivated land and the forest land The most intense conversion; in the elevation of 0 ~ 300m, slope <25° of the Yangtze River and its tributaries along the coast area of a certain area of arable land and forest land into water [3].
Two kinds of methods were developed to increase mapping accuracy. The first kind uses terrain factors to correct shifting and shape change caused by illumination effects in steep or high-relief mountainous areas. In Dhruba 's research, only a few land-cover categories were accurately discriminated using spectral information exclusively, e.g. water and flat paddy field. The classification accuracy of forested areas and shrublands were considerably increased after the addition of surface orientation (i.e. slope and aspect) maps derived from the DEM using a kernel of 9 pixels × 9 pixels were used to compute solar incidence angles [4]. The other kind uses terrain factors to do geographical zoning. Elevation spectrum is commonly used for demarcation of land cover types [5]. These two kinds of methods do increase mapping accuracy in a certain extent, but the land cover classification accuracy is not improved by these methods.
In this research, a terrain factor called topographic position index (TPI) is used for land-cover classification process for the first time. TPI compares the elevation of each cell in a Digital Elevation Model (DEM) to the mean elevation of a specified neighborhood around that cell. By thresholding the continuous TPI values at a given scale, and checking the slope
for values near zero, landscapes can be classified into discrete slope position classes. Combining TPI at a small and large scale allows a variety of nested landforms to be distinguished [6]. The exact breakpoints among classes can be manually chosen to optimize the classification for a particular landscape and problem. As in slope position classifications, additional topographic metrics, such as variances of elevation, slope, or aspect within the neighborhoods, may help delineate landforms more accurately, and extract different types of features [7]. Land units classified by height resolution remote sensing images and TPI factors then possess both spectral and topographic features. Boundaries of land units are more accurate [8] [9] [10] [11].
2. Materials and Methods
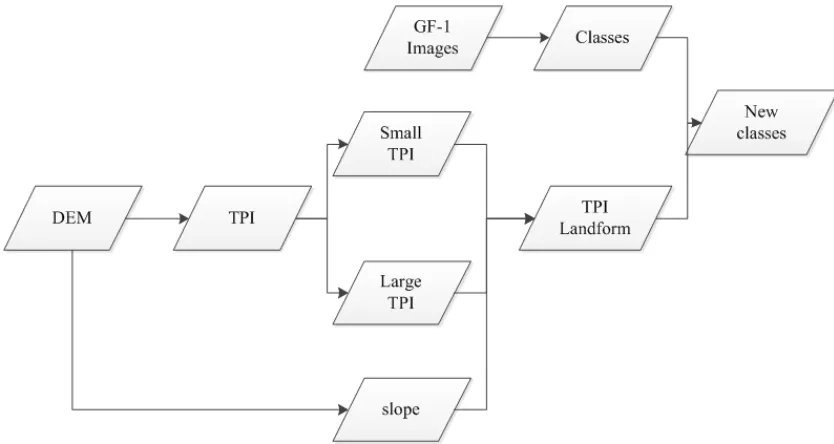
2.1. Technical Route
Figure 1 presents the classification accuracy improvement process in this research. First, in the data acquisition and preprocessing phase, 30-m resolution Advanced Spaceborne Thermal Emission and Reflection Radiometer Global Digital Elevation Model (ASTER GDEM) V1 have been downloaded from website of U.S. Geological Survey. Also, a 2-m resolution Chinese GaoFen-1 (GF-1) remote sensing image has been purchased and downloaded from the website of China Geological Survey. GF-1 image is used for automatic image classification. ASTER GDEM is applied to compute slope of the research area, and TPI landform position classes. and the landform position classes are defined, based on the TPI values of each image pixel. After these two steps, the land-cover map and the landform position classes are overlaid and analyzed for the new minimum mapping unit generation. Besides, ground survey are then used for accuracy assessment of the mapping results.
2.2. Data Acquisition and Preprocessing
2.2.1. Study Area
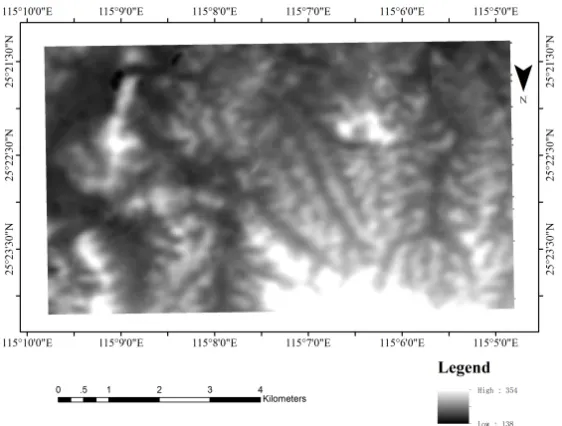
The research area, located in northeast Xinfeng County, Ganzhou City, Jiangxi Province, features many low hills and mountains (Figure 2). The total research region covers 101.14 km2.
Figure 2. Research area.
2.2.2. Source Data
a. GaoFen-1 (GF-1) image
The first of the Gao Fen series, GaoFen-1(GF-1), was launched on April 26, 2013. With a high spatial resolution at 2 m, GF-1 wide-field images are fit for land-cover mapping. In this research, one GaoFen-1 image covering the research area is used as source data for automatic classification process.
b.Digital Elevation Model( DEM) and slope data
The ASTER GDEM database is one of the most widely used digital surface models, due to their free accessibility and global coverage. It is in Geo TIFF format with geographic lat/long coordinates and a 1 arc-second (30 m) grid of elevation postings. It is referenced to the WGS84/EGM96 geoid. Slope data computed by the ASTER GDEM is used as an input for calculation of TPI landform position classes.
2.2.3. Image Preprocessing
Image preprocessing mainly includes radiometric correction, atmospheric correction, geometric correction, and image fusion. Radiometric correction and atmospheric correction are usually completed before researchers receive the remote-sensing data. Geometric correction includes orthographic and terrain corrections. Orthographic correction can help to define the spatial data coordinate system and eliminate the general causes of geometric distortion. Topographic correction can eliminate the geometric distortion caused by high and low terrain levels. Image-fusion is a necessary step to improve the accuracy of both image
segmentation and feature information extraction in remote-sensing mapping. In this research, fusion image of panchromatic image and multispectral images is used for image segmentation and land cover classification.
2.3. Methods
2.3.1. Land-Cover Interpretation
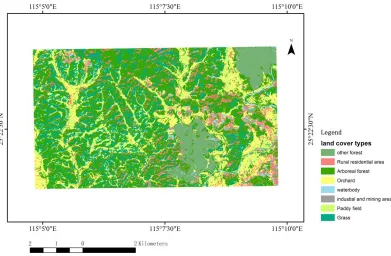
Automatic clustering algorithm is used for image segmentation. The original image is segmented into multiple regions with very similar spectral, textural, and geometric features (Figure 4).
Figure 4. IsoData Classification result automatically done by ENVI software.
The automatic clustering method provides 17 classes as a result. These classes can 't present land cover types, because their features are too unique to present land cover types in nature. Combination is needed for land cover classification.
A classification system used for local land-cover interpretation of Province Jiangxi was organized by the State Key Laboratory of Resources & Environmental Information System(LREIS) of Institute of Geographic Sciences & Natural Resources Research(IGSNRR) of Chinese Academy of
Sciences(CAS) in 2016. The system is named Jiangxi Land Use and Land Cover Classification (JXLUCC) system. Related land cover types and their feature descriptions are listed in Table 1. Similarity degree of different automatic clustered classes by visual interpretation and by feature descriptions of land cover types in JXLUCC were analyzed. Then the classes were combined into 8 land cover classes (Figure 5).
Table 1. Jiangxi Land Use and Land Cover Classification (JXLUCC) system (part).
Type Image features GF-1 image
shape Color Texture
Paddy field
Significant shape features: strip-shaped or block-shaped parcels of fields
Cyan, pink, and red are primary, and tone is uniform.
Type Image features GF-1 image
shape Color Texture
Orchard
Significant shape features: block-shaped or irregular planar boundaries that are very distinct
Tone is light green, light
gray, cinerous, or crimson. Uneven image structure
Arboreal forest
Distinct boundaries and irregular planar, block-shaped boundaries in mountainous region
Tone is crimson or dark red
and even with shadows. Rough image structure
Other forests
Significant shape features: block-shaped or irregular planar boundaries that are very distinct
Light red, black, or
cinerous, with uneven tone Rough image structure
Grass Block-shaped, strip-shaped, or
planar boundaries that are distinct Pink, red, yellow, or brown Uniform image structure
Water body
Significant shape features, artificial construction such as retaining dam, and so on
Mazarine is primary color,
with even tone Uniform image structure
Industry and Mining area
Significant shape features and distinct boundaries
Light gray, charcoal grey is
primary, even tone Rough image structure
Rural residential area
Significant shape features and distinct boundaries
Figure 5. Land-cover types in research area.
As shown in Figure 5, the land-cover types that include paddy field, orchard, arboreal forest, other forests, grassland, waterbody, rural residential area, and industrial and mining lands are interpreted.
The main land-cover type of the area is the arboreal forest,
which occupies 49.53% of the total area (Table 2). The second largest land-cover type is the paddy field, which accounts for 38.74%. Other land-cover types account for 11.73% altogether.
Table 2. Statistics of land-cover types in research area.
Industrial and
mining lands Orchard Rural
residential area Grass-land Other forests Water body Paddy field
Arboreal
forest Total
Area (km2) 6.21 1.40 2.16 0.25 1.54 0.29 39.18 50.09 101.14
Percent (%) 6.15 1.39 2.13 0.25 1.52 0.29 38.74 49.53 100
2.3.2. Improvement of Land-Cover Boundary Accuracy by Landform Position Classification
a. Definition of topographic position index (TPI)
As proposed in the 2001 ESRI (Environmental Systems Research Institute, Inc.) International User Conference by Andrew Weiss, the TPI provides the basic data for the topographic classification system [12]. The TPI provides a concise and effective method of landscape classification in accordance with morphology. Its fundamental principle is to study the difference in the elevation of the target point and that of its mean values. The topographic position of the target point can then be determined in accordance with the positive value, the negative value, and the magnitude of the difference, with the positive value indicating that the target point is higher than adjacent areas and the negative value denoting that the target point is lower than adjacent areas. This rule is presented in Equation (1):
(1)
where radius means the distance of the neighborhood, E signifies the current elevation, Emean represents the mean elevation of the neighborhood, and EMax denotes the maximum elevation.
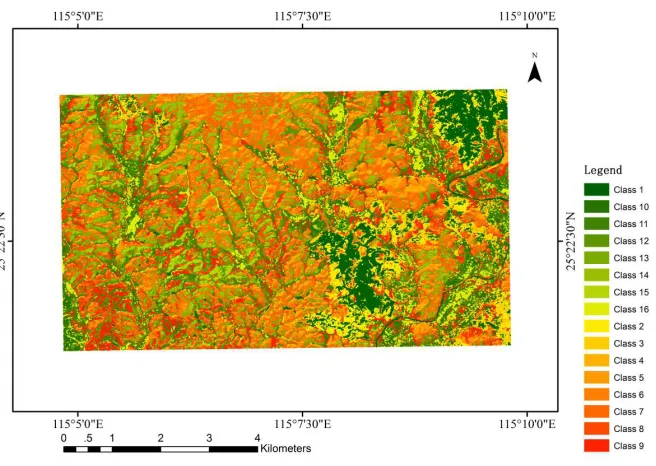
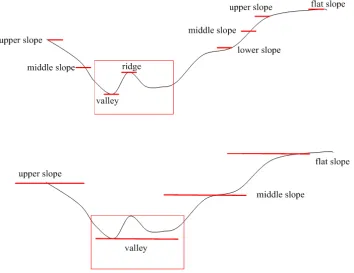
The TPI slope can be computed by the elevation difference between the neighbor pixels and the slope. The TPI slope can be classified into ridge, upper slope, middle slope, flat slope, lower slope, and valley types [13]. If the range of the neighborhood is relatively small, the TPI slope is calculated within a relatively small range. If we increase the range of the neighborhood, the TPI slope presents how the land undulates in a more macroscopic way. Small increases and decreases on the small scale are not taken into account in the TPI slope. Obviously, the choice of the neighborhood scale will influence the result of the TPI slope classification (Figure 6) [14] [15].
Figure 6. TPI slope position.
To eliminate the impact of the neighborhood range on the TPI slope, small TPI and large TPI radiuses are used. They are calculated by relatively small and large neighborhood ranges, together with the topographic slope, and then combined in different classes. Then, a new set of
parameters—TPI landform position classes is acquired. Due to resolution of the DEM in this research, neighborhood ranges of 60 m and 600 m are used for small and large landform elements, respectively. Landforms are then classified using TPI grid thresholds (Table 3).
Table 3. Grading of TPI landform and statistics of related TPI and slope [16].
Class Landforms Neighborhood TPI Slope
Small (TPI60m) Large (TPI600m)
1 Lowland, small depressions ≤ -1 ≤ -1
2 Upper flat dells, flat sinks ≤ -1 > -1 and < 1
3 Flat hollows in culmination areas ≤ -1 ≥ 1
4 Lowland, larger depressions > -1 and < 1 ≤ -1
5 Flat relief, plains ≤ 2° > -1 and < 1 > -1 and < 1 ≤ 2°
6 Slope > 2° > -1 and < 1 > -1 and < 1 > 2°
7 Culmination area > -1 and < 1 ≥ 1
8 Local elevation in lowlands ≥ 1 ≤ -1
9 Mid-slope small ridges ≥ 1 > -1 and < 1
10 Top, shoulder ≥ 1 ≥ 1
b.Extraction of new classes
TPI landform position classes are generated by using spatial analysis tool of Relief Analysis 10.0 (Jenness, 2007). Figure 6 illustrates the results of the TPI landform position classes, which represents the geomorphic and topographic status of the research area. It shows the clear boundaries of the different TPI landform classes. Spatial analysis methods of spatial analysis tool by Arcgis 10.1 are used to superimpose the TPI landform position classification results with the land cover classes described in 2.3.1. Then, new classes are completed. These new classes give the original land cover types new features as they grow in different landform positions. Topographic prefixes are added to their names. For example, after searching for the appropriate definition in agricultural
dictionaries, culmination area-paddy fields are defined as terraces. Hence, such land units with both topographic and image features are more accurate and precise than the previous land cover type "paddy field" Besides, wrongly classified classes can be easily discovered when they appear in impossible position.
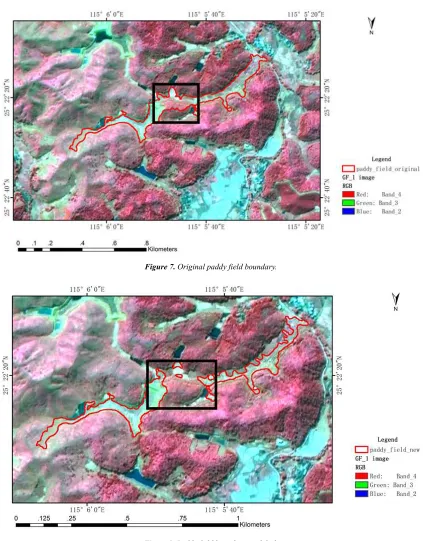
Figure 7. Originalpaddy field boundary.
Figure 8. Paddy field boundary modified.
3. Results
Figure 9. TPI landform position.
Figure 10. New land units by overlay of land cover types and landform position classes.
Table 4. New land units with topographic prefixes and their definitions in dictionaries.
Typ Prefi
Industrial and
mining lands Orchard
Rural
residential area Grassland Other forests
Water
body Paddy field Arboreal forest Lowland, small
depressions Mining steps
Upper flat dells, flat sinks
Flat hollows in culmination areas
Immature
forest Water pool
Terrace paddy field Lowland, larger
depressions Fruit garden
Immature
forest Reservoir
Lowland paddy field
Broad-leaved forest
Flat relief, plains ≤ 2° Fruit garden Highway Urban green Nursery Water pool Plain paddy
field
Broad-leaved forest
Slope > 2° Mining slope Tea garden
Typ Prefi
Industrial and
mining lands Orchard
Rural
residential area Grassland Other forests
Water
body Paddy field Arboreal forest
Culmination area Fruit garden Buildings Water pool Terrace paddy
field
Mixed coniferous broad-leaved forest
Local elevation in
lowlands Fruit garden Buildings
Suburban grass Mixed coniferous broad-leaved forest Mid-slope small
ridges Buildings
Mixed coniferous broad-leaved forest and shrub
Top, shoulder Buildings Immature
forest
Mixed coniferous broad-leaved forest and shrub
In table 5, the definition of land cover classes are further specifically described. For instance, paddy fields in culmination areas are terrace paddy fields, those in larger depressions are lowland paddy field, and those in plains are plain paddy fields.
4. Discussion
After calculating the minimum identifiable land unit with topographic and geomorphic features, an accuracy assessment is performed. Based on the ground survey, 265 sample points are measured by Global Positioning System (GPS). They testify the accuracy of experiment results. Tables 5 and 6 show the survey results.
Table 5. Accuracy statistics of original land-cover types.
Land-cover type Accuracy%
Paddy field 86.70
Orchard 100.00
Arboreal forest 85.50
Other forests 100.00
Grassland 100.00
water body 100.00
Organic town 86.70
Industrial and mining lands 90.90
Table 6. Accuracy statistics of new classes.
Land-cover type Accuracy%
Terrace paddy field 93.35
Lowland paddy field 93.35
Plain paddy field 93.35
Fruit garden 100.00
Tea garden 100.00
Broad-leaved forest 92.75
Mixed coniferous broad-leaved forest 92.75
Mixed coniferous broad-leaved forest and shrub 92.75
Immature forest 100.00
Nursery 100.00
Urban green 100.00
Suburban grass 100.00
Reservoir 100.00
Water pool 100.00
Highway 100.00
Buildings 93.35
Mining slope 95.45
Mining steps 95.45
According to table 5 and 6, the amount of land cover classes increased from 8 to 18. The accuracy of the land-cover
classification (including paddy field, arboreal forest, organic town, and industrial and mining land types) is obviously improved.
5. Conclusions
In this paper, a fast method has been developed to improve the accuracy of the land-cover classification. The new land cover classes more precisely describe the features of the ground objects. The sources are DEM and slope data from public platforms, and remote sensing images which are handy and easy to use. The process is simple and the accuracy of land cover classification could be increased significantly. The method is suitable for accuracy improvements of land-cover maps for larger areas. In the future, researchers should continue to explore landform factors and other effective environmental information that contribute to the further improvement of the accuracy of high-resolution remote-sensing image mapping. Besides TPI, a topographic factor called "landform element" which can be assembled into various higher-level geomorphic types [17] could be useful like TPI during land-cover classification process. The relevant experiment will be carried out in the next study of land cover accuracy improvement.
References
[1] Gong, M. G; Zhang Y.; et al. The Discussion of the Relation between the Scale and the Best Spatial Resolution in Making Cartographies with RS. Science of Surveying and Mapping, 34 (4), 2009, 232-233+60.
[2] Lu, D., and Q. Weng. A Survey of Image Classification Methods and Techniques for Improving Classification Performance. International Journal of Remote Sensing 2007. 28: 823–870. doi:10.1080/01431160600746456.
[3] Li D., Liu D., Zhao J. Study on Land Use Change in Mountainous Area Based on DEM [J]. Journal of Soil and Water Conservation, 2014, 01: 66-70 + 2.
[4] Dhruba Pikha Shrestha, J Alfred Zinck. Land use classification in mountainous areas: integration of image processing, digital elevation data and field knowledge (application to Nepal),
International Journal of Applied Earth Observation and Geoinformation, Volume 3, Issue 1, 2001,Pages 78-85, ISSN 0303-2434,
[5] Hui Fan Land-cover mapping in the Nujiang Grand Canyon: integrating spectral, textural, and topographic data in a random forest classifier, International Journal of Remote Sensing, 2013, 34:21, 7545-7567, DOI: 10.1080/01431161.2013.820366. [6] Jenness, J. Topographic Position Index (tpi_jen.avx) Extension
for ArcView 3.x.
http://www.jennessent.com/arcview/tpi.htm.Accessed 25 June 2008.
[7] Yang Y. Q. Comparison of Remote Sensing Image Classification Method Based on Different Geomorphic Elements [J]; Shanxi Normal University; 2016.
[8] Zhang, X. P.; Jiao F; Li R; et al. The Indices and Method Approach of Land Sustainable Use Evaluation in Land Patch Scale-Take the Zhifang gully in Ansai, Shaanxi province as example. Chinese Journal of Environmental Engineering, 7, 1998, 29-33.
[9] Yang, X. X.; He Z. M.; Yang X. L. Remedying Land Grading Method based on Comparison of the Change of Land Plot and Verification of Land Price. Resour. Sci.28(5), 2006, 80-85. [10] Hu, T. G.; Zhu W. Q.; et al. Farmland Parcel Extraction Based
on High Resolution Remote Sensing Image. Spectroscopy and Spectral Analysis Spectrosc. Spect. Anal. 29(10), 2009, 2703-2707.
[11] Dizdaroglu D.; Yigitcanlar T. A parcel-scale assessment tool to measure sustainability through urban ecosystem components:
The MUSIX model. Ecol. Indic. 41,. 2014 115-130. http://doi.org/10.1016/j.ecolind.2014.01.037.
[12] Weiss A. Topographic position and landforms analysis.ERSI User Conference, San Diego, USA. 2001.
[13] Carrao, H.; Goncalves, P.; Caetano, M. Contribution of multispectral and multitemporal information from MODIS images to land cover classification. Remote Sens. Environ. 112(3), 2008 986-997.
http://doi.org/10.1016/j.rse.2007.07.002.
[14] Nemmour, H., et al. Fuzzy neural network architecture for change detection in remotely sensed imagery. Int. J. of Remote Sens.27(4), 2006. 705-717.
http://dx.doi.org/10.1080/01431160500275648.
[15] Ben-David S. A framework for statistical clustering with constant time approximation algorithms for K-median and K-means clustering. Mach. Learn. 66(2), 2007. 243-257. doi:10.1007/s10994-006-0587-3.
[16] Detlef D.; Rolf S.; Michael S. A multiscale soil–landform relationship in the glacial‐drift area based on digital terrain analysis and soil attributes. J. Plant Nutr. Soil Sc. 173, 2010, 843-851.doi: 10.1002/jpln.200900094.