An Inference of current techniques in retinal
hemorrhage detection
Sreeja K A1, Arun Pradeep2, Dr. S.S Kumar3
1
Department of Electronics & Communication Engineering, SCMS School Of Engineering & Technology, Ernakulam , Kerala , India
2 Department of Electronics & Communication Engineering, Axis College Of Engineering & Technology, Trissur , Kerala, India 3Department of Electronics & Instrumentation Engineering, Noorul Islam University, Thuckalay,
Nagercoil, Tamil Nadu, India
Abstract- Diabetic retinopathy is the major reason for loss of eyesight in recent years. Studies are going on for the earlier detection of diabetic retinopathy symptoms. One of the symptoms of DR is retinal hemorrhage caused due to the leakage of blood vessels. Earlier identification of retinal hemorrhages ensures the right clinical attention for prolonged eyesight in diabetic patients. Different automated screening systems have been developed for the non-invasive detection of DR symptoms. In this paper an attempt is been made to review the existing algorithms developed for automated hemorrhage detection.
Keywords: Hemorrhages, Splats, Diabetic Retinopathy, Fundus, FP reduction, hemorrhage detection, Mathematical Morphology, Micro-aneurysms.
I. INTRODUCTION
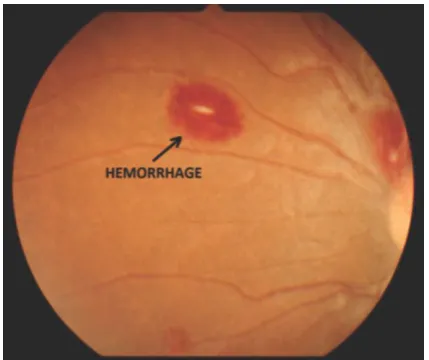
The detection of hemorrhages as shown in Fig. 1 is one of the important method for the early diagnosis of diabetic retinopathy (DR). Patients with diabetes may develop a medical condition in which the fluid from blood vessels leak and the retina gets damaged. This condition is called Diabetic Retinopathy. Early diagnosis of DR can help reduce the occur- rence of blindness. Two stages of DR are initial proliferative stage and advanced non proliferative stage. Symptoms such as cotton wool spots, drusen, exudates, hemorrhages, micro aneurysms etc. develop in the initial proliferative stage and abnormal blood vessels may develop, during the advanced non proliferative stage. Symptoms are less noticeable during the proliferative stage and chances of misinterpreting a DR af- fected eye as a healthy eye are more. This triggers the need of automated screening methods for the correct interpretation of fundus image. A number of different approaches are employed so far to detect exudates, hemorrhages, and microaneurysms occurring due to DR. The lesion based approach uses many morphological based approach uses many morphological operations to identify candidate lesions and count them.
Fig. 1 Retinal Hemorrhage
The drawback of the method is the size of lesion is large, which makes the shape modeling, a challenge. In the pixel based approach, features are extracted from each pixel and soft labels are assigned accordingly. This indicates the possibility that the pixel can be a portion of the target object. Abnormal pixels are then combined into objects. Splat based classification is another advanced technique used to detect hemorrhages.
Splats can be defined as collection of pixel with similar color and spatial location. Under the splat based supervised approach, the entire retinal color images are partitioned into non overlapping segments.
A set of features are extracted from each splat with respect to the surroundings, its characteristics are described. The response from a variety of filter bank, interactions with neighboring splats, shape and texture information are also considered.
II. RELATED WORKS
A .Image enhancement
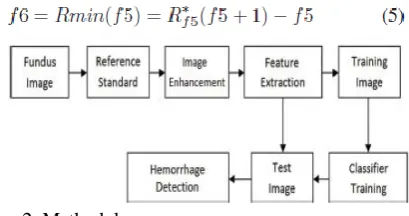
Figure 2 show the steps involved in hemorrhage detection process.
Yuji hatanaka et. al.[1] in their paper on improvement of automated detection method of hemorrhages in fundus image took 145 fundus images from which 87 images of 1600 x 1600 pixels, 24 bit colour. Also 58 fundus images of 2800 x 2800 pixels, 24 bit colour. All the images were reduced to 640 x 640 pixels. Change in colour of fundus image due to flash light used while taking the image was reduced using hue saturation value space. The brightness correction is performed using the equation .
The RGB values are corrected using this equation. Further gamma correction for a gamma value of 1.5 can be used get a normalized image. The green channel was extracted and the images were converted to gray scale.
Akhilesh Sharma et. al. [3] in their paper on dynamic thresholding technique for detection of hemorrhages in retinal images took ten samples of fundus images from the pub- lically available DIARETDB1 database. The green channel is extracted from RGB in order to extract the hemorrhage features with more accuracy and finally to gray channel with intensity range 0-255. The salt and pepper noise was removed using 3 x3 median filter and edges were preserved. The image was inverted to brighten the blood vessel and hemorrhage from background. For further contrast enhancement CLAHE algorithm was utilized.
Sergio Bartolen Junior et. al.[16] in their paper named Automatic detection of microaneurysms and hemorrhages in colour eye fundus images did enhancement by the application of Alternating Sequential Filtering to estimate the background of preprocessed image by equation
ASF operation was performed in 3 iteration with structuring element B of radius 5 pixels. Later image obtained from CLAHE was subtracted from image of ASF to obtain an intensity inverted image. The high intensity structures were eliminated and result was assigned to image f4 by equation
The low contrast of f4 were eliminated using H-minma transform by equation
Image f5 was binarized using Rmin by equation
Fig. 2 Methodolgy
Asra Ashraf et. al.[17] in their paper on detection of retinal whitening, cotton wool spots and retinal hemorrhages for diagnosis of malarial, identified retinal whitening and cotton wool spot as enhancement process. To localize whitening regions the colored image were split into RGB and Hue saturation intensity components. Using an 80 * 80 window, OD was removed and by applying mean based thresholding images were segregated. The features were extracted based on shape, color, statistical and grey scale from all thresholded regions. 48 features were selected and top 5 features were selected among 48. CWS were seen either as segregated in fundus image or with different lessions like hemorrhage and hard exudates [20]. For identifying this, vessels were eliminated by applying morphological closing operation; A disc shaped mask with radius 11 was applied to green channel median filtered image [21]. For enhancement of CWS Gabor wavelet was used. Otsus Algorithm [22] was used to get a binary image. It contain enhanced bright region and high contrast region.
Garima Gupta et. al.[18] in their paper on detection of retinal hemorrhages in the presence of blood vessels con- structed a multiscale morphological pyramid Π in which the zeroth level of pyramid represent the opening of green channel Ig & each following level stores a
successive opening with re-sampling. Multiscale morphological opening pyramid was used for homogenizing the freckled texture within the hemorrhage & to improve the edge definition of object of interest.
A set of 12, 15 x 15 pixels kernels were applied & σ = 1.5 & L = 9 were used in this experiment. Along with red lesion contrast of image were also enhanced.
Yuji Hatanaka et. al.[5] used fundus image which were digitized to an array of 1600 x 1600 pixels. Later the scale of matrix was reduced to 640 pixels. Gray scale images were obtained by extracting green component. Histogram equalization was done to enhance brightness & noise was removed using smoothing process. Also, optic nerve head was highlighted & p-tile technique was used.
B . Image enhancement
Yuji hatanaka et. al.[1] proposed p-tile thresholding method[4] to extract optic nerve head. Density analysis[5] was used to detect blood vessels and hemorrhages were two smooth images were made using mask of 3 x 3 and 9 x 9 pixels. The differences between pixel values were calculated and blood vessels and hemorrhages were detected. Finally, the blood vessels connected with the optic nerve head were detected and removed. A thinning technique was also used to eliminate the incorrectly detected blood vessels.
Li Tang et. al. [2] in their experiment used image over- segmentation [6] to split the image plane into splats of homogeneous colors. The gradient magnitude of input image at scales optimal for localization of vessel boundaries were calculated using the equation
The maxima of the gradient magnitudes were applied to the watershed [7] to produce splats
To detect hemorrhage, the mean colour within the splat p was extracted in six colours namely R,G,B, dark-bright, red-green and blue-yellow [8] using the equation
The intensity variation was also considered along with the absolute mean colour for which the
difference between the Gaussian smooth image and original image was computed at number of scales σ = (0.5, 1, 2, 4, 8, 16). There is an additional feature
fps in the mean difference which was computed for
all colour components using the equation
Akhilesh Sharma et. al.[3] in their experiment removed the
background using shade correction method. A 33 x 33 median filter was used to estimate the background and subtract from CLAHE output to make the background zero. The resultant output will be the image with only the blood vessels and hemorrhage. The dynamic thresholding technique [9][10] was used to discriminate foreground and background based on intensity difference. The gray scale image was converted to binary and one value was assigned to the foreground and another value was assigned to the background.
Sergio Bortolin Junior et. al.[16] performed ASF for de- tection of blood vessel on CLAHE image with one iteration. They used a disc shaped structuring element with radius of 3 pixels by equation
The next image was obtained by subtracting CLAHE image from f 7 by equation
For detection of blood vessel, morphological opening was performed 12 times on f8 with 12 different angles ranging 15 degrees to each structuring element [23]. Finally 12 images were added to obtain f8 with sketches of blood vessel by equation
Diamond shaped structuring element with radius 1 pixel was used for detection of blood vessel by a morphological reconstruction by dilation R with equation
Asra Ashraf et.al.[17] used computer aided frame work to locate the presence of hemorrhage in fundus image, where at first non uniform illumination & local contrast variability was removed from the image. Adaptive threshold method was used for detecting candidate hemorrhage. Multilayered thresholding was used for extraction of small 7 large vessels & morphological erosion for removal of false region.
Garima Gupta et. al.[18] used an iterative intensity based region growing in which each iteration the region adds neighbor pixels with intensity within certain limit from current region mean. At each scale of the multiscale morphological pyramid Π, local contrast was estimated & normalized by dividing background (Bgi ) from Πi. This image enabled the
use of contrast parameter for contrast, while region growing. For restriction of growth of vessel seeds into branches & bends, a stopping criteria was set based on displacement of center of mass of currently growing region. They conducted morphological tests for rejection of vascular false alarm, based on 5 properties such as eccentricity, width, elongation, aspect ratio & truncation. Elongation was defined as the standard deviation of euclidean distance of perimeter pixel from centroid of candidate. Truncation (VTR) was quantified by number of pixels removed by morphological opening. Giri Babu Kande et.al.[19] employed entropy based thresh- olding algorithm, to extract the enhanced red lesion segment in matched filter response. In this algorithm spatial distribution of grey level was used. The thresholding was used to minimize the discrepancy between co-occurrence matrix of original image & that of binarized image. Due to narrow intensity distribution of dark areas, co-occurrence matrix of dark region had narrow peaks & using the thresholding technique all red lesions were kept along with blood vessel. For effective detection of red lesion, the thresholded image was suppressed. Morphological top-hat transform was used for suppression of image. It was based on morphological opening of the image. 12 rotated structuring elements were used with ra- dial resolution of 15 degree. To set red lesion segment top hat transformed image was subtracted from relative entropy thresholded image.
Yuji Hatanaka et. al[5] performed finite difference calcu- lation for detecting hemorrhage. For that, fundus image were smoothed by 27 x 3 pixel mask. Later difference in pixel value between two smoothed images were calculated. Thresholding technique was used to segment hemorrhage & blood vessel. For detecting end of blood vessel, smoothing technique with 9 x 3 pixel mask was used. Finally vessel candidate connected to optic nerve head was eliminated.
C. Image feature extraction and classification
Yuji hatanaka et. al.[1] used feature analysis to eliminate false positives. Five pixels along each co-ordinate axes were extended to define a minimum rectangular region. To deter- mine the contrast, the ratio of average pixel values inside and outside the hemorrhage candidate were considered. Also, they employed a cascade classification process to eliminate the False Positives (FPs) considering 45 features.
A total of 15 features were extracted from the rectangular regions from which 12 features were calculated from the co- occurrence matrix [11], 2 features from gray-level difference statistics [16], and one feature using extrema method. The extracted features were calculated in the rectangular regions for red, green, and blue-bit images. Finally, 3 Mahalanobis distance (MD) classifiers were trained and designed with the these 15 features to eliminate the FPs.
Li Tang et. al [2] extracted a feature vector for each of the training sample (splats). Each feature is normalized to zero mean and unit variance. Decision boundary was set to separate blood and non blood regions. Using a trained classifier, label was assigned for splats based on set of feature values extracted from test samples. Automated vessel segmentation technique [13] was used to remove the connected vasculature from the separated blood splats. The remaining objects were considered as possible hemorrhages.
A KNN classifier with a value of k=101 gave a satisfactory result [14]. Sequential forward selection (SFS) was used to find the subset of most features. The area under the ROC curve was taken as the criterion function. Out of 42 features, only 7 were selected, which are 7 extracted from green, blue and dark-bright. These seven features were extracted for splat based feature classification. The testing stage was fully automatic. When each splat was determined, hemorrhage likeness map Pblood can
be created for each testing image. Pblood was
threshold to produce to binary image to determine hemorrhage location. To determine threshold, mean hemorrhage likeness of blood vessel splats Pvessel was examined. This gives mean probability value of blood splats that can be detected at a certain threshold. A probability value of 0.88 gives good separability. By removing vessel splats remaining response indicate presence of hemorrhage. The Hemorrhage index is computed as mean probability of hemorrhage splats by area of largest hemorrhage.
used ’White top hat’ transform. So for blood vessel architecture estimation, a small sized ball type structuring element was used on CLAHE image that was extracted. White top hat transform W on image I
with structuring element S was implemented by
Where o is the morphological opening.
Morphological opening helps to retain objects, that fits within the structuring element and eliminates objects which do not fit. Since the blood vessel possess a linear structure, so in-order to open the image, a size 15, linear structuring element was used and rotated at an angle of 10 degree for covering the entire image. The max of all image will result in blood vessel architecture as final output. For extracting fovea, Akhilesh Sharma et. al.[3] used the method proposed by Kovacs et. al [15] i.e. median filter was applied on green channel to generate images with shade correction. The Image was converted to binary Image by assigning 0 to background and 1 to foreground. The fovea can be determined as a big sized object by employing label connectivity as well as thresholding. The image obtained was subtracted from the previous output which resulted in a fovea removed image. Small vessels were removed by morphological opening with structural element of small size resulting only the hemorrhage candidates.
Sergio Bortolin Junior et. al.[16] described elimination of fovea as the last stage of his proposed method [new 23]. For that at first binary image called fovea center with only pixel value 1 was identified as center of fovea. Then morphological dilation was performed with radius of 25 pixel. The result was assigned as f13 as equation
Then fovea was removed by subtracting f13 from f12
as equation
For refining final image, morphological operation was done on f14 & obtained f15 as equation
Finally a mask by DIARETDBI was applied to remove the area outside the retina by equation
& obtained a final image f16 with microaneurysms & hemorrhage.
Asra Ashraf et. al.[17] considered SVM as a good classifier. SVM used complete feature vector as input & grades the region in two classes based on 50% training & 50% testing data. KNN classifier & decision tree classifier was also used for classification.
Garima Gupta et. al.[18] used top hat morphological operation with linear structuring element rotated in different orientation at a resolution of 10 degree to find the location of the candidate. These pixels removed in more than 5 orientation belong to non curvilinear part of candidate. Here confidence scores were assigned to each candidate ranging from 0 to 1. A set of features were extracted & mapping was done between feature values to confidence score[23]. A set of feature based on transverse profile modeling of candidate centerline were computed. Gaussian function was used to model transverse profile of candidate. All the feature extracted were aimed at discriminating candidate with vascular structure from thick flames & hemorrhage.
Giri Babu Kande et. al.[19] used SVM classifier which was based on structural risk minimization. Here the input vector was mapped to high dimensional feature space by choosing nonlinear mapping kernel. The optimal separating hyper-plane is given by equation.
To improve the performance, 12 features from the co- occurrence matrix namely angular second moment, contrast, correlation, sum of squares, inverse difference moment, sum average, sum variance, sum entropy, entropy difference vari- ance, difference entropy, & information measurement for cor- relation were calculated to classify candidate red lesion are & non red lesion areas.
outside the region were calculated to determine the contrast. Finally 13 features were selected and
TABLE I
COMPARISON OF VARIOUS RESULTS
calculated in the rectangular region to eliminate false positives by a rule based method[24][25][26].
III.PERFORMANCE OF THE ALGORITHMS
(RESULTS)
The results were compared and the strength of the classifier was calculated based on the parameters sensitivity ,specificity and accuracy. Table 1 shows the comparison of the 8 papers studied for this review. The parameters reviewed are
the conference paper formatting requirements is to use this document as a template and simply type your text into it.
IV.CONCLUSION
Diabetic retinopathy, which is a major cause of blindness can be brought to control if detected at an initial stage. This paper makes an attempt to compare different techniques used at the three stages of detection process. More than 15 features were extracted and studied by different authors. A comparison based on sensitivity, specificity and accuracy is included to determine the strength of the classifiers used. More number of features can be considered to increase the strength of classifier.
REFERENCES
[1] Y. Hatanaka, T. Nakagawa, Y. Hayashi, T. Hara and H. Fujita, Improvement of automated detection method of hemorrhages in fundus images, 30th Annual International IEEE EMBS. Vancouver, Canada:2008.
[2] L. Tang, M. Niemeijer, and M.D. Abramoff Splat feature classification: Detection of the presence of large retinal hemorrhages, 2011 IEEE International Symposium on Biomedical Imaging: From Nano to Macro, Chicago, IL, 2011, pp. 681-684.
[3] A. Sharma, M.K. Dutta, A. Singh, M. Parthasarathi and C.M. Travieso, Dynamic thresholding technique for detection of hemorrhages in retinal images, 2014 Seventh International Conference on Contemporary Computing (IC3). Noida, 2014, pp. 113-116.
[4] W. Doyle, Operation useful for Similarity Invariant pattern recognition, J. Association for computing machinery. Vol. 9, No. 2, pp. 259-267,1962.
[5] Y. Hatanaka, T. Nakagawa, Y. Hayashi, Y. Mizukusa, A. Fujita, M. Kakogawa, K. Kawase, T. Hara and H. Fujita CAD scheme for detection of hemorrhages and exudates in ocular fundus images, Proc. SPIE6514, Medical Imaging 2007: Computer-Aided Diagnosis, 65142M, March 2017
[6] C.L.Zitnick, S.B. Kang, International Journal of Computer Vision, Volume 75, Issue 1, pp 4965, October 2007
[7] Yung-Chieh Lin, Yu-Pao Tsai, Yi-Ping Hung and Zen-Chung Shih, Comparison between immersion-based and toboggan-based watershed image segmentation, IEEE Transactions on Image Processing, vol. 15, no. 3, pp. 632 -640, March 2006
[8] Michael D. Abramoff, Wallace L. M. Alward, Emily C.Greenlee, Lesya Shuba, Chan Y. Kim, John H. Fingert, Young H. Kwon Automated Segmentation of the Optic Disc from Stereo Color Photographs Using Physiologically Plausible Features
[9] Jiuwen Zhang; Yaohua Chong Text localization based onthe Discrete Shearlet Transform 4th IEEE International Conference on Software Engineering and Service Science (ICSESS),vol., no., pp.262,266, 23-25 May 2013
[10] D. Kayal, S.Banerjee A new dynamic thresholding based technique for detection of hard exudates in digital retinal fundus image, International Conference on Signal Processing and Integrated Networks (SPIN), vol., no., pp.141,144, 20-21 Feb. 2014
[11] R. M. Haralick Statistical and structural approaches to texture Proc. IEEE, vol. 67, no. 5, pp. 786-804, 1979
[12] J. S. Weszka, C. R. Dyer, and A. Rosenfeld, A comparative study of texture measures for terrain classification Proc. SPIE 5370, IEEE Trans. Systems, Man, and Cybernetics, vol. SMC-6, no. 4, pp. 269-285,1976
[13] Meindert Niemeijer, Joes Staal, Bram van Ginneken, Marco Loog and Michael D. Abramoff A Comparative study of retinal vessel segmentation methods on a new publicly available database Proc. SPIE 5370, Medical Imaging 2004: Image Processing, 648, May 12, 2004
[14] Joes Staal, M. D. Abramoff, Meindert Niemeijer, M. A. Viergever, Bram van Ginneken Ridge-based vessel segmentation in color images of the retina IEEE
Author Total
Images
Sensitivity Specificity Accuracy
Li. Tang et. al.[2]
20 92% 91% 90%
YujiHatanaka et. al.[1]
125 80% 88% 86.29%
Akhilesh et. al[3]
10 Not
Specified
Not Specified
90%
S.B.Junior et. al.[16]
84 84.58% 92.45% 92.4%
Asra Ashraf et. al.[17]
462 87.69% 92.44% 91.8%
GarimaGupta et. al.[18]
191 82% Not
Specified Not Specified G.B.Kande
et. al.[19]
69 100% 91% Not
Specified Yuji hatanaka
et. al.[5]
119 85% 73% Not
Transactions on Medical Imaging, vol. 23, no. 4, pp. 501 -509, Apr. 2004
[15] Kovacs, L.; Qureshi, R.J.; Nagy, B.; Harangi, B.; Hajdu, A Graph based detection of optic disc and fovea in retinal images 4th International Workshop on Soft Computing Applications (SOFA), vol., no., pp.143,148, 15-17 July 2010
[16] S. B. Junior; D. Welfer Automatic detection of microaneurysms and hemorrhages in color eye fundus images International Journal of Computer Science & Information Technology (IJCSIT), vol., no., pp.21,37, 2013
[17] A. Ashraf, M. U. Akram and S. A. Sheikh Detection of retinal whitening, cotton wool spots and retinal Hemorrhages for diagnosis of Malarial Retinopathy TENCON 2015 - 2015 IEEE Region 10 Conference, Macao, 2015, pp. 1-5
[18] Gupta G, Ram K, Kulasekaran S, Joshi N, Sivaprakasam M, Gandhi R Detection of retinal hemorrhages in the presence of blood vessels Proceedings of the Ophthalmic Medical Image Analysis First International Workshop, OMIA 2014, vol., no., pp.105-112, 2014
[19] Kande GB, Savithri TS, Subbaiah PV. Automatic detection of microaneurysms and hemorrhages in digital fundus images. Journal of Digit Imaging. 2010 Aug;23(4):430-7
[20] L. Giancardo, F. Meriaudeau, T.P. Karnowski, Y. Li, K.W. Tobin Jr., E.Chaum Automatic retina exudates segmentation without a manually labelled training set International Symposium on Biomedical Imaging, Russian Federation (2011).
[21] A. Usman, S. Abbas, M. U. Akram, Y. Nadeem A Robust Algorithm for Optic Disc Segmentation from Colored Fundus images image analysis and Recognition, Lecture Notes in Computer Science, (Berlin, Heidelberg: Springer), LNCS, 2014 pp. 303-310, Portugal
[22] G. Joshi, Jayanthi Sivaswamy Color retinal image enhancement based on domain khowledge Color retinal image enhancement based on domain knowledge”. Sixth Indian conference on computer vision, graphics & image processing
[23] M. Niemeijer, B. V. Ginneken, J. Staal, M. S. Suttorp-Schulton and M.D. Abramoff Automatic detection of red lesions in digital color fundus photograph IEEE Trans Med Imaging, Vol. 24, No. 5, pp. 584-592
[24] R. M. Haralick Statistical and structural approaches to texture Proceedings of the IEEE, 67 (5), 1979.
[25] J. S. Weszka, C. R. Dyer and A. Rosenfeld A comparative study of texture measures for terrain classification IEEE Transactions on Systems, Man, and Cybernetics, SMC-6 (4), 269285, 1976
[26] O. R. Mitchell, C. R. Myers and W. Boyne A maxmin measure for image texture analysis IEEE Transactions on Computers, C-2 (4), 408414, 1977.