Development of a Multi-Agent Based Model
for Heterogeneous Traffic Flow Analysis
Naheem Olakunle Adesina1, Abiodun Alani Ogunseye 2,Akindele Opeyemi Areegbe3, Thomas Kokumo Yesufu4
1,2,3,4
Department of Electronic and Electrical Engineering, Obafemi Awolowo University, Ile-Ife, Nigeria.
Abstract: Vehicular traffic flow management is important to the economic well-being of any modern society. This work developed a multi-agent based traffic management model to ease traffic flow in a chaotic traffic environment. The developed model employed a multiagent based design principle in which vehicles are treated as interacting intelligent system in a typical road section. Aimsun® 6.1 software was used to obtain information about the traffic flow while the developed model was simulated using MATLAB® software.
The results showed that the vehicle speed is a major determinant of heterogeneous traffic flow. As the vehicular speed is increased, the region of transitions which occurred at the critical densities continued to shift leftward on the flow-density plot. This consequently resulted in predominantly more congested area than the free-flow region, implying that the traffic is becoming more congested. In conclusion, the inclusion of incomplete sets of topology had expanded the solution space that could be investigated which would give better information for traffic management.
Keywords — Heterogeneous traffic, multi-agent, routing table, vehicles. Traffic management.
I. INTRODUCTION
The quality of the traffic flow directly affects a city’s economy and the general well-being of the people. Traffic management is widely accepted as an important problem in modern society because it is responsible for keeping the flow of people, goods and services within cities. The knowledge of vehicle traffic flow characteristics such as speed, volume and density as well as the associated analytical techniques are essential requirements in the planning, design and operation of transportation systems [1]. It is evident, however, that this problem has not been satisfactorily addressed and, therefore, there is a need to create tools which allow us to study it and create solutions which would maximize the use and hence, the efficiency of a city’s road network or topology.
and hence, improved the level of service of bus transit. However, during the off peak periods, the bus lane has little impact on the level of service of the buses. Although, there was an improvement in bus transit during peak periods, there were adverse effects on the performance of adjacent lanes. On a similar vein, a research conducted on the impact of reserved bus lanes in Toronto, Canada showed that the performance of the average bus lane was improved but failed to conclude on the extent to which the performance of the adjacent lanes had deteriorated [3]. In addition, Tanariboriboon and Toonim in [4] determined the impact of the introduction of with-flow bus lanes on bus movement and car traffic on selected streets in the central part of the city of Bangkok, Thailand. The results showed that there is a large variation in the bus travel-time.
In [5], a framework was defined for road space reallocation in relation to transit priority. The framework aims to clarify the trade-offs required in developing transit priority systems in a range of traffic circumstances. Currie’s approach focused on ―people travel‖ and not ―vehicle travel‖. Minh et al. in [6] modelled bus lane priorities in a motorcycle environment in Hanoi, Vietnam using SATURN® software. In the mesoscopic simulation, the individual vehicle behaviour was not modelled, therefore the accuracy of the final result was affected. In [7], the behaviour of traffic in the congested part of the fundamental traffic diagram was explained using a single-line diagram. The free-flow section of the fundamental traffic diagram, which is the linear section at low densities, is fairly well-defined but the congestion region, which follows the point of maximal flow, displays wide scatter and hysteresis and is not clearly defined.
A. Application of Queuing Theory
For heterogeneous traffic, having an ideal capacity by lane is impossible because lane discipline is loose. Vehicles have varying static and dynamic characteristics and thus interact in a stochastic manner. They shared the same road space and moved by sharing the lateral as well as the linear lanes.
Queueing theory involves the use of mathematical models to study properties such as delay time or length of the queue and hence it provides a framework for assessing the efficiency of road management features and their performance. Tanner (1962) was the first to model an unsignalised road intersection using queueing theory [8]; the method has since been intensively used to study traffic behaviour at road intersections with and without traffic light. His approach has been improved subsequently, with many important contributions by Yeo and Weesakul in [9]. Moreover, it was shown in [10] that queueing models can also be used to explain uninterrupted traffic flows and thus offer a more practical approach, useful for sensitivity analysis and forecasts. In homogeneous traffic, traffic entities form one-dimensional queues as shown in Fig. 1a while heterogeneous traffic develops into mass queues which grow lengthwise as well as laterally as shown in Fig. 1b.
The remaining part of this paper is organized as follows: the methodology section describes the systematic and theoretical analysis of the method that was used to conduct this research and also provides an outline of the implementation of the MAS model; the results section highlights the outcomes of the method presented in the
methodology; and the conclusion section
summarizes the work and outlined its significance and contribution to the body of knowledge.
II. METHODOLOGY
A. Concept of multi-agent system
A multi-agent system (MAS) is a computerized system comprising of multiple interacting intelligent agents within an environment. It is also defined as the aggregate of agents, whose objective is to decompose a large system into several smaller systems which communicate with and coordinate one another [11]. Agent-based system technology has generated lots of excitement in recent years because of its promise as a new paradigm for
conceptualizing, designing, and implementing
software systems.
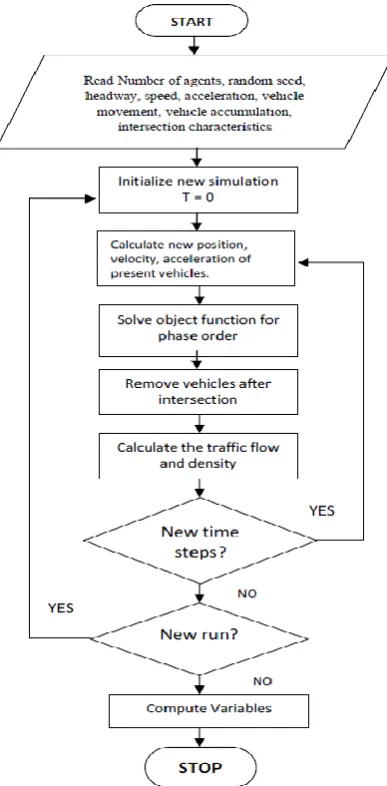
MAS paradigm was employed in this work to analyse traffic flow; a model using MAS was developed and was subsequently coded in Matlab® according to the flowchart shown in Fig. 2. Each vehicle was regarded as an agent that is situated in an environment and is also capable of taking autonomous actions to meet the design objectives. Traffic flow was viewed as a multi-agent system in this context because each vehicle interacts with other vehicles and the environment which is the road used in the traffic flow analysis. Usually, this behavior was captured in some set of rules which determine when a vehicle accelerates, decelerates or changes lane. In addition, these rules regulate how and when vehicles choose and change their routes according to their destinations and how they react to traffic and route information along the way.
In taking advantage of the multi-agent system, it is needful to understand the intent data in modelling of traffic scenarios and traffic flow by breaking it down to the fundamental single agent.
B. Vehicle Generation
Vehicle generation was based on a Bernoulli process at each traffic entry point. Individual entry points were associated with an insertion probability per time-step. Vehicles that failed to be inserted at an entry point were queued for possible insertion at a later time-step. Using Aimsun version 6.1traffic simulator package, vehicles were generated at each origin centroid and then inputted into the traffic network. Vehicles were then distributed along the network following the shortest paths between the origin and destination centroids. Finally, vehicles exited the network via the destination or sink centroid [12]. A sample of origin and destination matrix generated from traffic simulator software, Aimsun version 6.1, is shown in Fig. 3.
The number of trips (Tij) from zone i (3057) to j (3058) depends on the attractiveness of j as compared to other zones, the distance between the zones, travel cost friction factor and calibration
parameter. It can be concluded that the routes are equally loaded because the number of observed trips made through each route is the same.
Fig. 3: A sample of origin-destination matrix
C. Headway Generation
Space and time headways are some of the important parameters characterizing vehicle traffic and thus were considered in the traffic modeling. Space headway refers to the lateral distance between two consecutive vehicles. The time difference between two consecutive arrivals is defined as time headway. The time headway consists of two components: the occupancy time, which is the duration required for the vehicle to pass the observation point; and the time gap between the rear of the lead vehicle and the front of the following vehicle.
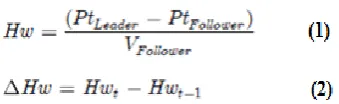
The expressions for time headways are shown in equations 1 and 2. The inter-arrival time or the time headway (Hw) of vehicle at a section on the road is not constant due to the stochastic nature of vehicle arrival and so, the headway was treated as a random variable.
D. Vehicle Movement
This section explains how the positions of all the vehicles in this study are updated using the formulated movement logic. If there was no slow vehicle immediately ahead, each vehicle was assumed to accelerate to its free speed or to the
speed limit specified for the road stretch, whichever was minimum.
If there was a slow vehicle in front, the possibility of overtaking the slow vehicle was explored. During this phase, the free longitudinal and transverse spacing available for the subject vehicle (fast moving vehicle), on the right and left sides of the vehicle in front (slow vehicle), were calculated. If the spacing was found to be adequate (at least equal to the movable distance of the vehicle intending to overtake plus the corresponding minimum spacing in the longitudinal direction and the minimum required lateral spacing in the transverse direction), an overtaking manoeuvre was performed. If overtaking was not possible, the fast vehicle decelerated to the speed of the slow vehicle in front and follows it. This was because the closer the fast vehicle was to the slow vehicle, the more sensitive the reactions of the fast vehicle would be to the actions of the slow vehicle. This sensitivity also increased with speeds.
Each vehicle updates other vehicles about its locations and also learns about the movement logic of other agents. It does this by creating a routing table for the entries of other agents. In the table, there are provisions for the initial and final positions, headways and velocities of each vehicle. Afterwards, vehicle movement logic, which represents a valid heterogeneous traffic data, was converted to discrete value using an appropriate sampling period. This was with a view to ensure that necessary traffic data were not left out, preventing a phenomenon called aliasing.
multi-agents were involved, it became essential to handle the interactions between the agents since each agent needed to take into account the actions of others for efficient action selection. Individual agent also needed some information about other agents in order to achieve a good coordination.
According to Raja and Klibanor in [13], a single agent can be modelled in state space as shown in equation 3:
where x represents the system state, u the model input and y the model output.
For multi-agent system the above equations can be modified as shown in Equations 4 and 5:
where N represents number of vehicles in a random seed, aij and bij are constants for a particular type of vehicle, xp and xv denote the vehicle’s position and velocity respectively.
This research work deals with the development of flow-density model using multi-agent system. This is because flow-density model has the ability to capture and accommodate all the possible scenarios of heterogeneous traffic which can be suitably modelled by multi-agent system. From equation 4, a
multi-agent system consists of dx/dt which denotes
flow and y, which can be represented as density. This makes multi-agent system adaptable to a lot of systems particularly flow-density modelling. Multi-agent system has been used for density-speed models but such models cannot be used to optimize the speed, which is the independent variable in the
model. However, flow-density models are
auspicious in optimizing speed but are mainly subjected to empirical data analysis which makes it difficult to understand.
E. Cooperative Adaptive Cruise Systems (CACC)
The Cooperative Adaptive Cruise Systems (CACC) which integrates the use of inter-vehicle
information that will assist vehicles in making better driving decisions, increasing both traffic efficiency and safety.
III.RESULTS
A. Flow-density at average and low spontaneous braking probabilities
This work deals with the development of
flow-density model using multi-agent system. This is because a flow-density model has the ability to capture and accommodate all the possible scenarios of heterogeneous traffic which can be suitably modelled with multi-agent systems. Furthermore, flow-density relationship is the most important factor that reflects traffic dynamics.Various plots of flow-density were obtained at
different spontaneous braking probabilities
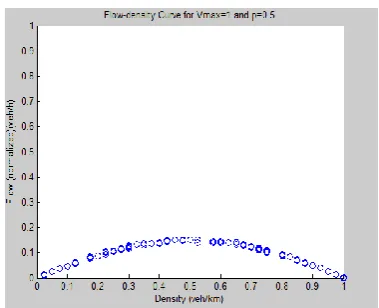
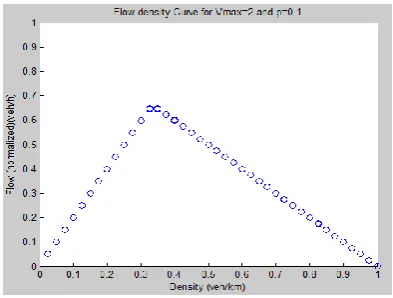
(p=0.1and p=0.5) as shown in Fig. 4 –Fig. 11. In each case, it was observed from the flow-density relationship that as the speed increased, the kurtosis (region of transition) continued to shift leftward. This consequently resulted in predominantly more congested area than free-flow region. Also, from the flow-density plots at p=0.5 and p=0.1, three distinct regions were observed for various values of maximum speed, Vmax. The first region is the free – flow region which occurred at 0 < K (instantaneous density) <Kc; the capacity or maximum flow region which occurred at Kc (critical density) and the congested flow region which occurred at Kc< K<Kjam (jam density). From the flow density plots, the traffic flow equalled zero at two points: firstly, at the origin because no vehicle was present (i.e K = 0); and also at Kjam because there was a large number of vehicles resulting in traffic jam and stand-still condition.
Fig. 5: Flow-density curve for Vmax=2 and p=0.5
Fig. 6: Flow-density curve for Vmax=3 and p=0.5
Fig. 7: Flow-density curve for Vmax=4 and p=0.5
Fig. 8: Flow-density curve for Vmax=1 and p=0.1
Fig. 9: Flow-density curve for Vmax=2 and p=0.1
Fig. 10: Flow-density curve for Vmax=3 and p=0.1.
Fig. 11: Flow-density curve for Vmax =4 and p=0.1
IV.CONCLUSION
therefore be a suitable aid for making timely decisions and judgments by traffic management systems.
REFERENCES
[1] Tiwari, G., Fazio, J., and Pavithravas, S. (2005). Passenger car units for heterogeneous traffic using a modified density method. Proceedings of 4th International Symposium on Highway Capacity, Mavi, Hawaii, pp. 246-257.
[2] Cox, A.M. (1975). Reserved bus lanes in Dallas, Texas. Journal of Transportation Engineering, 101 (4): 691-705.
[3] Shalaby, S.A. and Soberman, M.D. (1999).Effect of with flow bus lanes on bus travel times. Transportation Research Record, 7 (1433): 25- 30.
[4] Tanaboriboon, Y. and Toonim, S. (1983). Impact study of bus lanes in Bangkok .Journal of Transportation Engineering, 109 (2): 247-255.
[5] Currie, G., Sarvi, M. and Young, W. (2004).A comparative approach to balanced road space allocation in relation to transit priority.TRB Annual Meeting CD-ROM, Paper Number 04-3538.
[6] Minh. T., Frank, M., Paul, T. (2007)Modelling bus lane priorities in motorcycle environment using SATURN, Compendium of Papers CD-ROM, the 86th Annual
Meeting of the Transportation Research Board, Washinghton D.C., January 21-25.
[7] Edie, L. C. (1954), ―Traffic Delays at Toll Booths‖, Operations Research, 2(2): 107-138.
[8] Tanner, J. C. (1962). A theoretical analysis of delays at an uncontrolled intersection. Biometrika, 49 (1&2): 163-170
[9] Yeo, G. F. and Weesakul B. (1964). Delays of Road Traffic at an intersection. Journal of Applied Probability, 1(2): 297-310.
[10] Vandaele N., et al (2000). Modeling traffic flows with queuing models. Asia-Pacific Journal of Operational Research, 24(4): 435-447.
[11] Multi-agent system. (n. d.). In Wikipedia. Retrieved January 22, 2017, from https:/en.wikipedia.org/wiki/multi-agent system.
[12] Aimsun Version 6 User’s manual (2008) TSS – transport simulation system, Barcelona, Spain, www.aimsun.com.
[13] Raja, Z., Klibanor, M. (2004). Numerical treatment of nonlinear Emden-Fowler equation using stochastic technique. Journal of Annals of Mathematics and Artificial Intelligence, 63(2): 185-207.