M E T H O D O L O G Y
Open Access
A feature selection method based on
multiple kernel learning with expression
profiles of different types
Wei Du
1, Zhongbo Cao
1,3, Tianci Song
1, Ying Li
1*and Yanchun Liang
1,2** Correspondence:[email protected];
1College of Computer Science and Technology, Key Laboratory of Symbol Computation and Knowledge Engineering of the Ministry of Education, Jilin University, Changchun, 130012, China
Full list of author information is available at the end of the article
Abstract
Background:With the development of high-throughput technology, the researchers can acquire large number of expression data with different types from several public databases. Because most of these data have small number of samples and hundreds or thousands features, how to extract informative features from expression data effectively and robustly using feature selection technique is challenging and crucial. So far, a mass of many feature selection approaches have been proposed and applied to analyse expression data of different types. However, most of these methods only are limited to measure the performances on one single type of expression data by accuracy or error rate of classification.
Results:In this article, we propose a hybrid feature selection method based on Multiple Kernel Learning (MKL) and evaluate the performance on expression datasets of different types. Firstly, the relevance between features and classifying samples is measured by using the optimizing function of MKL. In this step, an iterative gradient descent process is used to perform the optimization both on the parameters of Support Vector Machine (SVM) and kernel confidence. Then, a set of relevant features is selected by sorting the optimizing function of each feature. Furthermore, we apply an embedded scheme of forward selection to detect the compact feature subsets from the relevant feature set.
Conclusions:We not only compare the classification accuracy with other methods, but also compare the stability, similarity and consistency of different algorithms. The proposed method has a satisfactory capability of feature selection for analysing expression datasets of different types using different performance measurements.
Background
With the development of transcriptomics research, especially the widely used high-throughput microarray chip and RNA sequencing technology, a large number of tran-scriptome data have been obtained by measuring the expressions of genes or miRNAs simultaneously. Researchers can acquire these different expression data from several public databases, such as Gene Expression Omnibus (GEO) [1], Stanford Microarray Database (SMD) [2], ArrayExpress [3] and The Cancer Genome Atlas (TCGA) [4]. TCGA is the largest cancer genome sequencing project, which plan to sequence and organize 10,000 cancer genomes, along with other matching omics data types, covering 25 cancer types [5]. Developing effective and robust methods to extract the subset of
informative features from expression data remains a challenge and crucial problem. Feature selection technology has been studied and applied proverbially in pattern recogni-tion, statistics analysis, data mining and machine learning [6]. In the last decade, feature selection technology has become an important tool for expression data analysis in the field of bioinformatics, such as cancer classification, biological network inference, expres-sion correlation analysis and disease biomarker identification [7]. The features (mRNAs or miRNAs) of given expression data can be broadly categorized into three major types: relevant features, redundant features and irrelevant features [8].
In general, most feature selection methods can be divided into three categories: filter methods, wrapper methods, and embedded methods [7]. These categories depend on the combination modality of feature selection search and the construction of the clas-sification model. Filtering methods, which are independent of the classifier, select relevant features only dependent the intrinsic properties of expression data. Glaab et al. applied an ensemble filter method which combines several selection schemes to an ensemble feature ranking [9]. Cai et al. proposed a feature weighting algorithm to es-timate the feature weights through local approximation rather than global measure-ment. Experimental results on both synthetic and real microarray datasets validated that the algorithm was effective, when combining the proposed method with classic classifiers [10]. Cao et al. proposed a filtering feature selection method for paired microarray expression data analysis [11].
In wrapper approaches, the classification scores for features by a classifier are mea-sured in the selection process and the step of feature selection depends on the classi-fier. So far, many wrapper feature selection methods have been proposed and used for expression data analysis. Mukhopadhyay et al. combined a multi-objective genetic algo-rithm and SVM classifier as a wrapper for evaluating the chromosomes that encode miRNA feature subsets [12]. Maulik et al. presented a fuzzy preference based rough set method for feature selection from gene expression data of microarray. Compared with signal-to-noise ratio and consistency based Feature Selection methods, experimental results showed that the method was effective in extracting gene markers [13].
Recursive Feature Extraction (RFE) algorithm, which can effectively eliminate most of the irrelevant, redundant and noisy genes, and select informative genes in different stages [8]. Niijima et al. suggested a recursive feature elimination model based on Laplacian linear discriminant analysis for feature selection [19]. However, these methods based on RFE may obtain satisfactory performance on hundreds of features. Such a large number of fea-tures (mRNAs or miRNAs) are difficult to apply to several fields, such as clinical diagnosis of cancer or experiments of identifying cancer biomarkers.
In recent years, several hybrid feature selection approaches have been also pro-posed for expression data analysis. Chuang et al. propro-posed a feature selection method, which combines an improved particle swarm optimization with the K-nearest neighbor method and support vector machine classifiers [20]. Mundra et al. developed a hybrid feature selection method by combining the filter method of minimum-redundancy maximum-relevancy (MRMR) and the wrapper method of support vector machine recursive feature elimination (SVM-RFE) [21]. Du et al. proposed a multi-stage feature selection method for microarray expression data analysis [22].
Though most of above methods can eliminate the irrelevant genes and rank informative genes effectively, they are only suitable for expression data from one type of expression profile. Most of the above methods construct the feature selection model based on one type of expression data directly, but they rarely consider the effectiveness and stability on expression data from different types of transcriptome. In this paper, we propose a novel two-stage feature selection method which uses multiple kernel learning (MKL) [23, 24] combines a forward feature selection procedure to select the relevant feature subset, eliminate redundant features and select compact feature subsets. We simplify our proposed method as Simple MKL-Feature Selection (SMKL-FS), which eliminates irrelevant features and selects relevant features by the score of individual feature, and eliminates redundant features by the forward selection procedure in two stages.
One objective of feature selection is to avoid overfitting and improve the performance of classifier [7]. Overfitting is one of challenging problems on gene expression data which have characteristic of high dimensional and small sample. So, we used following processing to decrease the influence of overfitting on small samples. Firstly, we use the SimpleMKL method, which solves the MKL problem through a primal formulation involving a weighted l2-norm regularization. The regularization part adds a cost term for bringing in more features with the objective function. Hence, regularization can shrink the coefficients of many variables to zero and decrease the overfitting. Secondly, we used a sequential forward selection (SFS) method which belonged to deterministic methods and have lower overfitting risk than randomized methods [7]. In addition, we used cross validation in performance measurement part to identify these methods, which may have poor performance caused by overfitting training on several datasets.
the classification error of the dependent classifiers, we use optimizing function of MKL instead of classification error to carry out the embedded process. The idea of this process is similar as the minimum-redundancy process in mRMR [25]. Except for evaluating the classification accuracy of the method, we measure the performances of different feature selection algorithms through measuring the stability of feature space on different samples in the same type of data, the similarity with other methods and consistency between expression data of miRNA and mRNA.
The main characteristics of our proposed algorithm include: (i) a novel feature selection method for identifying gene signatures based on multiple kernel learning focusing on multiple types of expression data, such as mRNA microarray, mRNA sequencing and miRNA sequencing; (ii) an evaluattion performance of different methods by using classifi-cation accuracy, stability of feature space, similarity with other methods and consistency between expression data of miRNA and mRNA. Experimental results show that the pro-posed method has a satisfactory capability of feature selection for different expression datasets analysis compared to other state of art feature selection approaches.
Results
For measuring the performance of embedded method, we use three kernel functions,
linear kernel K(xi,x) = (xi,x), radial basis function kernel K xið ;xÞ ¼ exp −kxi−xk
2
2
and
polynomial kernel K(xi,x) = [(xi,x) + 1]2. In a practical application, different kernels can
combined. The features are selected and evaluated using 10-fold Cross-Validation (CV) on a variety of datasets through different feature selection methods including SVM-RFE [26], SVM-RCE [18], mRMR [25], IMRelief [10], SlimPLS [27] and SMKL-FS. We measure the performances of different feature selection algorithms through evaluating the classification accuracy of feature combination, also measuring the stability of feature space on different samples in the same type of data and the similarity with other methods.
Data sources and pre-processing
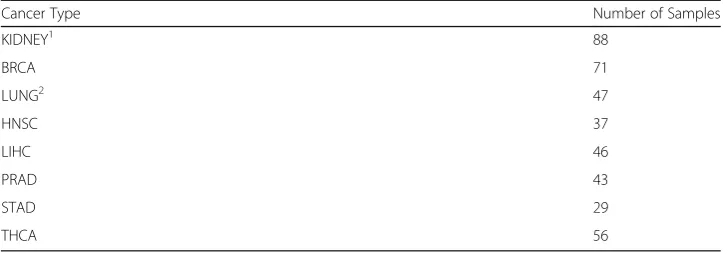
In this paper, three types of expression data are used to measure the performance of feature selection methods. We only use the paired samples in expression datasets which include tumor and adjacent non-tumor tissues. The datasets of mRNA microarray are obtained from Gene Expression Omnibus (GEO) [1], the datasets of mRNA sequencing and miRNA sequencing are downloaded from The Cancer Genome Atlas (TCGA) [4]. Eight types of cancer on microarray datasets are used in this article, and each type of cancer contains several datasets (series in GEO). Table 1 gives the more detailed infor-mation of the eight cancer types of mRNA microarray datasets from GEO and Table 2 shows the more detailed information of the eight cancer types from TCGA.
are normalized by median absolute deviation (MAD) method to make all the samples have similar background [29]. The normalization of different microarrays is applied by housekeeping gene as performed in previous article [30].
Performance measurement of feature space
The performance measurement of feature space is important for evaluating different feature selection algorithms. Most of the state of art algorithms only validate their per-formance through the classification accuracy [26] or classification error [31] on selected feature set by a classifier C. The classification accuracy and classification error are defined as follows respectively:
Accuracy¼ TPþTN
FNþTPþTNþFP
Classification Error¼ FNþFP
FNþTPþTNþFP
ð1Þ
whereTPis the number of true positives,TNis the number of true negatives,FPis the number of false positives, and FN is the number of false negatives. However, only computing the classified ability of selected features could not reflect the performance of feature selection algorithms roundly.
In this paper, we measure the performances of different feature selection algorithms through evaluating the classification accuracy of single features and features combin-ation, also measuring the stability of feature space on different samples in the same type of data, the similarity with other methods and consistency between expression
Table 1The detailed information of mRNA microarray datasets
Cancer Type Datasets ID Number of Samples
Liver GSE5364, GSE22058, GSE14520, GSE12941 132
Pancreatic GSE15471, GSE16515, GSE22780 63
Lung GSE5364, GSE19804, GSE22058, GSE10072, GSE7670, GSE2514 249
Colon GSE5364, GSE8671, GSE25070, GSE21510, GSE23878, GSE18105 70
Gastric GSE13911, GSE13195, GSE5081, GSE19826 93
Breast GSE5364, GSE15852, GSE10810, GSE16873, GSE5764, GSE14548 113
Thyroid GSE5364, GSE3678 23
Prostate GSE6919, GSE6956, GSE17951 88
Table 2The detailed information of mRNA Sequencing and miRNA Sequencing datasets
Cancer Type Number of Samples
KIDNEY1 88
BRCA 71
LUNG2 47
HNSC 37
LIHC 46
PRAD 43
STAD 29
THCA 56
data of miRNA and mRNA. We select and evaluated features using 10-fold Cross-Validation (CV) on these datasets mentioned above through different feature selection methods, SVM-RFE [26], SVM-RCE [18], mRMR [25], IMRelief [10], SlimPLS [27], OSFS [32], FGM [33] and our method SMKL-FS. Firstly, for each testing dataset, we randomly selected 90% as training dataset and other 10% as test dataset. Repeating the selection process 10 times, we can obtain a collection of 10 groups contained training and test samples. In order to ensure fairness, we select feature subset using each feature selection method on training samples of the same 10 groups. Then, for the ten selected features from different methods, we evaluate them according to the above criterions.
Classification accuracy of features combination
For two feature setsS1
n andS
2
n, and the above classifierC, we consider the feature space ofS1n is moreeffective, if the classification accuracy on feature setS1n is higher than that
on S2n by using classifier C. If the methodM1generates a series of feature subsets in
S1
n :S
1
1⊂S12⊂…S1n−1⊂S1nand the methodM
2
generates a series of feature subsets inS2
n :S
2 1
⊂S22⊂…S2n−1⊂Sn2. For eachk(1≤k≤n), we compute the classification accuracy onSk1and Sk2as same as [8]. If the average of these classification accuracies on S1n is higher than
that on S2n, we consider the methodM1is better thanM2inmean effectiveness. If the
maximum of these classification accuracies onS1n is higher than that onS2n, we consider the methodM1is better thanM2inmax effectiveness.
In our verification, we set thenof feature setS1n as 10, and compare theeffectiveness
of feature spaces from different methods using SVM classifier. For the feature subsets inS110 :S
1
1⊂S12⊂…S19⊂S110 generated by methodM
1
, we compute the classification accur-acy on Sk1for everyk(1≤k≤10). Then themean effectiveness andmax effectiveness
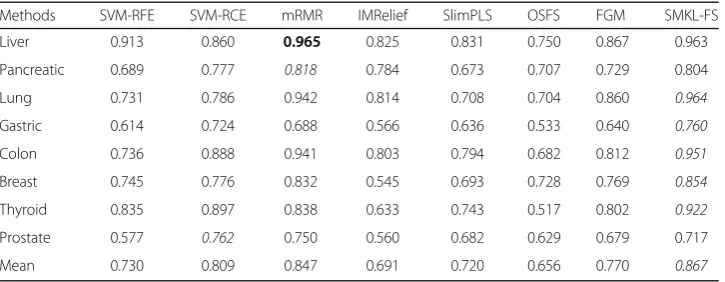
of methodM1are measured by the average and maximum classification accuracies on S110. The results of mean effectivenessand max effectivenesson three types of data-sets through different methods are shown in Tables 3, 4 & 5 and Additional file 1: Table S1, respectively.
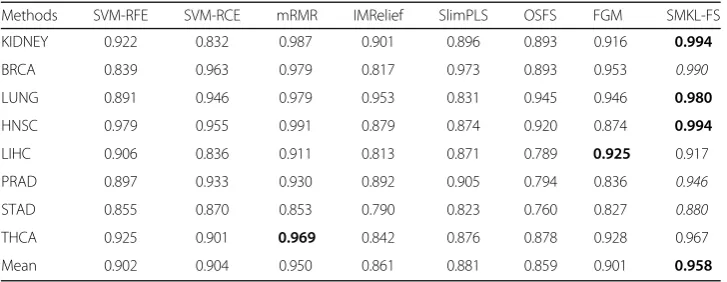
The mean effectiveness and max effectiveness of SMKL-FS are better than those from other methods for most datasets of miRNA sequencing, mRNA microarray data and little less than mRMR on mRNA sequencing data. The good performance of mRMR [25] on gene expression data may attribute to the method designed specifically
Table 3The results of mean effectiveness on mRNA microarray (top 10)
Methods SVM-RFE SVM-RCE mRMR IMRelief SlimPLS OSFS FGM SMKL-FS
Liver 0.913 0.860 0.965 0.825 0.831 0.750 0.867 0.963
Pancreatic 0.689 0.777 0.818 0.784 0.673 0.707 0.729 0.804
Lung 0.731 0.786 0.942 0.814 0.708 0.704 0.860 0.964
Gastric 0.614 0.724 0.688 0.566 0.636 0.533 0.640 0.760
Colon 0.736 0.888 0.941 0.803 0.794 0.682 0.812 0.951
Breast 0.745 0.776 0.832 0.545 0.693 0.728 0.769 0.854
Thyroid 0.835 0.897 0.838 0.633 0.743 0.517 0.802 0.922
Prostate 0.577 0.762 0.750 0.560 0.682 0.629 0.679 0.717
for this type of data. We also see that FGM [33] is the best common method, which has satisfactory performance on different type of gene expression data. The results of accuracy of each S11,S21,…,S91,S101 on three types of datasets for different methods are shown (See Additional file 2: Figure S1, Additional file 3: Figure S2 and Additional file 4: Figure S3), respectively. In each subgraph, the X-axis represents different feature sets S11,S21,…,S91,S101, and the Y-axis represents accuracy of each set. For two given feature selection methodsM1andM2, if the area under the curve ofM1is larger than that of M2,M1is better thanM2.
For comparing the performances of the methods using multiple kernels with the method using single kernel, the individual usage and different combination of three
ker-nels, linear kernel K(xi,x) = (xi,x), radial basis function kernel K xið ;xÞ ¼ exp −kxi−xk
2
2
and polynomial kernelK(xi,x) = [(xi,x) + 1]2are conducted. The results ofmean effective-ness and max effectivenesson three types of datasets are shown (see Additional file 5: Table S2). In Additional file 5: Table S2, the method using different individual kernels affect the results weakly, and the method using multiple kernels has the best results among the majority of the datasets.
In a practical application, the first step can be skipped. However, because of the existing irrelevant features, when only using the second step, the results are not always better than those after removing the irrelevant features, and meanwhile the process has high com-putational complexity. Considering the comcom-putational complexity, we only test the
Table 4The results of mean effectiveness on mRNA Sequencing (top 10)
Methods SVM-RFE SVM-RCE mRMR IMRelief SlimPLS OSFS FGM SMKL-FS
KIDNEY 0.912 0.952 0.965 0.949 0.898 0.914 0.951 0.957
BRCA 0.938 0.982 0.973 0.953 0.871 0.934 0.928 0.984
LUNG 0.957 0.977 0.993 0.932 0.942 0.867 0.931 0.997
HNSC 0.930 0.949 0.983 0.908 0.844 0.900 0.977 0.948
LIHC 0.893 0.937 0.962 0.919 0.900 0.798 0.952 0.958
PRAD 0.932 0.928 0.971 0.893 0.779 0.764 0.966 0.953
STAD 0.907 0.895 0.970 0.945 0.758 0.848 0.898 0.963
THCA 0.945 0.954 0.975 0.933 0.883 0.844 0.903 0.970
Mean 0.927 0.947 0.974 0.929 0.859 0.859 0.938 0.966
Table 5The results of mean effectiveness on miRNA Sequencing (top 10)
Methods SVM-RFE SVM-RCE mRMR IMRelief SlimPLS OSFS FGM SMKL-FS
KIDNEY 0.922 0.832 0.987 0.901 0.896 0.893 0.916 0.994
BRCA 0.839 0.963 0.979 0.817 0.973 0.893 0.953 0.990
LUNG 0.891 0.946 0.979 0.953 0.831 0.945 0.946 0.980
HNSC 0.979 0.955 0.991 0.879 0.874 0.920 0.874 0.994
LIHC 0.906 0.836 0.911 0.813 0.871 0.789 0.925 0.917
PRAD 0.897 0.933 0.930 0.892 0.905 0.794 0.836 0.946
STAD 0.855 0.870 0.853 0.790 0.823 0.760 0.827 0.880
THCA 0.925 0.901 0.969 0.842 0.876 0.878 0.928 0.967
performance by only using the second step on miRNA datasets. The results are shown in Additional file 6: Table S3. From the table, we can see that the results of only using the second step are not better than those filtering some features in the first step, and meanwhile using all features the second step has high computational complexity.
Stability of feature space
The stability of feature space generated from a feature selection algorithm reflects the ro-bustness of the method on different samples of the same type of data [34]. For a list of fea-ture setsS11
n ;S
12
n ;…;Sn1k generated by methodM 1
on different samplesΩ1,Ω2,…,Ωk(each
Ωis a subset ofX) of datasetDand another list of feature setsS21n ;S22n ;…;Sn2k generated by method M2 on samples Ω1,Ω2,…,Ωk. Let I1¼ S11n ∩S12n ∩;…;∩Sn1k
n o
, U1
¼ S11n ∪S
12
n ∪;…;∪Sn1k
n o
and I2¼ S21n ∩Sn22∩;…;∩Sn2k
n o
, U2¼ S21n ∪Sn22∪;…;∪Sn2k
n o
. If
I1
j j
U1
j j is larger than
I2
j j
U2
j j , we consider the methodM
1
is better thanM2inunion stability
of feature space. For every two samples Ωi,Ωj∈{Ω1,Ω2,…,Ωk}, let R1ij¼Sn1i∩Sn1j=
Sn1i∪Sn1j
andR2ij ¼Sn2i∩Sn2j=Sn2i∪Sn2j, if the average ofR1ij is larger than the average of R2ij, the methodM
1
is better thanM2inindependent stabilityof feature space. In our verification, we set then of feature sets S11n ;Sn12;…;Sn1k and feature sets S
21
n ;
S22n ;…;Sn2k to 100 and use 10-fold cross validation to measure the stability of the fea-ture lists generated by different feafea-ture selection methods. Firstly, we randomly choose 90% of the paired samples from each dataset and iterate this process 10 times to obtain 10 different sets for each dataset. Then different feature selection methods are used to select these feature lists. Furthermore, we compute the union stability andindependent stabilityaccording to the process mentioned above.
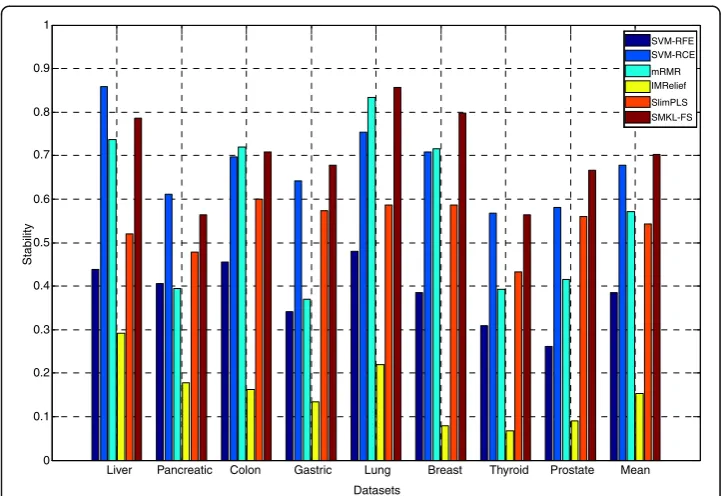
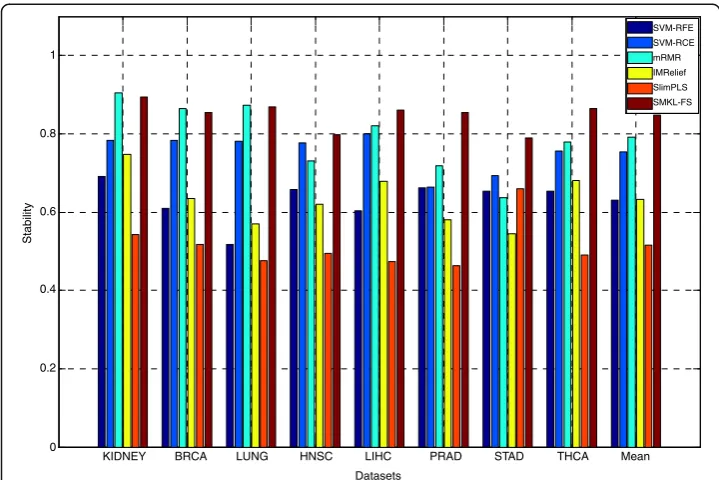
The results of union stability on three types of datasets through different methods are shown (See Additional file 7: Table S4). From Additional file 7: Table S4, the union stabilityof SMKL-FS is better than those from other methods on most datasets. The results of independent stabilityon three types of datasets through different methods are shown in Figs. 1, 2 and 3, respectively. In Figs. 1, 2, 3, the X-axis represents different datasets, and the Y-axis represents independent stability. Theindependent stability
results of SMKL-FS are better than those from other methods on most datasets.
Similarity with other methods
The similarity between the feature space generated from one feature selection algo-rithm and the feature lists generated by other methods can be used to estimate the availability of the algorithm. For the feature set S1
n generated by methodM 1
of dataset
D and other feature sets S2n;…;S
k
n generated by methods M 2
,M3,…,Mk of the same
dataset D. Let I1¼S1n∩S2n, I2¼ S1n∩S3n
n o
,…, Ik−1¼S1n∩Skn, and Imean¼k−11
X
j¼1k−1 Ij.
If the Imean of one method is larger than other methods, the method is better than
other methods inSimilarity.
In our verification, we setnof feature setS1n to 100. Firstly, we select the feature sets
SMKL-FS, respectively. Then, for each feature set generated by every method on one dataset, the value Imeanis calculated according to the process mentioned above. The
results of similarityon three types of datasets through different methods are shown in Tables 6, 7 and 8. The similarity results of SMKL-FS are better than those from other methods on most datasets.
1
0.9
0.8
0.7
0.6
0.5
Stability
0.4
0.3
0.2
0.1
0
Liver Pancreatic Colon Gastric Lung
Datasets
SVM-RFE SVM-RCE
mRMR IMRelief
SlimPLS SMKL-FS
Breast Thyroid Prostate Mean
Fig. 1The results of independent stability on different mRNA microarray datasets
1
0.9
0.8
0.7
0.6
0.5
Stability
0.4
0.3
0.2
0.1
0
KIDNEY BRCA LUNG HNSC LIHC
Datasets
SVM-RFE SVM-RCE
mRMR IMRelief
SlimPLS SMKL-FS
PRAD STAD THCA Mean
Methods
Brief review of SVM
Several supervised learning methods, such as Support Vector Machines (SVMs) can be used to analyze data and recognize patterns by classification and regression analysis. The standard SVM algorithm was proposed by Cortes and Vapnik in 1995 [35]. Given
a sample set of data points G¼ !xi; ;yi
n
i¼1, !xi∈Rm and yi∈{+1,−1}, the decision
rule is:
SVMð Þ ¼x sign X N
i¼1
αiyiK xð i;xÞ þb
!
ð2Þ
whereyiis the class label of the samplexiand the summation is taken over all the training samples.αiis the Lagrange multipliers involved in maximizing the margin of separation of the classes. K(xi,x) is a kernel which can map the feature space to a high dimensional
1
0.8
0.6
Stability
KIDNEY BRCA LUNG HNSC LIHC
Datasets
PRAD STAD THCA Mean SVM-RFE
SVM-RCE
mRMR
IMRelief
SlimPLS
SMKL-FS
0.4
0.2
0
Fig. 3The results of independent stability on different miRNA Sequencing datasets
Table 6The results of similarity on mRNA microarray
Methods SVM-RFE SVM-RCE mRMR IMRelief SlimPLS SMKL-FS
Liver 6.33 1.17 15.83 1.33 1 15.17
Pancreatic 4.67 0.83 11.17 1.83 3 16.83
Lung 3.83 21.83 20.67 0.17 2.17 23
Colon 7.17 0.67 19.17 0.67 2.67 22.67
Gastric 3.83 0.83 16.00 0.50 3.50 20.50
Breast 9.83 32.83 31.83 0 1.67 33.83
Thyroid 10.83 29.00 20.17 0 1.67 29.33
Prostate 5.50 27.50 20.00 0.50 1.17 29.17
space. There are several popular kernels, such as linear kernelK(xi,x) = (xi,x), radial basis function kernels K xð i;xÞ ¼ exp −kxi−xk
2 σ
, homogeneous kernels K(xi,x) = (xi,x)d and inhomogeneous polynomial kernelsK(xi,x) = [(xi,x) + 1]d. After obtaining the α, we can predict the label of a new data point by the following formula [36]:
f zð Þ ¼X
n
i¼1
αiyiK xð i;zÞ þb ð3Þ
and the biasbis defined:
b¼−1
2 fimaxjyi¼−1g
Xn
j¼1
αjyjK xi;xj
!
þ min ijyi¼þ1
f g
Xn
j¼1
αjyjK xi;xj
!
" #
ð4Þ
Multiple kernel learning (MKL)
In recent years, several multiple kernel learning (MKL) methods have been proposed to enhance the interpretability of the decision function and improve performances [23, 24]. A convenient approach of MKL is to construct the kernelK(xi,x) as a convex
combination of basis kernels [23]:
K xð i;xÞ ¼
XM
m¼1
dmKmðxi;xÞ; with dm≥0;
XM
m¼1
dm ¼1 ð5Þ
whereM is the number of multiple kernels. The kernelKmmay be the popular kernels
Table 7The results of similarity on mRNA Sequencing
Methods SVM-RFE SVM-RCE mRMR IMRelief SlimPLS SMKL-FS
KIDNEY 1.33 8.00 11.00 2.83 1.67 12.00
BRCA 5.67 16.83 14.83 3.67 0.83 17.83
LUNG 6.50 23.17 11.50 2.83 0.67 26.67
HNSC 1.17 24.17 11.67 2.50 1.17 23.00
LIHC 9.50 26.67 17.50 1.33 2.33 29.33
PRAD 9.83 26.67 19.17 3.33 0.83 30.00
STAD 7.83 29.67 15.17 16.67 0.33 29.50
THCA 5.17 14.33 12.50 4.83 0.50 16.00
Mean 5.88 21.19 14.17 4.75 1.04 23.04
Table 8The results of similarity on miRNA Sequencing
Methods SVM-RFE SVM-RCE mRMR IMRelief SlimPLS SMKL-FS
KIDNEY 43.00 33.00 48.50 29.17 28.00 51.00
BRCA 39.67 39.33 50.83 25.83 33.00 52.33
LUNG 41.50 38.83 50.17 29.50 21.67 53.33
HNSC 42.17 38.83 50.50 32.50 22.50 53.67
LIHC 42.33 35.50 46.50 24.67 25.17 47.67
PRAD 42.33 40.33 53.17 27.00 30.83 54.33
STAD 43.50 35.33 48.83 28.67 20.67 53.33
THCA 37.33 37.50 47.50 26.50 25.50 50.83
mentioned above with different parameters. Each single kernel Km can either use the full set of training samples or subsets of these samples from different data sources. Then, the problem of the model is transferred to the choice of the weightsdm.
Actually, the standard primal MKL formulation, which just learns from objective con-sisting of a simple summation of base kernels subjected to mix-norm regularization, is expressed in a functional form as:
min f;b;ξ 1 2 X m fm
k kH
m
!2
þCX
i
ξi s:t:yi
X
m
fmð Þ þxi b
!
≥1−ξi; ∀i ξi≥0∀i ð6Þ
where fmis a function that belongs to corresponding Hilbert space Hm, and each Hil-bert spaceHmendowed an inner product〈⋅,⋅〉mhas a unique kernelKm.
However, k kfm Hm is not differentiable. When fm= 0, it leads to original objective
function, which is not smooth. In this article, we apply SimpleMKL [23] that uses a weighted l2norm regularization to calculate the upper bound of the problem through Cauchy-Schwartz inequality. The primal formulation can be replaced as:
min f;b;ξ;d
1 2
X
m 1
dm fm
k k2
Hm
þCX
i
ξis:t:yi
X
m
fmð Þ þxi b
!
≥1−ξi; ∀iξi≥0∀iX m
dm¼1; dm≥0; ∀m ð7Þ
And the corresponding dual problem is given as follows
max α
X
i αi‐ 1
2
X
i;j
αiαjyiyj
X
m
dmKm xi;xj
s:t:X
i
αiyi¼0 0≤αi≤C; ∀i ð8Þ
where α and C are Lagrange multipliers of the constrains which related to each data point and their tolerable errors separately.
Note that our new dual objective function is convex and differentiable with respect to α. At each iteration, firstly the coefficients keep unchanged, and the value of object-ive function is optimized. Then, the coefficients are recovered and updated with above dual variables, and this process repeats until convergence.
Feature selection algorithm
Selecting the relevant feature set
Firstly, we apply MKL to select the relevant feature set. To implement MKL approach, we select the SimpleMKL method in [23] to obtain the coefficientdmof the kernel
combin-ation . SimpleMKL used an iterative gradient descent process to perform an optimizcombin-ation both on the parameters of the SVM (αi) and the kernel coefficients (dm). There are several
kernels can be used, such as linear kernel K(xi,x) = (xi,x), radial basis (RBF) function
kernelK xið ;xÞ ¼ exp −kxi−xk2
2σ2
and polynomial kernelsK(xi,x) = [(xi,x) +c]d.
Then the optimal objective function is defined as follows:
J ¼ min dm
max
α Wðα;dmÞ such that
XM
m¼1
dm¼1 ; dm≥0 ð9Þ
Using SimpleMKL, we can obtain theJvalue for each feature from the total feature set Sin the process of optimizing W(α,dm) via mindm maxαWðα;dmÞ. To select the relevant feature set, the J list for features list is computed to measure the relevance between features and samples. Finally, we sort the J list in ascend and obtain the ranked features listSr. Then, the topn* features are selected and the feature setSn is
obtained. The process of selecting the relevant feature set is defined (See Additional file 8: Table S5).
Selecting compact feature subsets
An embedded scheme of the sequential forward selection is utilized to search the compact feature subsets from the relevant feature set Sn. In general, the wrapper
approaches convolve with a classifier (e.g., SVM) and the goals are to minimize the classification error of the dependent classifiers. These wrapper approaches can usually obtain low classification error for their dependent classifiers. However, they have high computational complexity and the selected features are less generalization to classi-fiers [31]. We use the following formula instead of classification error to carry out the embedded process.
JZ¼ min
dm max
α
Xn
i¼1
αi−1 2
X
i;j
αiαjyiyj
XM
m
dmKm xZi;xZj
!
ð10Þ
whereZis the set containing the selected features, such asZ= {f1,f2,…,fn}. In this article, the JZis calculated by using SimpleMKL method [23], which solves the MKL problem through a primitive formulation involving a weighted l2-norm regularization [23].
Then, a forward process is used to to select the subset withrfeatures fromSnby the
incremental manner. And initially, the score of J0is set to +∞ and the subsetZ is set to empty. We search each feature in the feature subset, such asf1,f2,…,fn, and compute
Discussion and conclusions
With the development of high-throughput microarray chip and RNA sequencing technology, we can obtain a large number of expression data with different types. The researchers can acquire these data from several public databases, such as GEO, SMD, ArrayExpress and TCGA. However, because the transcriptomics experiments have high cost, most of these data have samples with small size and tens thousands genes or hundreds miRNAs. How to extract informative features from expression data effectively and robustly is a challenging and crucial problem for expression data analysis. Feature selection technique had been widely applied to select a subset of relevant features and eliminate redundant, irrelevant and noisy features.
In general, most feature selection methods can be divided into three categories: filter, wrapper and embedded. Filter methods independent of the classifier, select relevant features only relying on the intrinsic properties of expression data. Filter methods contain two subclasses: univariate and multivariate. Univariate methods are processed by filtering single feature and multivariate methods are used to select features by consider-ing combination of features. The advantages of univariate methods are fast, scalable and independent of the classifier, and the disadvantages of these methods are thoughtlessness of feature dependencies and ignoring the interaction with the classifier. The advantages of multivariate methods contain: feature dependencies, independent of the classifier and better computational complexity than wrapper methods. But the multivariate methods are slower and less scalable than univariate methods. Wrapper approaches, which can be divided into deterministic and randomized types, generate the scores for features and select them based on the classifier. The deterministic methods, which are simple, have less computational complexity and more risk of over fitting than randomized methods. But they are more prone to get a result of local optimum than randomized methods. Embedded approaches, which have lower computational complexity than wrapper methods, select optimal feature subset based on classifier construction in the combined space of feature subsets and hypotheses.
Most of above methods construct the feature selection model on individual expres-sion data simply, and they rarely consider the effectiveness and stability on expresexpres-sion data from different type of expression data. In order to overcome the disadvantages of above methods, a hybrid feature selection method based on multiple kernel learning is proposed. We evaluate performance of method on expression dataset of different types. Except for comparing the classification accuracy with other methods, we also compare the performances of different algorithms through measuring the stability, similarity and consistency. The experimental results show that the proposed method has a satisfactory capability of feature selection for different expression datasets analysis.
controlling the number of iterations on iterative method. Pruning methods, which re-move the nodes with little predictive power, are used for several methods based on tree. In this article, we used regularization and sequential forward selection method to decrease the influence of overfitting on small sample size. With the lower price of Mircoarray and RNA sequencing, the samples are more and more obtained from individual experiment, such as the new experiment of RNA sequencing on single-cell, which can handle more than 4000 samples [37]. So, in the future, the influence of overfitting on expression data analysis will be getting smaller and smaller, and machine learning methods and kernel methods will be better used with these data.
Additional files
Additional file 1: Table S1.The results of max effective on mRNA microarray, mRNASeq and miRNASeq datasets. (XLSX 11 kb)
Additional file 2: Figure S1.Classification accuracy of features combination on different mRNA microarray datasets. (PDF 77 kb)
Additional file 3: Figure S2.Classification accuracy of features combination on different mRNASeq datasets. (PDF 61 kb)
Additional file 4: Figure S3.Classification accuracy of features combination on different miRNASeq datasets. (PDF 52 kb)
Additional file 5: Table S2.The results of mean and max effective by different kernel. (XLSX 12 kb)
Additional file 6: Table S3.The results of mean and max effective by using step one. (XLSX 8 kb)
Additional file 7: Table S4.The results of union stability. (XLSX 11 kb)
Additional file 8: Tables S5 and S6.The pseudo code of proposed algorithm. (DOCX 50 kb)
Abbreviations
GEO:Gene Expression Omnibus; miRNA: microRNA; MKL: Multiple kernel learning; MRMR: Minimum Redundancy Maximum Relevancy; mRNA: messenger RNA; RFE: Recursive Feature Extraction; RNA: Ribonucleic acid; SMD: Stanford Microarray Database; SMKL-FS: Simple MKL-Feature Selection; SVM: Support Vector Machine; SVM-RFE: Support Vector Machine-Recursive Feature Elimination; TCGA: The Cancer Genome Atlas
Acknowledgements
We would like to thank Dr. Yan Wang from Jilin University and Dr. Xin Chen of UGA and JLU.
Funding
This work was supported in part by grants from The National Natural Science Foundation of China 61402194, 61472158 and 61572227 and China Postdoctoral Science Foundation 2014 T70291.
Availability of data and materials
Link of data and materials: http://csbl.bmb.uga.edu/ICSB/SMKL-FS/index.html.
Authors’contributions
WD was responsible for the analysis and the draft of the manuscript. ZBC carried out the data analysis and the revision of the manuscript. TCS carried out the revision of the manuscript. YL and YCL participated in the design and the revision of the manuscript. All authors read and approved the final manuscript.
Competing interests
The authors declare that they have no competing interests.
Consent for publication Not applicable.
Ethics approval and consent to participate Not applicable.
Author details
Received: 5 November 2015 Accepted: 11 January 2017
References
1. Barrett T, Wilhite SE, Ledoux P, Evangelista C, Kim IF, Tomashevsky M, Marshall KA, Phillippy KH, Sherman PM, Holko M, et al. NCBI GEO: archive for functional genomics data sets—update. Nucleic Acids Res. 2013;41(Database issue):D991–5. 2. Hubble J, Demeter J, Jin H, Mao M, Nitzberg M, Reddy TBK, Wymore F, Zachariah K, Sherlock G, Ball CA.
Implementation of GenePattern within the Stanford Microarray Database. Nucleic Acids Res. 2009;37:D898–901. 3. Rustici G, Kolesnikov N, Brandizi M, Burdett T, Dylag M, Emam I, Farne A, Hastings E, Ison J, Keays M, et al. ArrayExpress
update—trends in database growth and links to data analysis tools. Nucleic Acids Res. 2013;41(Database issue):D987–90. 4. Cancer Genome Atlas Research N, Weinstein JN, Collisson EA, Mills GB, Shaw KR, Ozenberger BA, Ellrott K, Shmulevich I,
Sander C, Stuart JM. The Cancer Genome Atlas Pan-Cancer analysis project. Nat Genet. 2013;45(10):1113–20. 5. Xu Y, Cui J, Puett D. Cancer Bioinformatics. New York: Springer; 2014: 43.
6. Kim Y, Street WN, Menczer F. Feature Selection in Data Mining. In: Data Mining: Opportunities and Challenges. Hershey: Idea Group Publishing; 2003: 80-105.
7. Saeys Y, Inza I, Larranaga P. A review of feature selection techniques in bioinformatics. Bioinformatics. 2007;23(19):2507–17.
8. Tang Y, Zhang YQ, Huang Z. Development of two-stage SVM-RFE gene selection strategy for microarray expression data analysis. IEEE/ACM Trans Comput Biol Bioinform. 2007;4(3):365–81.
9. Glaab E, Garibaldi JM, Krasnogor N. ArrayMining: a modular web-application for microarray analysis combining ensemble and consensus methods with cross-study normalization. BMC Bioinformatics. 2009;10:358. 10. Cai H, Ruan P, Ng M, Akutsu T. Feature weight estimation for gene selection: a local hyperlinear learning approach.
BMC Bioinformatics. 2014;15:70.
11. Cao ZB, Wang Y, Sun Y, Du W, Liang YC. A novel filter feature selection method for paired microarray expression data analysis. Int J Data Min Bioinform. 2015;12(4):363–86.
12. Mukhopadhyay A, Maulik U. An SVM-wrapped multiobjective evolutionary feature selection approach for identifying cancer-microRNA markers. IEEE Trans Nanobioscience. 2013;12(4):275–81.
13. Maulik U, Chakraborty D. Fuzzy preference based feature selection and semisupervised SVM for cancer classification. IEEE Trans Nanobioscience. 2014;13(2):152–60.
14. Chen Z, Li J, Wei L. A multiple kernel support vector machine scheme for feature selection and rule extraction from gene expression data of cancer tissue. Artif Intell Med. 2007;41(2):161–75.
15. Mao Q, Tsang IW. A feature selection method for multivariate performance measures. IEEE Trans Pattern Anal Mach Intell. 2013;35(9):2051–63.
16. Li Y, Si J, Zhou G, Huang S, Chen S. FREL: A Stable Feature Selection Algorithm. IEEE Trans Neural Netw Learn Syst. 2015;26(7):1388-402
17. Kursa MB. Robustness of Random Forest-based gene selection methods. BMC Bioinformatics. 2014;15:8. 18. Yousef M, Jung S, Showe LC, Showe MK. Recursive cluster elimination (RCE) for classification and feature selection
from gene expression data. BMC Bioinformatics. 2007;8:144.
19. Niijima S, Okuno Y. Laplacian linear discriminant analysis approach to unsupervised feature selection. IEEE/ACM Trans Comput Biol Bioinform. 2009;6(4):605–14.
20. Chuang LY, Ke CH, Chang HW, Yang CH. A two-stage feature selection method for gene expression data. OMICS. 2009;13(2):127–37.
21. Mundra PA, Rajapakse JC. SVM-RFE with MRMR filter for gene selection. IEEE Trans Nanobioscience. 2010;9(1):31–7. 22. Du W, Sun Y, Wang Y, Cao ZB, Zhang C, Liang YC. A novel multi-stage feature selection method for microarray
expression data analysis. Int J Data Min Bioinform. 2013;7(1):58–77.
23. Rakotomamonjy A, Bach FR, Canu S, Grandvalet Y. SimpleMKL. J Mach Learn Res. 2008;9:2491–521. 24. Gonen M, Alpaydin E. Multiple Kernel Learning Algorithms. J Mach Learn Res. 2011;12:2211–68.
25. Ding C, Peng H. Minimum redundancy feature selection from microarray gene expression data. J Bioinforma Comput Biol. 2005;3(2):185–205.
26. Guyon I, Weston J, Barnhill S, Vapnik V. Gene selection for cancer classification using support vector machines. Mach Learn. 2002;46(1–3):389–422.
27. Gutkin M, Shamir R, Dror G. SlimPLS: a method for feature selection in gene expression-based disease classification. PloS One. 2009;4(7):e6416.
28. Yoon D, Lee EK, Park T. Robust imputation method for missing values in microarray data. BMC Bioinformatics. 2007;8:S6. 29. Yang YH, Dudoit S, Luu P, Lin DM, Peng V, Ngai J, Speed TP. Normalization for cDNA microarray data: a robust
composite method addressing single and multiple slide systematic variation. Nucleic Acids Res. 2002;30(4):e15. 30. Autio R, Kilpinen S, Saarela M, Kallioniemi O, Hautaniemi S, Astola J. Comparison of Affymetrix data normalization
methods using 6,926 experiments across five array generations. BMC Bioinformatics. 2009;10:S24.
31. Peng H, Long F, Ding C. Feature selection based on mutual information: criteria of max-dependency, max-relevance, and min-redundancy. IEEE Trans Pattern Anal Mach Intell. 2005;27(8):1226–38. 32. Wu X, Yu K, Ding W, Wang H, Zhu X. Online feature selection with streaming features. IEEE Trans Pattern Anal
Mach Intell. 2013;35(5):1178–92.
33. Tan MK, Tsang IW, Wang L. Towards Ultrahigh Dimensional Feature Selection for Big Data. J Mach Learn Res. 2014;15:1371–429.
34. Haury AC, Gestraud P, Vert JP. The Influence of Feature Selection Methods on Accuracy, Stability and Interpretability of Molecular Signatures. PloS One. 2011;6(12):e28210.
35. Cortes C, Vapnik V. Support-vector networks. Mach Learn. 1995;20(3):273–97.
36. Seoane JA, Day INM, Gaunt TR, Campbell C. A pathway-based data integration framework for prediction of disease progression. Bioinformatics. 2014;30(6):838–45.