Auditing Communication
Effectiveness In Higher Education:
A Team-Based Study By MBA Students
Claudia Hart, Northern Michigan University, USA Tony Plemmons, NCR Corporation, USA Karin Stulz, Northern Michigan University, USA Margo Vroman, Northern Michigan University, USA
ABSTRACT
A regional University in the United States implemented an AQIP (Academic Quality Improvement Program) Action Project with a goal of developing processes for effective leadership communication. An MBA (Masters of Business Administration) class conducted a university-wide communication audit to assist with the AQIP project. Quantitative and qualitative data were collected, analysed and presented to the AQIP Task Force. The audit was a win-win opportunity for the students and broader university community. University leadership learned about communication strengths and opportunities within the organization and received recommendations on ways to strengthen communication in the areas of communication channels, information flow, and feedback. As a result, the Task Force implemented tools and processes to enhance communication within the University. The audit also provided MBA students with an opportunity to connect classroom theory with workplace practice. As a result of this service-learning project, students acquired knowledge about organizational communication, worked collaboratively with University employees and practiced communication skills as they developed and defended decisions and recommendations.
Keywords: Communication Audit; AQIP; MBA; Organizational Communication; Service Learning
INTRODUCTION
pportunities to develop and enhance campus communication at a regional university in the Midwest United States was identified in an Academic Quality Improvement Program (AQIP) Systems Appraisal. The University, accredited by the Higher Learning Commission (HLC), had adopted the AQIP method of accreditation offered by the HLC.
A need existed for better dissemination of information and feedback mechanisms to address two issues: perceived lack of decision transparency and the realization that feedback does not always make its way up or down the leadership chain. In response to AQIP Reviewer feedback, the University adopted an Action Project, Developing Feedback Mechanisms and Enhancing Campus Leadership Communication, with the goal of developing processes for effective leadership-guided communication and feedback mechanisms.
and defended decisions and recommendations. As a result, the University acquired valuable information about communication strengths and opportunities for improvement to be considered by the AQIP Action Project Task Force.
COMMUNICATION AUDIT
Raina (2010) explains that communication is the process most central to the success or failure of an organization and many of the problems that occur in an organization are likely a result of communication failure. A communication audit is often utilized for evaluating the strengths and weaknesses of an organization’s internal communication system and to diagnose communication problems and propose strategies for improvements (Zwijze-Koning & de Jong, 2015, 37). Henderson (2005, 289) says, ‘just like a financial audit attempts to form an economic portrait of a company by identifying areas of waste and efficiency, a communication audit examines communication issues in detail.’ She also clarifies, ‘the communications audit process is designed to examine and evaluate an organization’s communication program; to reveal hurdles to effective communication, to reveal gaps in the communication process, and to provide suggestions for improvement’ (Henderson 2005, 312). Tracy (2016) simply tells us that a communication audit is similar to having a check-up with your physician.
Both quantitative and qualitative data should be collected during the communication audit process so that it accurately evaluates the organization’s communication health. Methodologies for collecting data typically include: interviews, surveys, critical incident technique, network analysis, participant observation, document review, and focus groups (Coffman, 2004; Downs & Adrian, 2004; Zwijze-Koning and de Jong, 2015). Downs and Adrian suggest using multiple techniques and say,
‘The more measures used to collect data, the more reliable are the data; they supplement one another so that the consistency of findings can be tested . . . by supplementing one with the other, auditors can ensure that their estimates of the organization are likely to be realistic’ (2004, 27).
The communication audit for this study included three methods—interviews, survey and focus groups.
METHODOLOGY
The audit team consisted of 17 students enrolled in the MBA course, Managerial Communication. Initially, students studied the formal organizational chart to familiarize themselves with the structure of the University. To effectively manage the audit given the 1200+ employees, students divided into teams with each team studying one of the structural divisions as identified in the organization chart: the President’s Division, the Finance and Administration Division, and the Academic Affairs Division. The Academic Affairs Division was further divided into two subgroups given the high number of employees: (1) faculty and staff and (2) deans, department heads, and directors. Therefore, four student teams were created, and each team was assigned one of the four groups mentioned above. Teams consisted of three to five students based on the size of their assigned division.
Again, using the organization chart, each audit team identified directors and employees within their division. Team members interviewed a sampling of employees to learn perceptions of communication strengths and opportunities at the University. This activity was an exploratory event to give teams an overall understanding of how employees perceived communication in their jobs and throughout the University.
revise survey questions. The survey was pilot tested by the 17 MBA students, the AQIP co-chairs, the Outcomes Assessment Coordinator and an undergraduate business research class. One student volunteered to complete the University’s Application for Review of Research Involving Human Subjects and securing Institutional Review Board approval. As required by the University, all students completed the CITI (Collaborative Institutional Training Initiative) Human Subjects Research Training Course.
During his convocation speech at the beginning of the academic school year, the University President informed employees of this AQIP Action Project and requested their input during the communication audit process. When the survey was ready for distribution, the President and the professor of the MBA class each sent an email asking employees to support this assessment project by completing the survey. The monthly University newsletter promoted the survey.
Employees were notified by email to click the link which took them to the Qualtrics site to complete the survey. Respondents were assured that their participation was voluntary and anonymous, all responses were confidential, and reporting would be restricted to an aggregate level preventing identification of individuals or groups of employees. During the two weeks, the survey was open, two reminder emails were sent.
The completed surveys yielded both quantitative and qualitative data. Based on expertise and interest, students were asked to volunteer for data analysis teams. A statistics group was convened to interpret and analyse the survey results. A qualitative group interpreted the written responses, and a quantitative group analysed the questions that had a predetermined number of response options.
Once the qualitative team completed their analysis and reported on the general themes from the survey results, the original four divisional teams conducted focus groups. The focus groups provided a more in-depth understanding of communication at the University. Focus group participants elaborated and supported many common themes reported from the survey results. Managers and supervisors were distanced from their subordinates to promote a more relaxed interview environment and to gain as much quality information as possible.
Potential participants received an email invitation to participate in a focus group. Due to low response rates, the audit teams followed up with phone calls and sent personalized invitations via campus mail.
After the focus groups had been completed, the audit team compared and combined feedback from the interviews, surveys and focus groups and then analysed all the information to establish conclusions and recommendations based on three all-encompassing sections: Communication Channels, Information Flow, and Feedback.
LIMITATIONS
Certain factors limited this audit including survey response rate, focus group participation rate, perception based quantitative data, campus forum, voluntary participation and the underrepresentation of some units. These limitations are discussed below.
Survey Response Rate
The communication survey was sent to 1,210 employees, completed by 309 and started by 348. The results of the survey represented approximately 29 percent of all University employees. Survey analysis was limited because the results reflected a sample of employee perceptions of communication at the University and not the entire employment base.
Focus Group Participation Rate
Perception Based Quantitative Data
Data collected in interviews, surveys and focus groups reflected employees’ opinions and perceptions. Employee perceptions were valuable but occasionally contradicted the survey results. Additionally, most employees tended to concentrate on communication weaknesses as opposed to strengths.
Campus Forum
In an attempt to update employees with preliminary results of the survey and collect more feedback of perceived communication by employees, the audit team planned an employee forum. Time restraints and a lack of formal approval resulted in the cancellation of the forum.
Voluntary Participation
All participation in the audit was voluntary, resulting in a lower response rate to the survey and minimal participation in the focus groups. Therefore, all data presented is based on a sample of voluntary responses and participation.
Underrepresentation of Some Units
Some divisions had more respondents to the survey and focus groups than other divisions. Some divisions were underrepresented in the data because the survey was voluntary.
RESULTS
Quantitative results will be discussed based on data obtained from the survey and qualitative results will be discussed from information acquired in the focus groups.
Quantitative Analysis
Qualtrics, StatTools® and Microsoft Excel® were utilized to analyze results of the survey. Qualtrics, a web-based survey software program, was used to develop and administer the survey, consolidate results, and provide statistical analysis. Qualtrics was also used to perform cross-tabulations, where two variables were compared to each other to demonstrate statistically significant relationships. StatTools® was used to conduct an additional statistical analysis. Multiple regressions, which further supported mathematical values in other areas with significant statistical findings, were performed. For the mean differences between divisions, Microsoft Excel® was used to calculate the different means. The audit team was able to study trends, deviations and anomalies using the three programs. In all figures below, ‘n’ equals the number of respondents.
Quantitative Analysis – Demographics
Figure 1. Gender Demographics (n=312)
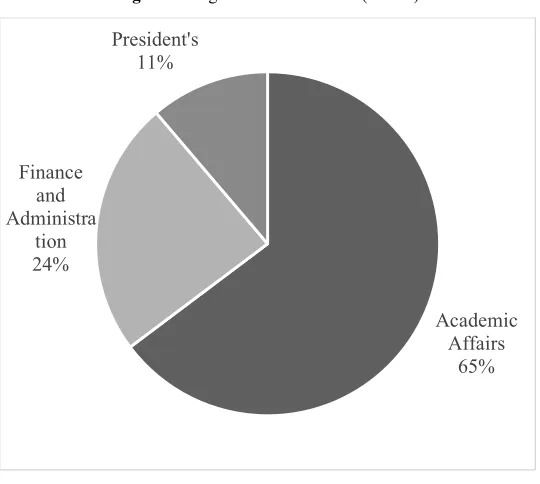
The number of respondents from each division is shown in Figure 2 and are as follows: Academic Affairs, 202; Finance and Administration, 75; and President’s, 35.
Figure 2. Organization Divisions (n=312)
The job titles for the Academic Affairs and Finance and Administration Divisions are shown in Figures 3 and 4, respectively. Because employee job titles within the President’s Division were unique to each position and respondents could be easily identified, the survey did not require their titles.
Males 43% Females
57%
Academic Affairs
65% Finance
and Administra
tion 24%
Figure 3. Academic Affairs Division – Titles of Respondents (n=197)
Figure 4. Finance and Administration Division – Titles of Respondents (n=75)
The survey respondents reported years of service at the University with a range from less than one year to 43 years as shown in Figure 5. The average number of years employed was 13.66.
10
21 25
32
12
5
10 12
70
0 10 20 30 40 50 60 70 80
Instructor Assistant Professor
Assoc. Professor
Professor Academic Dept. Head
Dean Adjunct Grad. Asst.
Other Staff
4 5
9 8
29
2 2
16
Figure 5. Employee Years of Service (n=310)
Quantitative Analysis – Cross Tabulations
Cross-tabulations were performed using Qualtrics1 to analyse the data for relationships. This resulted in a series of tables showing the significant relationships between variables. Cross tabulation of the variables resulted in a chi-square value and a p-value for each pairing. Chi-chi-square, a statistical hypothesis test, measured whether or not two qualitative sample results were significantly related. For this study, any cross tabulation with a p-value of 0.05 or less was significant. Discussion of significant findings from the cross tabulations are included in the following section.
A cross tabulation was performed to measure Question 8, ‘Are you responsible for employees (not student) as a manager or supervisor,’ with Question 5.1, ‘Please indicate how satisfied or dissatisfied you are with the following communication you receive: Information about the University’s financial situation,’ which revealed a significant relationship between the questions as shown in Table 1. Employees who indicated they were not a manager or supervisor were significantly more likely to answer that they were ‘dissatisfied’ with the information they received about the financial situation. The resulting chi-square was 15.0004 (6 degrees of freedom), with a p-value of 0.0203.
1The survey and data analysis discussed in this paper was generated using Qualtrics software, September – December, 2011. Copyright ©2005 Qualtrics. Qualtrics and all other Qualtrics product or service names are registered trademarks or trademarks of Qualtrics, Provo, UT, USA. http://www.qualtrics.com.
14
86 61
37 26
86
0 10 20 30 40 50 60 70 80 90 100 <1 year
1-5 years 6-10 years 11-15 years 16-20 years 20+ years
Table 1. Job Satisfaction (n=312)
Question 5.1: Please indicate how satisfied or dissatisfied you are with the following communication you receive: Information about the University’s financial situation.
Question 8: Are you responsible for employees (not student) as a manager or a supervisor? Very
Dissatisfied
Dissatisfied Somewhat Dissatisfied
Indifferent Somewhat Satisfied
Satisfied Very Satisfied
Yes (1.1%) 1 16 (17.2%) (15.1%) 14 (9.6%) 9 (24.7%) 23 (25.8%) 24 (6.5%) 6
No (10.9%) 24 (14.2%) 31 (21.5%) 47 (10%) 22 (24.7%) 54 (15.1%) 33 (3.6%) 8
The results of several cross-tabulations were used to measure the significance of gender. Table 2 showed the comparison of gender from Question 13 with Question 8, ‘Are you responsible for employees (not student) as a manager or supervisor.’ Gender represented an important relationship between the variables. Males are 23 percent more likely to indicate they were managers or supervisors than females as evidenced by a chi-square of 4.2462 (one degree of freedom) and a p-value of 0.0393. This result had an impact on the results of further cross tabulations.
Table 2. Management Status by Gender Are you responsible for employees (not student) as a manager or a supervisor?
Gender Yes No Total
Male (37%) 48 (63%) 84 132
Female (25%) 44 (75%) 129 173
Total 92 213 305
When measuring gender with Question 6.3 in Table 3, males were more likely than females to be ‘dissatisfied’ with the ‘Extent that I receive the information needed to do my job.’ This test resulted in a chi-square of 13.6553 (with 6 degrees of freedom) and a p-value of 0.033.
Table 3. Satisfaction of Information Received by Gender
Please indicate how satisfied or dissatisfied you are with the following communication you receive: Extent that I receive the information needed to do my job.
Gender Dissatisfied Very Dissatisfied Dissatisfied Somewhat Indifferent Somewhat Satisfied Satisfied Satisfied Very Total
Male (1%) 1 (8%) 10 (8%) 10 (8%) 11 (26%) 34 (40%) 53 (11%) 14 133
Female (2%) 4 (2%) 4 (9%) 15 (5%) 8 (26%) 45 (34%) 60 (22%) 38 174
Total 5 14 25 19 79 113 52 307
Table 4. Extent Managers Are Open to New Ideas by Gender
Please indicate how satisfied or dissatisfied you are with the following communication you receive: Extent that my manager/supervisor is open to ideas.
Gender Dissatisfied Very Dissatisfied Dissatisfied Somewhat Indifferent Somewhat Satisfied Satisfied Satisfied Very Total
Male (4%) 5 (1%) 1 10 (7.5%) 10 (7.5%) 30 (23%) (38%) 51 (19%) 26 133
Female (4%) 6 (8%) 13 9 (5%) (8%) 14 23 (13%) (29%) 51 (33%) 58 174
Total 11 14 19 24 53 102 84 307
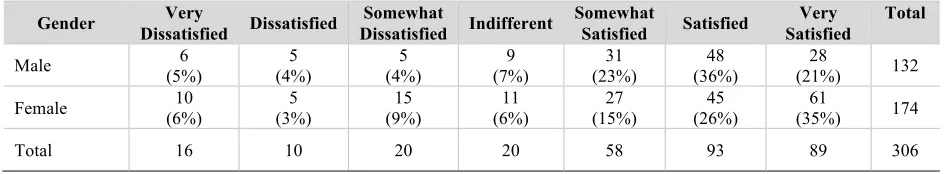
As shown in Table 5, measuring the relationship between gender and Question 5.5, females were more likely to be ‘dissatisfied’ with ‘Extent that my manager/supervisor listens to me.’ This test resulted in a chi-square of 13.29 (with 6 degrees of freedom) and a p-value of 0.0386.
Table 5. Extent Managers Listen
Please indicate how satisfied or dissatisfied you are with the following communication you receive: Extent that my manager/supervisor listens to me.
Gender Dissatisfied Very Dissatisfied Dissatisfied Somewhat Indifferent Somewhat Satisfied Satisfied Satisfied Very Total
Male (5%) 6 (4%) 5 (4%) 5 (7%) 9 (23%) 31 (36%) 48 (21%) 28 132
Female (6%) 10 (3%) 5 (9%) 15 (6%) 11 (15%) 27 (26%) 45 (35%) 61 174
Total 16 10 20 20 58 93 89 306
Quantitative Analysis - Methods of Communication
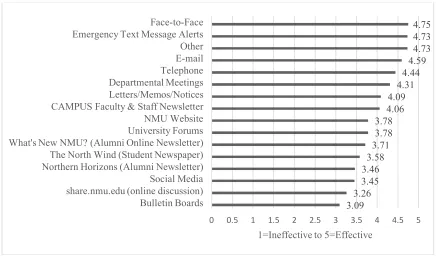
The survey measured the effectiveness of communication channels at the University on a scale of 1 to 5 with 5 being effective, 1 being ineffective and 3 being the central tendency. As shown in Figure 6, participants reported that face-to-face was the most effective form of communication (mean of 4.75) and physical bulletin boards were the least effective (mean of 3.09). The standard deviation for email was significantly higher than face-to-face, meaning that not everyone agreed on its effectiveness. Also, all of the methods of communication were rated above the central tendency, indicating communication overall was effective.
Figure 6. Methods of Communication (n = 307 – 311; n = 40 (other)
Quantitative Analysis – Areas with Communication Strengths
The audit team found the following areas where the University excelled in communication resulting in a 74 percent minimum respondent satisfaction.
Areas of effective communication that had a 74-80 percent respondent satisfaction include:
• Extent that I receive the information needed to do my job – 80 percent (256 out of 320) • Extent that my manager/supervisor listens to me – 79 percent (254 out of 321)
• Extent that my manager/supervisor is open to ideas – 78 percent (250 out of 320) • Extent that I trust my manager/supervisor – 77 percent (247 out of 319)
• Extent that my manager/supervisor offers guidance for solving job-related problems – 75 percent (239 out of 318)
• Extent that information communication is active – 74 percent (233 out of 313)
• Extent that I receive feedback on issues I have communicated with my manager/supervisor – 74 percent (230 out of 312)
Quantitative Analysis - Mean Differences Among Divisions
The questions below indicated significant differences in the mean of each question between the divisions. The other survey questions were omitted from Table 6 based on similar mean values.
3.09 3.26
3.45 3.46 3.58
3.71 3.78 3.78
4.06 4.09
4.31 4.44
4.59 4.73 4.73 4.75
0 0.5 1 1.5 2 2.5 3 3.5 4 4.5 5
Bulletin Boards share.nmu.edu (online discussion) Social Media Northern Horizons (Alumni Newsletter) The North Wind (Student Newspaper) What's New NMU? (Alumni Online Newsletter) University Forums NMU Website CAMPUS Faculty & Staff Newsletter Letters/Memos/Notices Departmental Meetings Telephone E-mail Other Emergency Text Message Alerts Face-to-Face
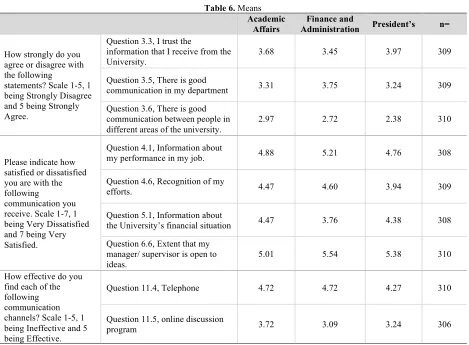
Table 6. Means Academic
Affairs
Finance and
Administration President’s n=
How strongly do you agree or disagree with the following
statements? Scale 1-5, 1 being Strongly Disagree and 5 being Strongly Agree.
Question 3.3, I trust the
information that I receive from the University.
3.68 3.45 3.97 309
Question 3.5, There is good
communication in my department 3.31 3.75 3.24 309
Question 3.6, There is good communication between people in different areas of the university.
2.97 2.72 2.38 310
Please indicate how satisfied or dissatisfied you are with the following
communication you receive. Scale 1-7, 1 being Very Dissatisfied and 7 being Very Satisfied.
Question 4.1, Information about
my performance in my job. 4.88 5.21 4.76 308
Question 4.6, Recognition of my
efforts. 4.47 4.60 3.94 309
Question 5.1, Information about
the University’s financial situation 4.47 3.76 4.38 308
Question 6.6, Extent that my manager/ supervisor is open to
ideas. 5.01 5.54 5.38 310
How effective do you find each of the following communication channels? Scale 1-5, 1 being Ineffective and 5 being Effective.
Question 11.4, Telephone 4.72 4.72 4.27 310
Question 11.5, online discussion
program 3.72 3.09 3.24 306
The results from Table 6 compared the means among the Divisions. Table 6 is explained below:
• Results from Question 3.3 indicated that employees in the President’s Division were more likely ‘to trust the information they receive from the University’ than employees in the Academic Affairs Division and the Finance and Administration Division.
• Question 3.5 results indicated the departments related to the Finance and Administration Division were more ‘satisfied’ with the ‘communication within their department.’ The Finance and Administration Division were 0.5 points more ‘satisfied’ with the ‘communication within their departments’ than the President’s Division.
• The results from Question 3.6, ‘communication between people in different areas of the university,’ indicated all three divisions were below the central tendency. The average number of employees ‘somewhat disagree’ there is good ‘communication between people in different areas of the university.’ The Academic Affairs Division had the highest mean which contrasted with the other divisions, which scored lower.
• The results from Question 4.1 provided information about job performance and indicated that employees in the Finance and Administration Division seemed to be more ‘satisfied’ with the feedback they received. All divisions reported to be ‘somewhat satisfied,’ but the mean for the President’s Division was lower than the Finance and Administration Division which reported the highest mean.
• For Question 4.6, the President’s Division ranked the communication they received as the lowest of the three divisions. The question concerning ‘recognition of the employee’s efforts’ indicated that the President’s Division was somewhat ‘dissatisfied.’ The mean was close to the scores reported by the other two divisions.
• Results for Question 5.1 regarding ‘information the employee receives about the University’s financial situation,’ the Finance and Administration Division reported to be ‘somewhat dissatisfied.’ The President’s Division and the Academic Affairs Division ranked this as ‘indifferent.’
• Question 6.6 focused on the ‘extent that the employee’s manager or supervisor is open to ideas’ resulted in being ‘somewhat satisfied.’ The employees in the Finance and Administration Division reported the highest mean values, while the employees in the Academic Affairs Division reported the lowest mean values.
• Question 11.4 asked about the effectiveness of using a ‘telephone’ as a communication channel. Both the Academic Affairs Division and Finance and Administration Divisions ranked the use of the telephone as ‘effective.’ The President’s division was almost a half point lower in their ranking as ‘somewhat effective.’
• For Question 11.5, the online discussion board was measured for effectiveness. All the means for the three divisions fell within the ‘neutral’ category; the Academic Affairs Division ranked this question highest.
Quantitative Analysis - Multiple Regression Analysis
Multiple regression hypothesis tests were conducted to discover underlying trends in the data. Multiple regressions are a statistical technique included in most statistical software suites that calculate a descriptive algorithm showing the relationship between multiple independent variables to try to predict a single dependent variable.
This process of hypothesis experiments closely parallels the scientific method in that the audit team hypothesized possible variations between multiple cause-and-effect connections. This contrasts a possible random approach that chooses a large number of independent variables in the hopes that some will prove to be predictive. However, it was determined not to be a prudent approach. Many of the hypotheses ultimately proved to be false, but one relationship was of particular interest. The overall average for job satisfaction among the employees was high at 76.4 percent. There was a strong correlation between average job satisfaction, ‘opportunities to express one’s ideas,’ ‘trust of information received’ and ‘good departmental communication.’
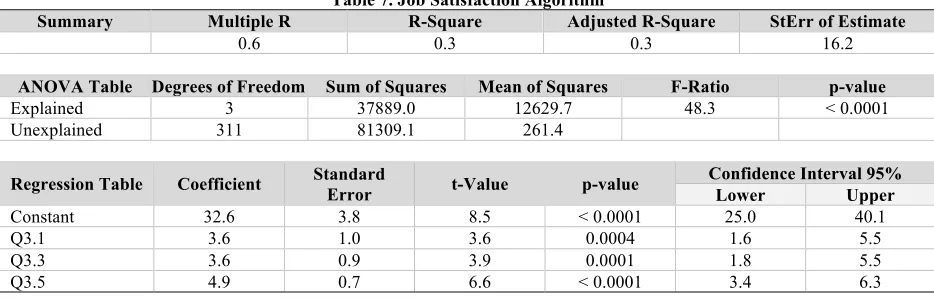
The result of the multiple regression calculation was:
Predicted Job Satisfaction = 32.585 + 3.585x1 + 3.636x2 + 4.877x3
Where:
Dependent Variable = Question 2.1: How satisfied are you with your job?
Baseline Coefficient = 32.585 (The predicted level of job satisfaction when all of the independent variables are zero.)
x₁ = Question 3.1: How strongly do you agree or disagree with the following statements?
Opportunities are available to me to express my ideas to the University.
𝑥₂ = Question 3.3: How strongly do you agree or disagree with the following statements? I trust the information that I receive from the University.
Questions 3.1, 3.3 and 3.5 were on a scale ranging from 1 to 5 based on their level of disagreement or agreement. Note that on a 1 to 5 scale, the central tendency is 3, not 2.5. Question 2.1 was on a scale of 0 to 100.
The purpose of this formula was to indicate what level the independent variables (Questions 3.1, 3.3 and 3.5) give predictive data about the dependent variable (Question 2.1).
Table 7. Job Satisfaction Algorithm
Summary Multiple R R-Square Adjusted R-Square StErr of Estimate
0.6 0.3 0.3 16.2
ANOVA Table Degrees of Freedom Sum of Squares Mean of Squares F-Ratio p-value
Explained 3 37889.0 12629.7 48.3 < 0.0001
Unexplained 311 81309.1 261.4
Regression Table Coefficient Standard Error t-Value p-value Confidence Interval 95% Lower Upper
Constant 32.6 3.8 8.5 < 0.0001 25.0 40.1
Q3.1 3.6 1.0 3.6 0.0004 1.6 5.5
Q3.3 3.6 0.9 3.9 0.0001 1.8 5.5
Q3.5 4.9 0.7 6.6 < 0.0001 3.4 6.3
The p-value for all three independent variables was low at less than 0.0005 indicating their statistical significance. The algorithm above indicated that a one-point increase in Questions 3.1 or 3.3 resulted in a 3.5 percent increase or greater in an individual’s overall job satisfaction. Furthermore, a one-point increase to Question 3.5 resulted in approximately a 5 percent increase in job satisfaction.
The confidence intervals of all three of the independent variables were positive numbers which demonstrates a 95 percent confidence level that even the smallest increase in Questions 3.1, 3.3 or 3.5 would result in an increase in overall job satisfaction.
Focus Groups
Purpose
Focus group sessions were held to further clarify communication effectiveness within the University. The main objective was to acquire additional information to clarify the survey results and to analyze issues in depth. According to Downs and Adrian (2004), focus groups are important because they:
• Allow participants to speak freely without the restrictions of systematic questioning • Provide detailed information from group interaction
• Efficiently lead to obtaining information in a short period • Allow flexibility for the agenda to be modified
Response/Participation
Table 8. Response and Participation Statistics
Division Invited Participated Responded Respond Did Not Attendance Rate President’s
(4 sessions) 91 8 23 68 8.8%
Academic Affairs- Faculty & Staff
(4 sessions) ≈350 9 12 ≈338 2.6%
Academic Affairs- Deans, Dept. Heads, Directors
(3 Sessions)
51 12 23 28 23.5%
Admin. & Finance
(3 sessions) 64 10 55 9 15.6%
Total 556 39 113 443 20.68%
Common Themes
Overall, employees believed communicating face-to-face was the most effective, but because of scheduling issues, this communication channel was difficult. Email was the most utilized communication channel by employees. However, email posed numerous communication constraints. Most focus group participants said that they experienced email ‘overload.’ Employees were overwhelmed reading all of the messages they received in one day, which caused them to ‘pick and choose’ what emails to read. As a result, many messages were missed or delayed.
Focus group participants believed the President’s Council was a positive communication channel. One focus group member quoted the President’s Council as: ‘One of the best ways for employees to keep up to date and involved with the University.’
Although effective, many employees would like to receive more accurate input about unofficial information. Focus group participants believed there was a lack of transparency from the top down. Many believed that this contributed to a lack of confidence in the validity of communication content versus what was being withheld by upper management.
Finally, focus group participants agreed communication within their department was effective and clear. Most departmental meetings were reported to be informative and efficient. However, the effectiveness of communication between departments was an issue throughout all divisions. Many employees said they had a hard time receiving timely responses from employees in other departments. The lack of feedback from upward communication was an issue throughout all divisions. Many believed effective feedback mechanisms would be beneficial to the employees at the University.
Below are tables for each division and the common themes.
Table 9. Academic Affairs Division – Faculty and Staff
Strengths
• Email, telephone, and face-to-face interaction were identified as the most effective and most commonly used communication channels
• Strong communication was reported within departments
• Campus newsletter was effective as far as circulation period, length of publication and information contained
• Some individuals believed face-to-face was “still the best” and most effective channel for sending and receiving information, as most other channels were cluttered and messages were lost in translation
• University’s emergency alert and text message system were effective at communicating high-importance messages to large groups of employees and students
• President’s Forum was an effective means of giving employees a voice and improving employee engagement
Upward Communication •• Employees sent information or ideas upward and did not receive any feedback Better feedback mechanisms should be implemented
Communication Between Departments
• “Lacked among many Dean’s offices”
• Department heads and upper management could have had better communication skills through leadership training
Transparency
• Threatened by the idea of confrontation when they sent information upwards
• Lack of transparency from the top down contributed to a lack of confidence in the validity of what was communicated
• Effective communication channel
• Information overload resulted when too many emails were received, and important messages were overlooked
• Most commonly used
Rumors • Cause uncertainty when not addressed by decision makers
Location on Campus
• Physical location on campus had a significant effect on supervisor/subordinate relationship and communication
• Frustration was expressed when employees could not physically see/talk to their superiors • Responses/feedback were severely diminished when there were physical barriers
Table 10. Finance and Administration Division
Strengths
• The President made a deliberate, conscious effort to keep everyone informed (i.e., University Forums, Parent Partnership, Let’s Chat)
• Email was easily managed by folders and spam messages could be controlled • Departmental meetings kept employees informed and provided feedback
• Face-to-face meetings and phone calls provided a personal approach to communication • President’s Council brings together a broad range of people from various sectors of the
University
Upward Communication
• The less authority an employee had, the more information becomes misconstrued
• Decision making was slow due to having to receive input from a variety of people in different departments
Communication Between Departments
• Because of lean staffing, individuals did not know who to contact for information and timing issues arose when work had to be completed
• Responsibilities and duties were always changing. Contact information was difficult to obtain due to continuous changing of duties and responsibilities.
• Departments are too busy
• Difficult to communicate because individuals cannot be reached in a particular department • Communication between departments was not effective because it was difficult to receive
timely information
• Overabundance of email caused delays. Control the number of email messages received per day
• Overabundance of email; employees deleted more emails than they read; “there is too much noise”
• Spam was an issue with email
Policies and Procedures
• Policies and procedures related to formal communication were not clear
• Policies and procedures were inaccessible when employees needed to resolve an issue • Needed to implement on website and provide reliable access to those policies and procedures
Face-to-Face
• Face-to-face communication was effective but hard to gather people at one convenient time • Provide more gatherings for faculty and staff
• Provide a common meeting place for students and faculty
Unofficial Information •• Information was not always trusted within the University Unofficial “grapevine” information was misinterpreted
Recommendations
• Develop another reliable channel of communication besides email • Train new hires on University software to ensure program accessibility • Organize information by service rather than by department
• Extend authorization levels to broader range of management (had responsibility but no authority to act)
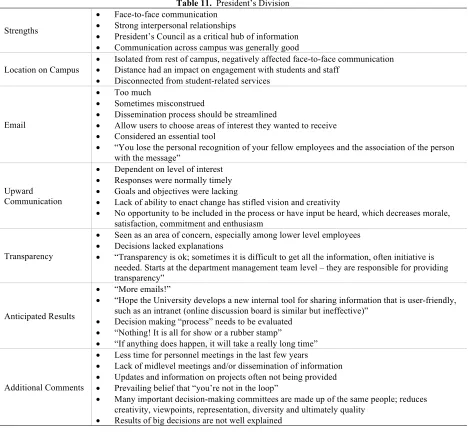
Table 11. President’s Division
Strengths
• Face-to-face communication • Strong interpersonal relationships
• President’s Council as a critical hub of information • Communication across campus was generally good
Location on Campus
• Isolated from rest of campus, negatively affected face-to-face communication • Distance had an impact on engagement with students and staff
• Disconnected from student-related services
• Too much
• Sometimes misconstrued
• Dissemination process should be streamlined
• Allow users to choose areas of interest they wanted to receive • Considered an essential tool
• “You lose the personal recognition of your fellow employees and the association of the person with the message”
Upward Communication
• Dependent on level of interest • Responses were normally timely • Goals and objectives were lacking
• Lack of ability to enact change has stifled vision and creativity
• No opportunity to be included in the process or have input be heard, which decreases morale, satisfaction, commitment and enthusiasm
Transparency
• Seen as an area of concern, especially among lower level employees • Decisions lacked explanations
• “Transparency is ok; sometimes it is difficult to get all the information, often initiative is needed. Starts at the department management team level – they are responsible for providing transparency”
Anticipated Results
• “More emails!”
• “Hope the University develops a new internal tool for sharing information that is user-friendly, such as an intranet (online discussion board is similar but ineffective)”
• Decision making “process” needs to be evaluated • “Nothing! It is all for show or a rubber stamp”
• “If anything does happen, it will take a really long time”
Additional Comments
• Less time for personnel meetings in the last few years
• Lack of midlevel meetings and/or dissemination of information • Updates and information on projects often not being provided • Prevailing belief that “you’re not in the loop”
• Many important decision-making committees are made up of the same people; reduces creativity, viewpoints, representation, diversity and ultimately quality
• Results of big decisions are not well explained
Table 12. Deans, Directors, and Department Heads Communication and
Productivity
• Greater communication leads to greater performance and productivity • “Communication is lifeblood of the department”
Strengths
• Great communication to external entities • Great amount of information available • University newsletter
Upward Communication
• Information sent upward appeared filtered on the way back down • No feedback on reports
• A general idea of a “black hole” where the information sent upwards disappears
• Example the 4-10 shift survey: Had respondents fill out a survey after the decision was already made
• “People at top assume everyone knows everything already”
Anticipated Results
• “Project being used just to satisfy requirements of project and make recommendations” • Little confidence that anything will get acted on
• A more engaging and involving institution
Transparency
• “University is not transparent”
• “The University switched plans about one of the buildings then read about it in the local newspaper before hearing about it from the University”
Additional Comments
• Hard to keep up with communication requests
• “One group is being told one thing, while another is told something different” • Lack of a complete message creates a lack of trust
• A lot of decisions seem to be made among the smallest group of people • Decisions have been made without any consultation
• Frequently asked to contribute information that was not being used or the decision had already been made
RECOMMENDATIONS
The data collected from the communication audit generated a significant amount of information. This information revealed areas where the University excelled as well as opportunities for improvement. The overall results of the audit were compiled into three all-encompassing sections: Communication Channels, Information Flow, and Feedback. From each section, strengths, opportunities, and conclusions were derived from the data. The recommendations served as a launching point for addressing issues as well as for building on existing strengths.
Communication Channels
Strengths
Survey results indicated employees perceived all channels of communication were above average in effectiveness. Face-to-face communication was ranked highest overall in the survey and had a low standard deviation. Face-to-face communication was the preferred method of communication when time permitted. It provided instant feedback and allowed for nonverbal transmission of emotion and tone and clearer understanding of the message. A high level of support for the effectiveness of the emergency alert system was also reported, indicating its importance to University faculty and staff. Email was rated the third most effective communication method. The standard deviation, however, was significantly higher than face-to-face, indicating that not everyone agreed on its effectiveness. Employees perceived that email was an effective communication tool, allowing for quick transmission and feedback. Email also offered the advantage of documentation for later retrieval.
Opportunities
messages represented a relatively small portion of email received by employees but detracted from an employee’s ability to work efficiently. The resulting inbox clutter, along with a general overreliance on email, led to email ‘overload; this required employees to ‘pick and choose’ what to read. This email selection process often caused important messages to go unread, resulting in a breakdown in the communication process. Also, desired messages sent within the University were subject to the same filtering systems which led to important information being classified as junk. Another highly regarded channel was face-to-face communication; however, many employees expressed the lack of a common meeting place for these exchanges.
Recommendations
An intranet could be implemented to minimize reliance on email. The intranet would then be the central location for important employee information, such as announcements, which would normally be sent via email.
Another suggestion would be to utilize existing technology such as Microsoft Outlook®. Seminars could be implemented to train employees how to use organizational tools, such as Outlook® calendar, to alleviate email overload. These tools are useful for viewing employees’ calendars and availability, eliminating the need for exchanging unnecessary email. University email filters could be reviewed to minimize unwanted messages and to eliminate the sending of important messages to junk mail. By improving the effectiveness of the current email system and by utilizing alternative technologies, the communication channel breakdowns could be minimized.
Before the centrally-located dining facility converted to a full-meal program, employees used this location as a common meeting place to informally converse face-to-face. Similar locations should be developed, such as teacher or staff lounges, to allow employees to converse on a daily basis and improve face-to-face communication.
Information Flow
Strengths
Survey responses indicated that employees were typically satisfied with the communication within their departments. This satisfaction stemmed from several factors. Employees believed the information they received from their supervisor was accurate, trustworthy and transparent. Additionally, employees believed they knew the correct paths to promote efficient communication with their co-workers. The more an employee expressed that the communication channels were working properly, the more satisfied they were with their job. This high job satisfaction could have been a contributing factor as to why employees were satisfied with communication within their department. The satisfaction of information flow varied by division. Regarding financial transparency, the Finance and Administration Division reported the highest level of satisfaction which was not surprising as much of the information was created by or passed through this division.
Opportunities
The President’s Division reported the lowest level of satisfaction regarding financial transparency. Much of this discrepancy was likely caused by the lack of communication between departments. While communication within departments was highly rated, communication between departments was an area identified as needing improvement. The President’s Division reported the lowest level of trust regarding information provided to them; however, they also indicated they received the most financial information.
Employees identified the need for easier access to University policies and procedures as an opportunity for improvement. Employees knew the policies existed but did not know where to find them as no user-friendly search engine was available. Easier access to this type of key information is essential to effectively performing job function and improving communication.
Administration Division strongly believed that the University is transparent with its financial information. The other divisions trusted this information to a lesser degree. This lack of transparency could lead to misinterpretation of key issues as well as rumor generation.
Recommendations
Information provided to employees needs to be accessible, transparent, and trustworthy since perceptions of trust and transparency have a direct impact on job satisfaction. Starting points for improving the flow of information include providing a summary of minutes from key meetings for employees to read or providing a recorded version of meetings similar to the method used for the President’s Convocation. Another method of improving information flow is to address rumors before they become widespread. By providing accurate information promptly, trust and transparency will be improved. As an organization’s transparency increases, the likelihood for rumors decreases.
Up-to-date policies and procedures should be available in a central location with a user-friendly search function, such as an intranet. This will address the need for easier access to key information. The intranet could also house an updated and accurate organizational chart, as well as a current list of President’s Council members. Providing a means of quickly obtaining accurate information would help bolster communication flow, improve job satisfaction, and increase communication effectiveness.
Feedback
Strengths
Employees reported they were comfortable expressing their ideas to the University and were satisfied with the feedback they received from supervisors. Additionally, most employees expressed satisfaction with the guidance they received for solving job-related problems as well as the information needed to complete their job.
Opportunities
Although employees expressed that the feedback they received from their immediate supervisors was adequate, they also voiced the need for better feedback mechanisms from the University. While employees believed, their supervisors were listening to their suggestions, there was not a system currently in place that allowed them to confirm an issue had been addressed. For example, some employees mentioned decisions affecting their jobs had been made without their input or knowledge. The less feedback an employee received, the lower that employee’s morale, job satisfaction, and commitment. This issue was confirmed by the data which indicated when employees’ opportunities to express their ideas increased, their overall job satisfaction increased. Several focus group members indicated that they believed no changes would be made as a result of this audit, which demonstrated the need for a formal feedback system.
Recommendations
Those at the management level may need more training to develop the skills needed to be successful managers. Managers should be trained to provide feedback to employees more often. Additionally, they should attend leadership training seminars or complete online education modules to inform them of the University’s expectations of communication. Another opportunity for improvement is to implement a mentor/mentee program for leaders at the University. These relationships could nurture newer managers on how to provide meaningful feedback to staff. A third option is the implementation of an anonymous feedback submission system that tracks suggestions made by employees. This system would enable employees to know that their suggestions are being reviewed.
Action Project Accomplishments Resulting from Communication Audit
• A prototype of an Online Employee Suggestion Box was created with the intent to pass ideas up the organizational levels to the executive management team. The system allows for the review of ideas by primary decision makers between the idea submitter and the division leaders. Demonstration of this system to key stakeholders across campus was conducted one year later. As a result, additional features were recommended to enhance the system.
• A University Policies and Procedures Online Manual was implemented and a process developed for ensuring scheduled updates. An Online Supervisor’s Manual was also created to provide basic reference materials for daily operations.
• A prototype of an employee intranet/email announcement system is currently in development to address key results of the audit: 1) decrease amount of email sent; 2) increase up-to-date information on major campus issues and projects; 3) provide quick links to information that are of interest to employees; and 4) help employees prioritize the overwhelming amount of communication they receive.
CONCLUSION
The communication audit occurred as a result of a University AQIP Action Project with the goal of developing processes for effective leadership-guided communication and feedback mechanisms. In this instance, the communication audit served as an effective initial component to evaluate the University’s communicative health. The quantitative and qualitative feedback provided specific data to make informed decisions related to communication. As a result of this information, the AQIP Action Project Task Force was able to implement several tools and processes to enhance communication within the organization.
The project also provided MBA students with first-hand experience with the ongoing process of assessment and evaluation in higher education. The complexity of the communication audit allowed graduate students to gain real-world skills as they were responsible for meeting deadlines, designing a survey, preparing for and conducting one-on-one interviews and focus groups (including designing interview guides), analysing data, writing a final report, and presenting their report to the Task Force and key administrators.
In addition to assisting the University’s AQIP Task Force, MBA students developed professional skills impossible to acquire in a traditional classroom setting. This project enhanced their graduate education, allowing them to put theory into practice under the supervision of their professor. Students were exposed to the requirements and challenges of formal research including the IRB application process, CITI research training, survey response rates and participant interest. They learned about accreditation, outcomes assessment and the University’s effort toward continuous improvement. In sum, students collaborated in teams and delivered a product that was significant in assessing and improving the quality of higher education.
AUTHOR BIOGRAPHIES
Claudia Hart is a professor of management in the College of Business at Northern Michigan University. She teaches managerial communication and training and development courses at both the undergraduate and graduate levels.
Tony Plemmons is a financial analyst at NCR Corporation in Atlanta, Georgia. He received his MBA from Northern Michigan University.
Karin Stulz is an assistant professor of management in the College of Business at Northern Michigan University. She teaches introduction to management and managerial communication courses.
REFERENCES
Coffman, J. 2004. Strategic Communications Audits. Brief prepared for the Communications Consortium Media Center. Washington, DC.
Downs, C., and C. Adrian. 2004. Assessing Organizational Communication: Strategic Communication Audits. New York: Guilford Press.
Henderson, J. 2005. Evaluating public relations effectiveness in a health care setting: The identification of communication assets and liabilities via a communication audit. Journal of Health and Human Services Administration, 28, 282-322. Palisade Corporation. [Statistics Add-in for Microsoft Excel StatTools®]. (Version 5.7.0). Statistics software. New York, NY Raina, R. 2010. Timely, continuous & credible communication & perceived organizational effectiveness. The Indian Journal of
Industrial Relations, 46, 345-359.
Tracy, S. 2016. Practical application in organizational communication: A historical snapshot and challenge for the future. Management Communication Quarterly, 1-7.
Tracy, S., Franks, T., Brooks, M., and Hoffman, T. 2015. An OPPT-in approach to relational and emotional organizational communication pedagogy. Management Communication Quarterly, 29, 322-328.