Hareesh Dara et al., J. Sci. Res. Phar. 2015, 4(1), 6-11
Journal of
Scientific
Research in
Pharmacy
Research Article
Available online through
ISSN: 2277-9469
www.jsrponl
ine.com
Controlled Release Drug Delivery System of Repaglinide to Improve its Bioavailability
Hareesh Dara1*, Narasimha Reddy Yellu2
1Shri College of Pharmacy, Kakatiya University, Kothagudem, Warangal - 506009, Andhra Pradesh, INDIA.
2Dept of Pharmacology and Clinical Pharmacy, University Col Ege of Pharmaceutical Sciences, Kakatiya University, Warangal - 506009, Andhra
Pradesh, INDIA.
Received on: 23-11-2014; Revised and Accepted on: 27-12-2014
ABSTRACT
T
he purpose of present reaserch work was to prepare and evaluate the controlled release tablets of Repaglinide. Direct compression method was used to prepare the tablets using different polymers include Eudragit S-100, Eudragit RSPO, Eudragit RLPO, Eudragit L-100, HPMC K4M and HPMC K15M. Formulations were prepared by varying the amount of polymers. The prepared tablets were (F1-F12) evaluated for both precompression and postcompression parameters. The compatability of drug with polymers is identified by FTIR studies.The resulta obtained showed that the drug is compatible with all the polymers used.Key words:Repaglinide, Eudragit (S-100, RSPO, RLPO and L-100), HPMC (K4M and K15M), Direct compression method.
INTRODUCTION
O
ver the past 30 years, as the expense and complicationsinvolved in marketing new entities have increased, with concomitant recognition of the therapeutic advantages of controlled drug delivery of, greater attention has been focused on development of controlled release drug delivery systems. It is generally been recognized that for most disease states, a substantial number therapeutically effective compounds already exists. The effectiveness of these drugs, however, is often limited by side effects or the necessity to administer the compound in a clinical setting. The goal in designing a controlled delivery system is to reduce the frequency of dosing or to increase the effectiveness of the drug by localization at the site of action, reducing the dose required or
providing uniform drug delivery[1, 2].
Most conventional oral drug products, such as tablets and capsules, are formulated to release the active drug immediately after oral administration, to obtain rapid and complete systemic drug absorption. Such immediate-release products result in relatively rapid drug absorption and onset of accompanying
pharmacodynamic effects[3]. However, after absorption of the drug
from the dosage form is complete, plasma drug concentrations decline according to the drug's pharmacokinetic profile. Eventually, plasma drug concentrations fall below the minimum effective plasma concentration (MEC), resulting in loss of therapeutic activity. Before this point is reached, another dose is usually given if a sustained therapeutic effect is desired. An alternative to administering another dose is to use a dosage form that will provide sustained drug release, and therefore maintain plasma drug concentrations, beyond what is a typically seen using
immediate-release dosage form[4, 5].
The term modified-release drug product is used to describe products that alter the timing and/or the rate of release of the drug substance. A modified-release dosage form is defined "as one for which the drug-release characteristics of time course and/or location are chosen to accomplish therapeutic or convenience objectives not offered by conventional dosage forms such as solutions, ointments, or promptly dissolving dosage forms as presently recognized".
Repaglinide is an oral blood glucose-lowering drug of the meglitinide class used in the management of type 2 diabetes mellitus. BCS class II compounds are poorly soluble but highly
*Corresponding author:
Hareesh DaraShri College of Pharmacy, Kakatiya University,
Kothagudem, Warangal - 506009, Andhra Pradesh, INDIA. *E-Mail: [email protected]
permeable, and they exhibit bioavailability that is limited by dissolution rate. The half-lives Repaglinide of is 1hr. Therapeutic compounds with short half - lives are excellent candidates for controlled/ sustained - release preparations, since this can reduce dosing frequency. Compounds with longer half - lives, such more than 8 h, also do not need to be in the form of controlled release, since their effect is already sustained.
The usual goal of an oral controlled - release dosage form is to maintain therapeutic blood levels, over an extended period of time several works has been done on Repaglinide to improve its bioavailability since it has high first pass metabolism. A drug must be absorbed and enter the circulation at approximately the same rate at which it is eliminated. The elimination rate is quantitatively described by the half - life (t 1/2). Each drug has its own characteristic elimination rate, which is the sum of all elimination process, including metabolism, urinary excretion, and all other processes that permanently remove drug from the bloodstream. Thus this dosage form improves the bioavailability as well as improves patient compliance.
MATERIALS AND METHODS
Materials:
Repaglinide was obtained as a gift sample from Biocon India Ltd Bangalore, India.All other chemicals were standard grade obtained from SD Fine chemicals.
Methodology:
Preformulation studies:[7, 8]
Before formulation of drug substances into a dosage form, it is essential that drug and polymer should be chemically and physically characterized. Preformulation studies give the information need to define the nature of the drug substance and provide a framework for the drug combination with pharmaceutical excipients in the fabrication of a dosage form.
Calibration curves of Repaglinide in different media:
Principle:The calibration curve is based on the spectrophotometry. The maximum absorption of Repaglinide was observed at 228nm. It obeyed Beer’s law in the concentration range of 1 -10 µg/ml.
Calibration curve of Repaglinide in phosphate buffer of pH 6.8:
Hareesh Dara et al., J. Sci. Res. Phar. 2015, 4(1), 6-11
solution of strength 100µg/ml (stock II). From this secondary stock 0.2, 0.4, 0.6, 0.8, 1.0 and 1.2ml, were taken separately in 10 ml volumetric flasks and made up to 10ml with of phosphate buffer pH 6.8, to produce 2,4, 6, 8 10 and 12µg/ml respectively. The absorbance was measured at 228nm using a UV spectrophotometer. A plot of concentrations of drug versus absorbance was plotted. The linear regression analysis was done on absorbance data points. A straight-line equation was generated to facilitate the calculation of amount of drug. This procedure is repeated 3 times and the average value will be taken into consideration.
Calibration curve of Repaglinide in 0.1 N HCl:
The stock solution of Repaglinide was freshly prepared by dissolving 100 mg of Repaglinide few ml of 0.1 N HCl (5ml) in a 100ml volumetric flask and then make up the solution upto the mark using 0.1N HCl for obtaining the solution of strength 1000µg/ml (stock I). 10ml of this solution is diluted to 100ml with of 0.1 N HCl to obtain a solution of strength 100 µg/ml (stock II). From this secondary stock0.5, 1.0, 1.5, 2.0, 2.5 and 3.0ml, was taken separately in a 10 ml volumetric flask and made up to 10ml with of 0.1 N HCl, to produce 5, 10, 15, 20, 25 and 30µg/ml respectively. The absorbance was measured at 228nm using a UV spectrophotometer. A plot of concentrations of drug versus absorbance was plotted. The
linear regression analysis was done on absorbance data points. A straight-line equation was generated to facilitate the calculation of amount of drug. This procedure is repeated 3 times and the average value will be taken into consideration.
Fourier transform infrared spectrophotometry (FTIR):
Compatibility study of drug with the excipients was determined by FTIR Spectroscopy. The pellets were prepared at high compaction pressure by using KBr and the ratio of sample to KBr is 1:100. The pellets thus prepare were examined and the spectra of drug and other ingredients in the formulations were compared with that of the original spectra.
Formulation:
A. Preparation of Repaglinide tablets:
Direct compression method:Different tablets formulations were prepared by direct compression technique. All powders were passed through 60 mesh. Required quantities of drug and polymers were mixed thoroughly Magnesium stearate was added as lubricant. Talc was used as glidant. Micro crystalline cellulose was used as diluent. Finally the powder mix was subjected to compression after mixing uniformly in a polybag. Prior to compression, the blends were evaluated for several tests.
Table No. 1: Composition of Formulations of repaglinide containing Eudragit (L-100, RSPO, RLPO, S-100)
Ingredients F1 F2 F3 F4 F5 F6 F7 F8
Repaglinide 2 2 2 2 2 2 2 2
Eudragit L-100 4 8 - - -
-Eudragit RSPO - - 4 8 - - -
-Eudragit RLPO - - - 4 8
Eudragit S-100 - - - - 4 8 -
-Magnesium
stearate 1.5 1.5 1.5 1.5 1.5 1.5 1.5 1.5
Talc 1.5 1.5 1.5 1.5 1.5 1.5 1.5 1.5
MCC 66 52 66 52 66 52 66 52
Total weight 75 75 75 75 75 75 75 75
Table No. 2: Composition of Formulations of repaglinide containing HPMC K4M, HPMC K15M
Ingredients F9 F10 F11 F12
Repaginide 2 2 2 2
HPMC k4M 12 16 -
-HPMC K15M - - 12 16
Magnesium stearate 1.5 1.5 1.5 1.5
Talc 1.5 1.5 1.5 1.5
MCC 58 54 58 54
Total weight 75 75 75 75
Post Compression Parameters: Evaluation of uncoated tablets: Shape and colour:
The tablets were examined under a lens for the shape of the tablet and colour by keeping the tablets in light.
Uniformity of thickness:
Randomly 10 tablets were taken from formulation batch and their thickness (mm) was measured using a Vernier callipers.
Hardness test:
The hardness of the tablets was determined using
Monsanto hardness tester. It is expressed in Kg/cm2. Six tablets were
randomly picked from each formulation.
Friability test:
It is the phenomenon whereby tablet surfaces are damaged and/or show evidence of lamination or breakage when subjected to mechanical shock or attrition. The friability of tablets was determined by using Roche friabilator (Lab India, FT 1020). It is expressed in percentage (%). Ten tablets were initially weighed [W(initial)] and transferred into friabilator. The friabilator was
operated at 25 rpm for 4 min or run up to 100 revolutions. The
tablets were weighed again [W(final)].The percentage friability was
then calculated by,
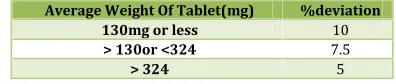
Weight variation test:
The tablets were selected randomly from each formulation and weighed individually to check for weight variation. The U.S Pharmacopoeia allows a little variation in the weight of a tablet. The
% deviation in weight variation is shown inTable. 3.
Table No. 3: Limits of Weight variation
Average Weight Of Tablet(mg) %deviation
130mg or less 10
> 130or <324 7.5
> 324 5
Drug Content estimation:
The content uniformity test is used to ensure that every tablet contains the amount of drug substance intended with little variation among tablets within a batch.
Ten tablets were weighed and crushed in the mortar. The powder equivalent to 1.25 mg of the drug were weighed and dissolved in 100ml phosphate buffer pH 6.8 to give a concentration of 12.5 µg/ml. 2ml of this solution was taken and diluted to 10ml to give a concentration of 2.5µg/ml. The absorbance of the prepared solution was measured at 228nm using UV Visible spectrophotometer (Lab India, UV-3200).
Hareesh Dara et al., J. Sci. Res. Phar. 2015, 4(1), 6-11
buffer which is maintained at 37±0.5̊c, rotated at 50 rpm. At selected regular intervals, the tablet is withdrawn the excess water was blotted with tissue paper. This procedure was repeated until the tablet reaches constant weight. The swelling index was calculated by using following formula
% swelling index = {(Wt) – (Wo) / (Wt)} × 100
Water uptake:A piece of tissue paper folded twice was placed in a petridish containing 5ml of water. A pre weighed tablet was placed on the paper and time for complete wetting was measured which is characterized by coloring of tablet.
R was determined according to the following formula.
R = (Wa– Wb/ Wb) 100
In vitro Drug release study:[7, 8]The drug release was studied using
USP type II apparatus at 37 ± 0.5°C and at 50rpm usingthe pH of the dissolution medium was kept for 2 h with 0.1NHCl was prepared by taking 8.5ml of HCl in 1000ml of water. Then, 6.8 g of KH2PO4 and 0.8 g of NaOH were added, adjusting the pH to 6.8. The release rate analysis was done. 1ml of the sample solution was withdrawn at predetermined time intervals, filtered, diluted suitably and analyzed spectrophotometrically. Equal amount of the fresh dissolution medium was replaced immediately after withdrawal of the test sample. Percentage drug dissolved was calculated.
Model fitting for drug release kinetics:[6]
Drug release kinetics can be analyzed by various mathematical models, which are applied considering the amounts of drug released from 0 to 24hrs. Following equations presents the models tested. Depending on these estimations, suitable mathematical models to describe the dissolution profiles were determined. The following plots were made: cumulative % drug release versus time (zero order kinetic model); log cumulative % drug remaining versus time (firstorder kinetic model); cumulative % drug release versus square root of time (Higuchi model).
A. Zero order kinetics:[6]
Drug dissolution from pharmaceutical dosage forms that do not disaggregate and release the drug slowly (assuming that area does not change and no equilibrium conditions. are obtained) can be represented by the following equation:
Q1= Q0+K0t
Where Q is the amount of drug dissolved in time t, Q is the
initial amount of drug in the solution (most times, Q 50) andKis the
zero order release constant.
B. First order kinetics:[6]
The application of this model to drug dissolution studies was first proposed by Gibaldi and Feldman (1967) and later by Wagner (1969). This model has been also used to describe absorption and/or elimination of some drugs, although it is difficult to conceptualize this mechanism in a theoretical basis. The following relation can also express this model:
lnQt=lnQ0–k1t
Where Qt is the amount of drug released in time t, Q0 is the
initial amount of drug in the solution andKis the first order release
constant. In this way a graphic of the decimal logarithm of the released amount of drug versus time will be linear. The pharmaceutical dosage forms following this dissolution profile, such as those containing water-soluble drugs in porous matrices, release the drug in a way that is proportional to the amount of drug remaining in its interior, in such way, that the amount of drug released by unit of time diminishes.
C. Higuchi model:[6]
Higuchi (1961, 1963) developed several theoretical models to study the release of water soluble and low soluble drugs incorporated in semi-solid and/or solid. Mathematical expressions were obtained for drug particles dispersed in a uniform matrix behaving as the diffusion media. In a general way it is possible to resume the Higuchi model to the following expression:
Qt= KHt1/2
Where Qt is amount of drug released in time t and KH is release rate constants. Higuchi describes drug release as a diffusion process based in the Fick’s law, square root time dependent. This relation can be used to describe the drug dissolution from several types of modified release pharmaceutical dosage forms, as in the case of some transdermal systems (Costa et al., 1996) and matrix Tablets with water soluble drugs.
D. Korsmeyer–Peppas model:[6]
Korsmeyer et al. (1983) developed a simple, semi empirical model, relating exponentially the drug release to the elapsed time
(t). An equation that can be described in the following manner:
Mt/ M∞= atn
where a is a constant incorporating structural and geometric characteristics of the drug dosage form, n is the release exponent, indicative of the drug release mechanism, and the function of t is M /M (fractional release of drug). Peppas (1985) used this n value in order to characterize different release mechanisms, concluding for values for a slab, of n =0.5 for Fick diffusion and higher values of n, between 0.5 and 1.0, or n=1.0, for mass transfer following a non-Fickian model.
RESULTS & DISCUSSION
Pre-Formulation Studies
Calibration curves of Repaglinide in different media:
Standard graph of Repaglinide in different media was plotted by taking concentration ranging from 1 to 30µg/ml.
Calibration of Repaglinide in PBS pH 6.8:
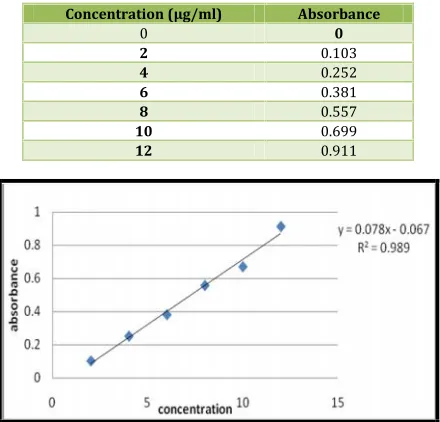
Standard graph of repaglinide in PBS pH 6.8 was plotted by taking concentration ranging from 2 to 12µg/ml. The absorbance
values for their respective concentration were shown inTable. 4
and the standard graph were shown inFig. 1.
Table No. 4: Calibration of Repaglinide in PBS pH 6.8
Concentration (µg/ml) Absorbance
0 0
2 0.103
4 0.252
6 0.381
8 0.557
10 0.699
12 0.911
Fig. 1: Calibration graph of Repaglinide PBS pH 6.8
The slope and intercept values were found to be 0.078
and 0.067and the Coefficient of Correlation (R2) was found to be
0.989.From the slope and intercept values it was found that the curve is having a positive slope and intercept. As the coefficient of correlation value is 0.989 the values are acceptable.
Calibration of Repaglinide in 0.1N HCl:
Hareesh Dara et al., J. Sci. Res. Phar. 2015, 4(1), 6-11
values for their respective concentration were shown inTable. 5
and the standard graph were shown inFig. 2.
The calibration curve of Repaglinide in 0.1 N HCl was constructed by taking 5, 10, 15, 20, 25 and 30µg/ml as the serial concentrations and then finding the corresponding absorbance values by spectrometrically at 240nm.
Table No. 5: Calibration of Repaglinide in 0.1N HCl
Concentration (µg/ml) Absorbance
0 0 5 0.103 10 0.222 15 0.342 20 0.463 25 0.568 30 0.693
Fig. 2: Calibration graph of Repaglinide in 0.1N HCl
The slope and intercept values were found to be 0.023 and 0.012
and the Coefficient of Correlation (R2) was found to be 0.999. From
the slope and intercept values it was found that the curve is having a positive slope and intercept. As the coefficient of correlation value is 0.999 the values are acceptable.
FT-IR (Fourier Transform Infrared Spectrophotometry):
3305.356 344.966
2934.001 63.660
2851.562 43.331 2803.498 98.909
1685.302 515.513 1605.080 120.196
1560.765 568.839 1490.191 107.210
1447.774 125.551 1426.349 95.560
1339.197 136.768 1299.790 59.699
1210.710 792.811 1147.917 231.801
1089.584 397.350 1063.689 45.875
1039.572 134.182 940.225 87.117 919.083 63.774 861.734 287.199
804.867 97.316
781.409 198.470 758.012 430.941
648.694 246.441 617.721 138.734 573.459 70.991
548.627 75.845 495.975 75.087
475.355 51.956
417.338 60.029
Repaglinide
3800 3600 3400 3200 3000 2800 2600 2400 2200 2000 1800 1600 1400 1200 1000 800 600 400 200 110 100 90 80 70 60 50 40 Wavenumber % T ra n s m it ta n c e
Fig. 3: FT-IR Spectra of Repaglinide
3307.187 160.788
2934.102 41.282
2805.271 40.626 1685.353 409.109 1634.939 18.977 1605.599 68.098
1490.339 50.457 1448.221 69.325 1426.632 50.416
1381.871 71.125
1339.404 74.532 1300.261 32.707
1211.416 527.122
1148.144 121.932
1089.689 174.597
1039.883 67.856
940.544 72.504
919.507 35.844
862.095 146.971 805.148 47.346
781.752 112.486 758.492 251.296 697.995 151.235
648.919 108.885 617.804 64.869
573.379 29.969 448.423 56.978
417.375 2.846 Repaglinide+HPMC K 15 M
3800 3600 3400 3200 3000 2800 2600 2400 2200 2000 1800 1600 1400 1200 1000 800 600 400 200 100 90 80 70 60 Wavenumber % T ra n s m it ta n c e
Fig. 4: FT-IR Spectra of Repaglinide, HPMC
3305.456 99.928
2917.482 351.344 2850.566 60.805 2805.465 24.588
1685.285 282.626 1634.331 228.297
1605.446 33.610
1490.127 26.033 1458.908 1.172
1448.288 42.279 1426.772 38.746
1381.596 38.199 1339.035 28.562
1300.497 20.706 1211.228 309.328 1147.998 71.630
1111.408 37.508
1090.072 85.474 1039.636 35.179
940.627 31.597 919.558 21.056
903.159 6.464
862.196 81.704 805.066 29.726
781.817 70.956
695.173 56.726 668.625 25.587 616.479 2.764
548.809 22.002 447.918 24.349 417.019 15.017 optimized formulation
3800 3600 3400 3200 3000 2800 2600 2400 2200 2000 1800 1600 1400 1200 1000 800 600 400 200 100 90 80 70 60 Wavenumber % T ra n s m it ta n c e
Hareesh Dara et al., J. Sci. Res. Phar. 2015, 4(1), 6-11
The spectra for pure Repaglinide and for the physical mixture of Repaglinide and all the polymers were determined to check the intactness of the drug in the polymer mixture using FTIR-Spectrophotometer by disc method.
Table No. 6: Wave number for the characteristic bands in the IR spectra of pure Repaglinide
Wave number in cm-1 Characteristic bands
1447.77 Aromatic(C=C)
2934 CH3 Streching
1339.19 CH2 bending
3306.35 N-H streching
1685.30 Cyclic c=0
The comparative FTIR studies of Drug and excipients combination had shown negligible variation in the values as
compared with that of only pure form of Drug. Therefore it implies good compatibility of drug and excipients.
Evaluation of Powders:
Bulk density of all formulations was in the range of 0.41gm/cc to 0.48gm/cc. Tapped density of all formulations was in the range of 0.57gm/cc to 0.66gm/cc. Carr’s index of all the formulations of with Eudragit and HPMC were between 21.4% and 34.7% respectively, which indicates the flow properties of the powders of all formulations are excellent. Hausner's Ratio of all the formulations of powders with Eudragit and HPMC were between 1.35 and 1.56 respectively which indicates the flow properties of the powders of all formulations are excellent. The powders with ethyl Eudragit had an angle of repose ranging from 31.2 to 35.9 indicates that all of the formulations made with Eudragit had excellent flow properties.
In-vitro Drug Release study:
Table No. 7: Cumulative % drug release of F1, F2, F3, F4, F5, F6
Formulation F1 F2 F3 F4 F5 F6
0 0 0 0 0 0 0
30 22.62 18.59 26.57 28.36 26.58 20.72
60 36.95 26.59 33.57 33.57 30.57 31.25
120 44.59 35.27 39.84 36.95 42.59 36.59
240 56.85 50.29 44.14 52.29 56.87 46.58
360 66.63 62.57 53.68 58.28 68.52 58.67
480 78.25 71.58 66.59 68.74 72.59 66.27
600 81.89 79.68 79.86 79.48 77.59 71.43
720 88.69 86.57 85.8 89.57 87.48 83.25
n=3±S.D (All the values are average of three determinations)
Formulations F1, F2 were prepared by using Eudragit L-100 is in the ratio of 1:2 and 1:4 shows drug release is about
88.69%, 86.57% up to 12thhr. Formulations F3, F4 were prepared
by using Eudragit RSPO is in the ratio of 1:2, 1:4 shows drug release
is abot 85.8%, 89.57% up to 12thhr. Formulations F5, F6 were
prepared by using Eudragit S-100 is in the ratio of 1:2, 1:4 shows
drug release is abot 87.48%, 83.25% at the end of the 12thhr.
Fig. 6: Dissolution graphs of F1, F2, F3, F4, F5 & F6
Table No. 8: Cumulative % drug release of F7,F8,F9,F10,F11,F12
Formulation F7 F8 F9 F10 F11 F12
0 0 0 0 0 0 0
30 18.62 28.59 23.87 23.25 11.25 18.97
60 28.57 32.45 34.36 33.57 27.30 27.57
120 31.59 38.64 46.57 40.19 31.24 32.54
240 35.27 52.59 59.67 51.05 49.57 43.29
360 47.58 68.57 68.39 61.29 56.27 56.27
480 61.85 76.38 77.59 73.59 61.20 69.57
600 73.72 79.41 81.98 81.25 86.37 77.45
720 85.65 86.29 89.54 89.37 97.82 85.69
Formulations F7, F8 were prepared by using Eudragit RLPO is in the ratio of 1:2 and 1:4 shows drug release is about
85.65%, 86.29% up to 12thhr. Formulations F9, F10 were prepared
by using HPMC K4M is in the ratio of 1:6, 1:8 shows drug release is
abot 89.54%, 89.37% up to 12thhr. Formulations F11, F12 were
prepared by using HPMC K15M is in the ratio of 1:6, 1:8 shows drug
release is abot 97.82%, 85.69% at the end of the 12thhr. Among all
Hareesh Dara et al., J. Sci. Res. Phar. 2015, 4(1), 6-11
Fig. 7: Dissolution graphs of F7, F8, F9, F10, F11 & F12
Model fitting for drug release:
Table No. 9: Kinetic model fitting data for all formulations
Formulation code Zero-order First-order Higuchi Korsmeyer-Peppas Best fit model
Slope R2 slope R2 slope R2 slope R2
F1 6.263 0.867 -0.070 0.983 24.71 0.984 0.404 0.984 Higuchi
F2 6.499 0.928 -0.066 0.992 24.98 0.999 0.484 0.999 Higuchi
F3 5.855 0.904 -0.061 0.950 22.40 0.965 0.352 0.942 Higuchi
F4 6.054 0.906 -0.067 0.940 23.30 0.978 0.358 0.960 Higuchi
F5 6.046 0.867 -0.064 0.971 23.85 0.984 0.385 0.991 Korsmeyer-Peppas
F6 5.754 0.905 -0.054 0.968 22.28 0.989 0.408 0.987 Higuchi
F7 6.045 0.947 -0.058 0.930 22.49 0.955 0.437 0.928 Higuchi
F8 6.122 0.8795 -0.010 0.9821 23.98 0.983 0.369 0.968 Higuchi
F9 6.283 0.861 -0.010 0.981 24.89 0.984 0.408 0.993 Korsmeyer-Peppas
F10 6.316 0.910 -0.010 0.975 24.41 0.991 0.398 0.988 Higuchi
F11 7.248 0.952 -0.014 0.806 27.01 0.963 0.587 0.946 Higuchi
F12 6.349 0.946 -0.009 0.981 24.06 0.991 0.454 0.981 Higuchi
The results of dissolution data were fitted to various drug release kinetic equations. Regression coefficient (R²) value was highest for Higuchi release equation in formulation F11.The kinetics of dissolution data with R² value obtained from formulation F1, F2,
F3, F4, F5, F6, F7, F8, F9, F10, F11 & F12 are tabulated inTable. 9.
Formulation F11 plots of Zero order, First order, Higuchi and Korsmeyer-peppas are depicted.
Among the various formulations studies, formulations F11 is considered as ideal formulation which exhibited 97.82% of drug release in 12hrs. The R² values of Higuchi model were found to be highest among all other models for this formulation.
CONCLUSION
T
he aim of the present study was to develop ancontrolled release formulation of Repaglinide to maintain constant therapeutic levels of the drug for over 12 hrs. Various grades of HPMC were employed as polymers. Repaglinide dose was fixed as 2 mg. Total weight of the tablet was considered as 75 mg. Polymers were used in the concentration of 12 and 16mg concentration. All the formulations were passed various physicochemical evaluation parameters and they were found to be within limits. Whereas from the dissolution studies it was evident that the formulation (F11) showed better and desired drug release pattern i.e.,97.82 % in 12 hours. It followed zero order release kinetics mechanism.
REFFERENCES:
1. Agis Kydonieus, Treatise on controlled drug delivery Marcel Dekker, Inc. NewYork, 70, 199 – 203
2. Aithal KS. And Udupa N, “Controlled Fluoride Release Tablets using MethylCellulose and Hydroxy Propyl Methyl Cellulose”, The Indian Drugs, 1994, 31(7); 298 - 301. 3. “American Society of Health System Pharmacist”, Bethesda,
Maryland and Spring House Corporation, Spring House, Pennsylvania, 638 - 640.
4. Anna Viridén, Bengt Wittgren, Anette Larsson. Investigation of critical polymer properties for polymer release and swelling of HPMC matrix tablets. European journal of pharmaceutical
sciences,2009; 36: 297-309.
5. Bankers GS and Rhodes CT. Modern Pharmaceutics (3rd
Edn.), Marcel Dekker, New York,1995; 575.
6. Lachman Leon, Liberaman HA, and Kanig JL. The Theory
and practice of Industrial Pharmacy (3rd Edn), Varghese
Publishing House Bombay, 430.
7. Brahmankar DM, Karwa RM, Jaiswal SB. Cellulose matrix for controlled release of Ketorolac tromethamine, Indian
Drugs,1996; 33(3): 120-123.
8. Lachman Leon and Liberaman HA. Pharmaceutical Dosage
Forms Tablets,Marcel Dekker Inc., New York N.Y., 1980; 2:
246.
How to cite this article:
Hareesh Dara et al.,: Controlled Release Drug Delivery System of Repaglinide to Improve its Bioavailability, J. Sci. Res. Phar., 2015; 4(1): 6-11.
Conflict of interest:The authors have declared that no conflict of interest exists.