Predicting Active Pulmonary
Tuberculosis Using an Artificial Neural
Network*
Ali A. El-Solh, MD; Chiu-Bin Hsiao, MD; Susan Goodnough, RN;
Joseph Serghani, MD; and Brydon J. B. Grant, MD, FCCP
Background:
Nosocomial outbreaks of tuberculosis (TB) have been attributed to unrecognized
pulmonary TB. Accurate assessment in identifying index cases of active TB is essential in
preventing transmission of the disease.
Objectives:
To develop an artificial neural network using clinical and radiographic information to
predict active pulmonary TB at the time of presentation at a health-care facility that is superior
to physicians’ opinion.
Design:
Nonconcurrent prospective study.
Setting:
University-affiliated hospital.
Participants:
A derivation group of 563 isolation episodes and a validation group of 119 isolation
episodes.
Interventions:
A general regression neural network (GRNN) was used to develop the predictive
model.
Measurements:
Predictive accuracy of the neural network compared with clinicians’ assessment.
Results:
Predictive accuracy was assessed by the c-index, which is equivalent to the area under the
receiver operating characteristic curve. The GRNN significantly outperformed the physicians’
prediction, with calculated c-indices (
6
SEM) of 0.947
6
0.028 and 0.61
6
0.045, respectively
(p
<
0.001). When the GRNN was applied to the validation group, the corresponding c-indices
were 0.923
6
0.056 and 0.716
6
0.095, respectively.
Conclusion:
An artificial neural network can identify patients with active pulmonary TB more
accurately than physicians’ clinical assessment.
(CHEST 1999; 116:968 –973)
Key words:c-index; neural network; nosocomial outbreaks; tuberculosisAbbreviations: CD45cluster of differentiation 4; CI5confidence interval; GRNN5general regression neural network; TB5tuberculosis
T
he most important aspect of a tuberculosis (TB)
infection control program is to identify patients
who may have contagious active TB, to isolate them
while they are contagious, and to treat them
effec-tively. The process of recognizing those persons with
active TB is, however, fraught with difficulty. As a
result, numerous outbreaks of
Mycobacterium
tuber-culosis
have been reported in several types of
facili-ties. At least 21 episodes of nosocomial transmission
of
M tuberculosis
have been documented in the
United States medical literature.
1Among the factors
that have been associated with missed or delayed
diagnosis are failure to consider the diagnosis,
non-classical or atypical radiographic presentation,
de-layed recognition of drug resistance, lapses in TB
isolation practices, and lack of adequate respiratory
protection.
2–5Prediction models to identify patients with active
TB have been lacking. The reason for this lies in the
complexity of the clinical and radiographic
presenta-tion, the relatively small patient samples, and the use
of modeling techniques that are poorly suited for the
task. Recently, El-Solh et al
6introduced a
classifica-tion tree to assist physicians in their decision
regard-ing whether respiratory isolation for suspicion of
active pulmonary TB is needed. The model achieved
a high degree of sensitivity at the expense of low
specificity.
Previous investigators have used an artificial
intel-ligence paradigm, referred to as a
neural network, to
provide a prediction outcome for complex clinical
*From the Department of Medicine (Drs. El-Solh and Grant), Division of Pulmonary and Critical Care Medicine, the Division of Infectious Disease (Dr. Hsiao and Ms. Goodnough), and the Department of Radiology (Dr. Serghani), Erie County Medical Center, and the Veterans Affairs Medical Center, State Univer-sity of New York at Buffalo, School of Medicine and Biomedical Sciences, Buffalo, NY.
Manuscript received January 29, 1999; revision accepted May 19, 1999.
Correspondence to: Ali El-Solh, MD, Division of Pulmonary and Critical Care Medicine, Erie County Medical Center, 462 Grider St, Buffalo, NY 14215; e-mail: [email protected]
problems. Neural networks are computation systems
that process information in parallel, using large
numbers of simple units, and that excel in tasks
involving pattern recognition. These intrinsic
prop-erties of the neural networks have been translated
into a higher performance accuracy in outcome
prediction compared with expert opinion or
conven-tional statistical methods.
7,8Therefore, we
hypothe-sized that the ability to identify patients correctly
with active pulmonary TB could be improved by
using computer analyses involving neural networks.
To test this hypothesis, we have applied an artificial
neural network (available at:
http://bgrant.med.buf-falo.edu/activetb/) to the analysis of data from
pa-tients who are considered to be at high risk for active
pulmonary TB and compared the network output to
physicians’ prediction.
Materials and Methods
Study SettingThe study was conducted at the Erie County Medical Center, a 479-bed tertiary-care teaching facility affiliated with the State University of New York at Buffalo. During the study period from August 1992 to June 1997, the hospital was the major referral center for TB in Erie County and provided all inpatient medical care for inmates from county and state correctional facilities in the area. Because of the shortcomings in the diagnosis of TB and resulting delay in considering the diagnosis, an automatic isola-tion policy was instituted by the Infecisola-tion Control Service in August of 1992 for all patients from whom an acid-fast smear and culture were requested. Isolation was discontinued only after documentation of three negative results of acid-fast bacilli smears that were obtained on 3 separate days or a negative result of an acid-fast bacilli smear derived from BAL.
Study Population
Between August 1992 and June 1997, 704 patients were isolated for suspicion of active pulmonary TB. Twenty-two patients were excluded from the study: 17 were discharged before three respiratory specimens were collected, and 5 refused diagnostic bronchoscopy. Five hundred sixty-three consecutive patients were used to design the neural network and were referred to as the derivation set. The remaining 119 patients formed the validation set.
The decision to isolate patients for suspicion of active TB was made by emergency department physicians, medical residents’ or infectious disease fellows after consultation with the attending physician based on symptoms, history of TB exposure, HIV status, positive results of tuberculin skin tests, and radiographic findings. Information regarding demographics (age, gender, date, and duration of isolation), social status (risk factors for HIV purified protein derivative status), and clinical symptoms (fever, night sweats, chest pain, and productive cough for.2 weeks) was collected from each patient at the time of presentation at the health-care facility. Weight loss was defined as a fall of.10% of ideal body weight within the previous 6 months. The physicians’ prediction regarding whether the patient had active pulmonary TB was also recorded. Data concerning the results of acid-fast
bacilli smears and cultures were recorded once the data were available. For those patients who are known to be HIV seropos-itive, the cluster of differentiation 4 (CD4) counts were entered into the database only if they were obtained within the previous 3 months of patient isolation. HIV-seronegative patients were presumed to have CD4 counts.200 cells/mL.
Radiographic Analysis
Chest roentgenograms were divided into two zones: the upper zones delineated by the area above the right and the left fifth ribs posteriorly, and the lower zones below the right and left fifth ribs posteriorly. Upper zone disease was defined as absent only if there were no radiographic abnormalities involving the area above the fifth rib posteriorly. The pattern and distribution of the parenchymal infiltrates (interstitial, nodular, or miliary) or cavi-ties were recorded. The presence and location of adenopathy and pleural effusion were also noted. Interpretation of the chest radiographs was performed by a pulmonologist and a radiologist who were blinded to the microbiology results of sputum stains or cultures.
Bacteriology
The auramine-rhodamine9fluorescent stain was used to detect
acid-fast organisms on respiratory specimens. Radiometric broth medium (BACTEC; Becton Dickinson Diagnostic Instruments Systems; Sparks, MD) was used for inoculation of acid-fast bacilli cultures. M tuberculosis isolates were confirmed with nucleic acid probes (Gene-Probe; San Diego, CA).
Development of the Artificial Neural Network
A general regression neural network (GRNN) was used in the development of the predictive model.10 The advantage of the
GRNN lies in the fact that whereas conventional nonlinear regression techniques involvea priorispecification of the struc-ture of the regression equations to yield a best fit for the data presented, the GRNN circumvents these restrictions by adjusting the surface dimension in which the regression surface resides without constraining it to a specific form. Generalization is optimized by modifying the smoothing factor, d, which deter-mines how tightly the network matches its predictions to the data in the training patterns.
The structure of the GRNN used in this model consists of three layers: an input layer, a hidden layer, and an output layer. Input parameters were chosen based on data collected in a previous study.6The input patterns are formed by 21 distinct
parameters (Table 1). These parameters are divided into three groups: demographic variables, constitutional symptoms, and radiographic findings. Intervening layers of processors, called hidden units, detect higher-order features in the input layer, analyze the signal, and relay the output to other neurons to make a correct response. The number of neurons in the hidden layer is determined by the number of patterns in the training set as GRNNs require one neuron per pattern processed. The output of the GRNN provides an estimate of the likelihood of active pulmonary TB.
A 10-fold cross-validation approach was used for evaluation.11
The entire data set of the derivation group was divided with a random number generator into 10 subsets. Nine of the 10 subsets were pooled and used for training. The data from the 10th subset were used as an evaluation set during training. The entire process was repeated nine additional times by rotating the subset that was used as the evaluation set during training. The mean square error
was computed for each of the 10 neural networks on the entire derivation data set. The mean square errors were averaged, and the artificial neural network that had a mean square error closest to the average was selected.
To normalize the inputs, all independent variables were scaled to a value over a range between 0 and 1. Missing values were substituted with the class mean.
Performance Evaluation:The predictive model derived from the artificial neural network was tested on an entirely different set of patients (validation cohort) who were not included in the derivation set. The validation cohort comprised all patients who were isolated between January 1996 and June 1997.
Predictive Properties of the Artificial Neural Network: A receiver operating characteristic curve12 was generated for the
artificial neural network. The receiver operating characteristic curve represents a graphic display of the true-positives (sensitiv-ity) plotted against the false-positives (1-specific(sensitiv-ity) for various thresholds that are used to define active pulmonary TB. The c-index was used to estimate diagnostic accuracy by a method described in detail elsewhere.13The c-index is equivalent to the
area under the receiver operating characteristic curve. In brief, it is calculated by determining the probability of diagnosing active TB correctly in every possible pair of patients: one who has active TB, the other who does not. A bootstrap method was used to calculate directly this measure of accuracy by generating 1,000 data sets from our database by random sampling with replace-ment. Comparisons between the c-indices were assessed based on the confidence intervals (CIs). Commercially available soft-ware was used for designing the artificial neural networks (Neuroshell 2; Ward Systems; Frederick, MD) and for CI analyses (CIA; British Medical Journal; London, UK). Statistical significance was accepted at the 5% level.
Results
The characteristics of the population under study
are shown in Table 2. A total of 10 neural networks
were trained. The models were designed to produce
output values ranging from 0 (no active pulmonary
TB) to 1 (active pulmonary TB). The average mean
squared error for all 10 neural networks was 0.009.
The neural network with the closest mean square
error to the average was used for further analysis.
The chosen network achieved a sensitivity of 100%
(95% CI, 91 to 100%) and a specificity of 72% (95%
CI, 65 to 77%). The physicians correctly diagnosed
active pulmonary TB in 22 of 47 patients for a
sensitivity of 47% (95% CI, 32 to 62%) and a
specificity of 75% (95% CI, 71 to 79%). The
corre-sponding c-indices (6
SEM) for the artificial neural
Table 1—Input Variables Used to Train the Artificial Neural Networks* Demographic variables Age CD4 counts Diabetes mellitus HIV PPD Constitutional symptoms Chest pain Weight loss Cough Night sweats Fever Shortness of breath Radiographic findings Upper lobe infiltrate Lower lobe infiltrate Upper lobe cavity Lower lobe cavity Adenopathy
Unilateral pleural effusion Bilateral pleural effusion Pleural thickening Miliary pattern Normal
*PPD5purified protein derivative.
Table 2—Patients Characteristics*
Characteristics
Derivation Group, n5563 Validation Group, n5119
MTB (1) n547 MTB (2) n5516 MTB (1) n511 MTB (2) n5108 HIV (1)† 24/47 (51) 302/506 (59) 5/11 (45) 61/96 (64) PPD (1)‡ 25/37 (68) 46/398 (12) 7/9 (77) 9/80 (11) Inmate 28 (60) 179 (35) 3 (27) 47 (44) DM 9 (19) 8 (2) 1 (9) 0 Cough 38 (81) 397 (77) 10 (91) 79 (73) Fever 33 (70) 304 (59) 7 (64) 61 (56) Weight loss 30 (64) 140 (27) 6 (55) 24 (22) Night sweats 26 (55) 141 (27) 8 (73) 23 (21)
Upper lobe infiltrate 31 (66) 83 (16) 5 (45) 28 (26)
Upper lobe cavity 12 (26) 15 (3) 2 (18) 0
Unilateral pleural effusion 4 (9) 39 (8) 2 (18) 6 (6)
Miliary pattern 2 (4) 0 1 (9) 0
*MTB5M tuberculosis; DM5diabetes mellitus. See Table 1 for other abbreviations. Values given as No. (%), unless otherwise indicated. †Values given as No. of patients/total No. of patients tested (%).
network and the physicians were 0.947
6
0.028 and
0.61
6
0.045, respectively (p
,
0.001).
The performance of the neural network was tested
prospectively on a new set of 119 patients isolated for
suspicion of active TB. The network identified all 11
patients with active pulmonary TB for a sensitivity of
100% (95% CI, 72 to 100%) and a specificity of 69%
(95% CI, 61 to 78%). In comparison, the physicians
correctly diagnosed active pulmonary TB in 7 of 11
patients, yielding a sensitivity of 64% (95% CI, 31 to
89%) and a specificity of 79% (95% CI, 72 to 87%).
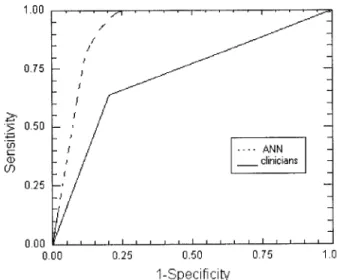
Table 3 depicts a comparison of the diagnostic
performance of the neural networks and that of the
physicians. The diagnostic accuracy of the model,
when applied to the validation set as reflected by the
c-index,
was
0.923
6
0.056
compared
with
0.716
6
0.09
for
the
physicians’
prediction
(p
,
0.05; Fig 1).
Discussion
This study is, to our knowledge, the first to use a
neural network for the diagnosis of active pulmonary
TB. The recommendation issued by the Centers for
Disease Control and Prevention to control the
spread of TB calls for direct isolation of any patient
suspected of having or known to have infectious
TB.
14Standard criteria for early identification of
patients with infectious TB have not been well
established. The task was rendered difficult by the
HIV epidemic in the late 1980s, which has created a
new profile for patients with active TB that has none
of the typical features recognized in classic cases of
active pulmonary TB.
4Predictive models have not fared much better, and
their lack of sensitivity is evidence of the complexity
of the problem. A review of the literature revealed
only a handful of studies that have attempted to
tackle this problem. In a study assessing the
useful-ness of routine admission chest radiography for the
detection of pulmonary TB, the authors concluded
that chest roentgenograms are still useful in
suggest-ing the diagnosis, particularly in geographic areas
with high prevalence for TB.
15Nonetheless, failure
to suspect TB occurred in 64 of 177 cases of
culture-proven TB. Seventeen cases had atypical
presentation, and in 29 patients, TB was not
diag-nosed because of the failure to consider TB despite
the presence of upper lobe disease or miliary
pat-tern. In a similar study, Cohen et al
16evaluated the
clinical symptoms and radiographic configuration in
101 patients who were isolated for suspicion of active
TB. The absence of a typical chest radiograph along
with the presence of cough, sputum production, and
weight loss for
,
2 weeks were strong negative
predictors of active TB. The authors acknowledged,
however, that the population under study was
rela-tively small in number and did not include HIV
patients with normal radiographic presentation, as
has been described in 6 to 18% of HIV-infected
patients with pulmonary TB.
17,18Recently, El-Solh
et al
6developed a classification and regression tree
to predict active pulmonary TB at the time of
admission to a health-care facility. The predictor
variables were upper zone disease on chest
roent-genogram, fever, weight loss, and CD4 count. The
tree was validated in a separate cohort of patients
yielding a sensitivity and a specificity of 100% and
48.1%, respectively. The high precision achieved in
that population was supposedly less than perfect
when tested in a different setting.
19The advantage of the neural networks lies in their
ability to process nonlinear relationships. Because of
the clinical complexity and pathologic heterogeneity
of TB, correct identification of patients with active
disease is unlikely to depend on the presence or
Table 3—Comparison of the Clinician and Artificial Neural Network Performance on the Validation Group
(n5119)*
Groups
Sensitivity Specificity c-Index
% (95% CI) % (95% CI) % (95% CI)
Derivation Physicians 47 (32–62) 75 (71–79) 61.0 (56.4–65.8) ANN 100 (91–100) 72 (65–77) 94.7 (91.0–98.2) Validation Physicians 64 (31–89) 79 (72–87) 71.6 (64.5–78.9) ANN 100 (72–100) 69 (61–78) 92.3 (85.8–99.1)
*ANN5artificial neural network.
Figure 1. Comparison of the receiver operating characteristic curves for the artificial neural network (ANN) and clinicians’ performance as applied to the validation set.
absence of a single defining feature. Hence, it is not
surprising that standard linear statistical
methodolo-gies are relatively inadequate solutions for this type
of problem. In addition, previous studies have shown
that clinicians are not aware of the complex
interac-tion among variables that a neural network can
exploit. Two separate studies have compared the
accuracy of neural networks with that of clinicians to
predict disease or outcome.
7,20In the first study,
emergency department physicians and medical
resi-dents were asked to identify myocardial infarction in
patients presenting at an emergency department
based on clinical and ECG findings. Eight of 36
cases of myocardial infarction were missed by
phy-sicians, compared with only 1 case missed by using
the neural network, yielding sensitivities of 77.7%
(95% CI, 77 to 82.9%) and 97.2% (95% CI, 97.2 to
97.5%), respectively. In another scenario, the overall
accuracy of physicians to predict outcome for
colo-rectal cancer ranged from 75 (95% CI, 66 to 84%) to
79% (95% CI, 71 to 87%), compared with 90% (95%
CI, 84 to 96%) for the neural network. The superior
prediction capability of neural networks over
physi-cian assessment was observed also in this study,
which implies that the complexity of biological
sys-tems may be beyond the analytic capabilities of
physicians.
An essential component of the present study is the
ability of the neural network to generalize to new
population samples. This feature is, however,
af-fected by many factors, such as the number of
neurons in the hidden units, the type of connections
in the network, and the extent to which the network
has been trained. The results obtained from the
validation set indicate that the network described
herein may generalize well to new patient data.
Another advantage of the neural network is its
ability to handle missing values. In logistic
regres-sion, missing values are usually omitted from further
analysis.
6,21In our study, the highest percentage of
missing data occurred in recalling the result of the
purified protein derivative skin test (23%) and CD4
counts (6%). The neural networks incorporated
these cases after substituting the missing value with
the class mean.
There are several potential limitations to the study.
Neural networks have the ability to approximate
predictive output to any desirable degree of accuracy
when provided with enough running time. This
could result in overfitting, particularly when there is
an attempt to increase the processing power of the
network by adding a large number of hidden
neu-rons. In this case, the network will end up learning
not only the training set but also the noise in the
data, which leads to poor generalization. It is
encour-aging that the accuracy of prediction observed in the
validation set points to the fact that the network
architecture is based on robust features rather than
memorizing the idiosyncrasies embedded in the data
set.
It is important to emphasize that these results may
not be applicable to populations in locations where the
epidemiology of TB differs substantially from the area
where the study was conducted. Until the model is
tested on a different population set, the study can be
viewed only as the first attempt in the use of
connec-tionist models in the diagnosis of pulmonary TB. In
addition, only the diagnosis of active pulmonary TB was
studied. Application of the model to extrapulmonary or
extrathoracic TB is not recommended. A good case
could be made for the extension of this technology for
other aspects of TB should this technique prove to be
accurate and reproducible, as the data imply.
Our study has several implications regarding the
clinical application of artificial neural networks as a
diagnostic tool for active TB. The use of the neural
network could provide physicians and health-care
workers with a simple and fast tool with which to
assess the risk of active TB in any patient presenting
at a health-care facility. The estimated probability
would enable physicians to initiate isolation without
delay, thus reducing the risk of TB exposure to
health-care workers.
References
1 Dooley SW, Tapper ML. Epidemiology of nosocomial tuber-culosis. In: Wenzel RP, ed. Prevention and control of noso-comial infections. Baltimore, MD: Williams & Wilkins, 1997; 357–394
2 McGowan JE Jr. Nosocomial tuberculosis: new progress in control and prevention. Clin Infect Dis 1995; 21:489 –505 3 Mathur P, Sacks L, Auten G, et al. Delayed diagnosis of
pulmonary tuberculosis in city hospitals. Arch Intern Med 1994; 154:306 –310
4 Kramer F, Modilevsky T, Waliany AR, et al. Delayed diag-nosis of tuberculosis in patients with human immunodefi-ciency virus infection. Am J Med 1990; 89:451– 456 5 Flora GS, Modilevsky T, Antoniskis D, et al. Undiagnosed
tuberculosis in patients with human immunodeficiency virus infection. Chest 1990; 98:1056 –1059
6 El-Solh A, Mylotte J, Sherif S, et al. Validity of a decision tree for predicting active pulmonary tuberculosis. Am J Respir Crit Care Med 1997; 155:1711–1716
7 Baxt WG. Use of an artificial neural network for the diagnosis of myocardial infarction. Ann Intern Med 1991; 115:843– 848 8 Rutledge R, Fakhry S. The use of neural networking and polynomial regression to predict the outcome in the critically ill: a comparison with APACHE II [abstract]. Crit Care Med 1993; 21(suppl):S213
9 Kent PT, Kubica GP. Public health mycobacteriology: a guide for the level III laboratory. Atlanta, GA: Centers for Disease Control, 1985
10 Specht, D. A general regression neural network. IEEE Trans Neural Networks, 1991; 2:6, 568 –576
11 Weiss SM, Kulikowski CA. How to estimate the true perfor-mance of a learning system. In: Computer systems that learn.
Palo Alto, CA: Morgan Kaufmann, 1991; 17– 49
12 Hanley JA, McNeil BJ. The meaning and use of the area under the receiver operating characteristic (ROC) curve. Radiology 1982; 143:29 –36
13 El-Solh AA, Grant BJB. A comparison of severity of illness scoring systems for critically ill obstetric patients. Chest 1996; 110:1299–1304
14 Guidelines for preventing the transmission ofMycobacterium tuberculosis in health care facilities; 1994. MMWR Morb Mortal Wkly Rep 1994; 43(RR-13):1–132
15 Barnes PF, Verdegem TD, Vachon LA, et al. Chest roent-genogram in pulmonary tuberculosis: new data on an old test. Chest 1988; 94:316 –320
16 Cohen R, Muzaffar S, Capellan J, et al. The validity of classic symptoms and chest radiograhic configuration in predicting pulmonary tuberculosis. Chest 1996; 109:420 – 423
17 Pitchenik AE, Rubinson HA. The radiographic appearance of tuberculosis in patients with the acquired immunodeficiency syndrome (AIDS) and pre-AIDS. Am Rev Respir Dis 1985; 131:393–396
18 Long R, Maycher B, Scalcini M, et al. The chest roentgeno-gram in pulmonary tuberculosis patients seropositive for human immunodeficiency virus type I. Chest 1991; 99:123– 127
19 Steenstra R, Brandon B, Gaeta T. External validation of a decision tree for predicting active pulmonary tuberculosis [abstract]. Am J Respir Crit Care Med 1998; 157:A180 20 Bottaci L, Drew PJ, Hartley JE, et al. Artificial neural
network applied to outcome prediction for colorectal cancer patients in separate institutions. Lancet 1997; 350:469 – 472 21 Doyle HR, Dvorchik I, Mitchell S, et al. Predicting outcomes