Trunk Supervisor
Technical Manual
up to and including version 1.9.0
PROPRIETARY NOTICE
The product information and design disclosed herein were origi-nated by and are the property of Bosch Security Systems, Inc. Bosch reserves all patent, proprietary design, manufacturing, repro-duction, use and sales rights thereto, and to any article disclosed therein, except to the extent rights are expressly granted to others.
COPYRIGHT NOTICE
Copyright 2014 by Bosch Security Systems, Inc. All rights reserved. Reproduction, in whole or in part, without prior written permission from Bosch is prohibited.
*All other trademarks are property of their respective owners.
WARRANTYAND SERVICE INFORMATION
For warranty and service information, refer to the appropriate web site below: RTS Intercoms ... www.rtsintercoms.com/warranty RTS Digital RTSTW AudioCom RadioCom Intercom Headsets...www.telex.com CUSTOMER SUPPORT
Technical questions should be directed to: Customer Service Department
Bosch Security Systems, Inc. www.telex.com
TECHNICAL QUESTIONS EMEA
Bosch Security Systems Technical Support EMEA http://www.rtsintercoms.com/contact_main.php
DISCLAIMER
The manufacturer of the equipment described herein makes no expressed or implied warranty with respect to anything contained in this manual and shall not be held liable for any implied warranties of fitness for a particular application or for any indirect, special, or consequential damages. The information contained herein is subject to change without prior notice and shall not be construed as an expressed or implied commitment on the part of the manufacturer.
Table
of
Contents
INTRODUCTION ... 5
Trunking ...5
INSTALLATION ... 7
Application Requirements ...7
Minimum Software Requirements ... 7
Minimum Hardware Requirements ... 7
Installation ...8
CONFIGURATION ... 9
Configuration Window ...9
Configuration Tab ...10
Port Forwarding ... 10
Network Connection ... 10
Serial Connection ... 11
Graphical Layouts Tab ...14
Alarm Setup Tab ...15
Alarm Archives Tab ...17
Request Archives Tab ...19
Audio Analyzer Test Options ...20
Test Parameters Tab ...21
Test Schedule Tab ...23
STATUS BAR ... 25
Status Bar ...25
Understanding the Status Bar ... 26
TRUNK MASTER NAVIGATION BAR ... 27
Intercoms View ...28
All Alphas View ...29
All Requests View ...31
All Trunks View ...33
ALARMS ...37
Alarms View ...37
Show Trunk Master Alarms Check Box ... 37
Show Intercom Communication Alarms Check Box ... 37
For... Drop Down Menu ... 38
Show RT-2M Alarms or AutoTIMS Alarms Check Box (only when Audio Analyzer is configured) ... 38
Show Acknowledged Alarms Check Box ... 38
Show Request Busy Alarms Check Box ... 38
Show Active Alarms Check Box ... 38
Show Resolved Alarms Check Box ... 38
Show Stale Alarms Check Box ... 38
Show Unresolved Alarms Check Box ... 38
Info Bar 1 (page statistics at bottom of the view) ... 38
Alarms Information View ... 39
GRAPHICAL USAGE VIEW ...41
DIAGNOSTIC LOGS ...43
Log File Directory Display ... 43
Number of Days to Keep Combo Box ... 44
Logging Enabled Check Box ... 44
Max. Files Size (kB) Combo Box ... 44
MENU QUICK REFERENCE GUIDE ...47
System Menu Bar ...47
File Menu ... 47
Edit Menu ... 48
View Menu ... 48
Window Menu ... 49
Side Bar Navigation ...50
Trunk Master ... 50
Alarms ... 51
Graphical Usage ... 51
Help Menu ... 52
TROUBLESHOOTING ...53
General Connection Troubleshooting ...53
Network Troubleshooting ...54
Serial Troubleshooting ...54
Single-Ended Serial Signaling Considerations (RS-232, RS-423, PS/2, I2C, SCSI, etc) ... 54
Balanced Serial Signaling Considerations
(RS-485, RS-422, Serial ATA, PCI Express, 10 Gigabit Ethernet) ... 54
Connection to the RT-2M Audio Analyzer ...55
All Trunks in Maintenance Mode ...55
Local Area Network ... 66
Wide Area Network ... 67
Access the WAN ... 67
Network Address Translation ... 67
Ports ... 68
IP Addresses ...69
Find Your Computer’s IP Address ... 69
Ping a Computer ... 69
Possible Pitfall with Routers, Gateways, and Switches ... 70
RVON Configuration ...70
TRUNKING 101 ... 71
A User’s Guide to Trunking ...71
Very large systems, split operation and trunking ... 71
Matrix sizes ... 71
Advantages of multiple small matrices ... 72
Advantages of a single large matrix ... 72
Hybrid Designs ... 72
TERMINOLOGY ... 75
General Terminology ...75
Network Terminology ...76
Introduction
IMPORTANT: • Verify the appropriate physical connections between the hardware has been made, as described in the Trunk Master Installation Manual.
• Verify Trunk Edit was properly used to configure the trunk connections for the trunk master.
NOTE: It is important that AZedit be used to configure each ADAM matrix in the trunking system, in addition to configuring the trunk master using Trunk Edit.
Trunk Supervisor is a Microsoft Windows compatible application allowing users of a trunking system to continuously monitor and test the trunking system in real time. This software connects to the Trunk Master via an Ethernet or RS-232 serial connection. With the addition of a RT-2M or AutoTIMs interface, this software also provides the necessary configuration for testing of trunk lines. These interfaces require an additional RS-232 serial connection.
IMPORTANT: An audio analyzer is required if you are doing automated trunk testing. It is an option that allows Trunk Supervisor to test trunk lines.
Trunking
Trunking is a way of connecting multiple ADAM frames together. With intelligent trunking, fewer lines are allocated through a process called dynamic allocation. Dynamic allocation allows the system designer to build fewer lines of communication which can carry conversations from one system to the other, as it is unlikely all users on each system communicate back and forth constantly. For example, a matrix composed of 100 users may be able to use 16 lines to connect to another system of 100 users. This design allows for 16 individual conversation at any given point in time, through the use of dynamic allocation. As the first person initiates communication between systems, they are assigned to Trunk 1. The second person to initiate a communication is assigned to Trunk 2. The third person is assigned to Trunk 3, and so on. If the first person finishes talking, the system then releases Trunk 1 which allows it to be used by the next person to initiate communication. This process is considered intelligent trunking by automatically initiating a dynamic change in the system to allow for efficient utilization of fewer lines.
Installation
Application Requirements
Minimum Software Requirements
•
Windows XP1•
Microsoft Data Access Objects v3.6•
Microsoft Jet Engine v4.0 or higherMinimum Hardware Requirements
•
Pentium 233-MHz processor or faster (300MHz is recommended)•
At least 64MB of RAM (128MB is recommended)•
At least 1.5GB of available space on the hard disk•
CD-ROM or DVD-ROM drive•
Keyboard and mouse•
Video adapter and monitor with Super VGA (800 x 600) or higher resolution•
Sound card1. Trunk Supervisor is a 32-bit Windows application designed to run under Windows XP/Vista/7. It may run under Windows 8, but has not yet been tested in this configuration.
Installation
To install Trunk Supervisor, do the following:
1. From the Trunk Supervisor folder, double-click the SETUP.EXE.
The Installation Wizard begins.
2. Follow the installation wizard, taking all the defaults.
NOTE: The default installation directory is: C:\TELEX|TKSUPV\V190. This can be changed, if desired. During the installation, the following are created:
•
installation directory (default or user-defined)•
BIN directory - created under the installation directory. The BIN directory houses the TKSUPV.EXE application and the release notes.•
TKSUPV.EXE shortcut on the Program submenu of the Start menu of the taskbar. The shortcut is labelled Trunk Supervisor V1.9.0NOTE: The location of this shortcut, and its name, cannot be modified during the installation process. You can move, rename, or delete this shortcut afterwards. If you move or rename it, it will not be removed as part of the uninstall process.
Configuration
Configuration Window
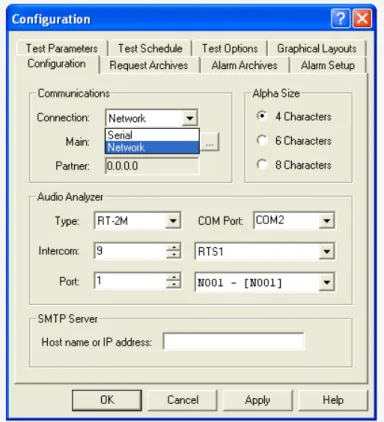
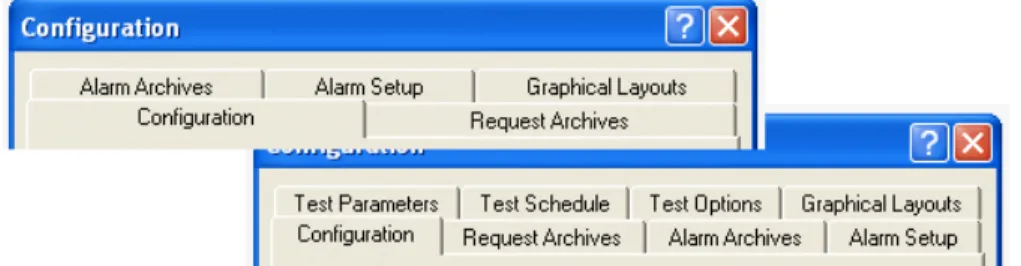
The Configuration window, shown in Figure 1, houses the majority of configuration options for the Trunk Supervisor. The tabs in the configuration window are dynamic, meaning if an Audio Analyzer is selected on the Configuration page, three (3) additional tabs appear in the Configuration window (Test Parameters, Test Schedule, and Test Options tabs).
NAVIGATION: To open the Configuration window, select View|Configuration... from the menu bar. OR
Press Ctrl+V, then Alt+Enter on the computer keyboard.
Configuration Tab
After the Trunk Supervisor software is finished installing, the Configuration page, shown in Figure 1, is normally the first window used to establish network connections to the primary and optional secondary Trunkmaster, the audio analyzer, SMTP Server, as well as the number of alphas displayed.
Trunk Master systems can be set up as either standalone or redundant. If the system is constructed as a standalone, then an IP Partner is not shown and can be ignored. If the system is constructed with a redundant trunk master, then an IP Address appears in the IP Partner field.
Port Forwarding
It is possible to have a trunk master on a private network accessible via the Internet. If port-forwarding is properly
programmed into the routers, a connection can be established between two (2) private networks through the routing systems. For example, Trunk Supervisor on one private network can connect over the internet to a second private network where a trunk master resides. The routers on the trunk master’s private network must be programmed to port-forward UDP ports 27410 and 27415 to the trunk master’s private IP Address. If an intercom is to be connected that resides on a private network other than that of the trunk master, then UDP port 27415 must also port-forward to the intercom private IP Address on the router where the intercom resides.
Communications
Network Connection
To establish network connections, do the following: 1. From the View menu, select Configuration....
The Configuration window appears.
2. From the Connection drop down menu, select Network.
3. In the Main field, enter the IP Address of the primary Trunk Master. OR
Click the browse button to open the Available Trunk Masters window and select a trunk master from a list of available devices.
If the trunking system has a redundant trunk master, the Partner IP Address field populates; if there is no redundant trunk master, then the Partner IP Address field is ignored.
IMPORTANT: This tool only finds trunk masters residing on the same unfiltered subnet and can take a few minutes to do so on large subnets, such as a Class A or B. If the network search utility locates a Trunk Master, single click on the unit you want. Do not click the OK button until you have verified the chosen trunk master is the intended machine.
Serial Connection
To establish serial connections, do the following: 1. From the View menu, select Configuration....
The Configuration window appears.
2. From the Connection drop down menu, select Serial.
The COM Port drop down menu appears.
3. From the COM port drop down menu, select the COM port to be used for communication with the Trunk Master. OR
In the COM port drop down menu field, enter the COM port name to be used for communication with the Trunk Master.
Alpha Size Group Box
The size of the alphas displayed throughout the Trunk Supervisor application are configured on the Configuration tab as well. To set the alpha size, do the following:
In the Alpha Size group box, select the 4 Characters radio button. OR
In the Alpha Size group box, select the 6 Characters radio button. OR
Audio Analyzer Group Box
(Optional) An Audio Analyzer is a device that tests and measures audio performance over audio lines in electronic devices. There are currently two (2) audio analyzers compatible with RTS systems; Auto-TIMS and the RT-2M device. Check the hardware to verify which model is connected and select the appropriate model.
IMPORTANT: Currently, the only method of communication with an audio analyzer is via RS-232 serial connection directly to the computer running Trunk Supervisor. Hardware data flow control (CTS & RTS) is used on the audio analyzer serial cable, it is important to verify you are using a serial cable that has continuity on all pins.
The audio analyzer requires an audio connection to a port of one (1) of the matrix systems that is part of the trunk network so that it rout audio down the various trunking paths and back to the audio analyzer in order to test the lines.
To configure an audio analyzer on your system, do the following:
1. From the Type drop down box, select the type of audio analyzer being used.
2. From the COM Port drop down menu, select the COM port to be used for audio analysis.
3. Using the arrow buttons in the Intercom spin box, select the Intercom number of the specified matrix. OR
NOTE:The Intercom number is directly related to the TrunkEdit Intercom Setup listing of matrices.
4. Using the arrow buttons in the Port spin box, select the an intercom port. OR
From the Intercom drop down menu (next to the spin box), select a connected intercom port. 5. Click Apply.
The modifications are applied to the application.
SMTP Server (Optional)
The SMTP Server Group Box is used to configure SMTP for the Trunk Supervisor application. For more information, see “Advanced Trunk Supervisor Settings” on page 57.
Host Name or IP Address Field
The Host Name or IP Address field is used to enter the IP Address or Host name (if a DNS server is available) of an approved email server on the network.
Graphical Layouts Tab
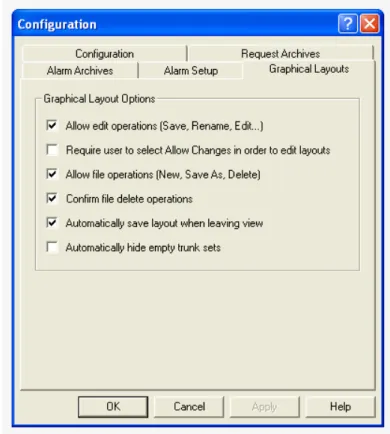
The Graphical Layouts Tab, shown in Figure 2, is used to configure the Graphical Usage View.
Graphical Layout Options Group Box
Allow Edit Operations (Save, Rename, Edit...) Check Box
The Allow Edit Operations (Save, Rename, Edit...) check box allows the user to save various layout views in the Graphical Usage view. Users can save or rename views from the File menu. They can also delete views using the File menu, as well.
Require User to Select Allow Changes in Order to Edit Layouts Check Box
The Require User to Select Allow Changes in Order to Edit Layouts check box prevents users from making unintentional changes by requiring them to select Allow Changes before being able to edit the graphical views.
Allow File Operations (New, Save As, Delete) Check Box
The Allow File Operations (New, Save As, Delete) check box allows the user to select New or Save As in the File menu, creating icons with either a user-generated name or a default name, such as view1, view2, etc. Views can also be deleted by selecting the view to be deleted, then from the File menu, select Delete.
Confirm File Delete Operations Check Box
The Confirm File Delete Operations check box enables a confirmation message to appear any time a view is deleted.
IMPORTANT: This operation cannot be undone
Automatically Save Layout When Leaving View Check Box
The Automatically Save Layout When Leaving View check box ensures the current layout does not snap back to a default configuration when the user selects another view.
Automatically Hide Empty Trunk Sets Check Box
The Automatically Hide Empty Trunk Sets check box hides trunks in the graphical view that are not fully configured. Clear this check box if you want to see all trunks, fully or partially configured.
Alarm Setup Tab
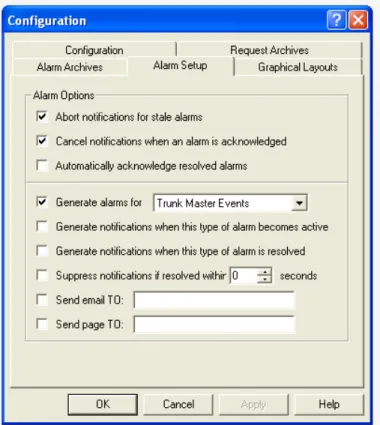
The Alarm Setup tab, shown in Figure 3, determines what conditions generate an alarm and how those alarms are handled. This is also the area where email addresses and pager addresses are entered for notification purposes.
Abort Notifications for Stale Alarms Check Box
The About Notifications for Stale Alarms check box allows alarm notifications that have been displayed for several minutes to automatically disappear.
Cancel Notifications when an Alarm is Acknowledged Check Box
The Cancel Notification when an Alarm is Acknowledged check box prevents notifications from being sent if the alarm is acknowledged.
Automatically Acknowledge Resolved Alarms Check Box
The Automatically Acknowledge Resolved Alarms check box allows resolved alarms to be recognized automatically.
Generate Alarms For... Check Box and Drop Down Menu
The Generate Alarms For... check box and drop down menu is used to choose specific alarm behavior. The check box must be selected to use this option.
Available options for this field are: Trunk Master Events, Intercom Events, or Trunk Request Busy Events.
Generate Notifications When This Type of Alarm is Resolved Check Box
The Generate Notifications When This Type of Alarm is Resolved check box activates notifications when an alarm is triggered for the chosen type of alarm in the Generate alarms for...drop down menu.
Suppress Notifications if Resolved Within.... Seconds Check Box
The Suppress Notifications if Resolved Within... Seconds check box allows the user to set the amount of time, in seconds, to wait before sending notifications. This is helpful in the case and operator is typically observing the system but wants to be notified of any issues if they are away from the computer.
Sent Email TO Field
The Sent Email TO field is used to enter an email address(es) to which notifications are sent when events occur. This feature is only enabled when if the SMTP server information is entered in the Configuration tab.
Send Page TO Field
The Send Page TO field is used to enter an pager address(es) to which notifications are sent when events occur. This feature is only enabled when if the SMTP server information is entered in the Configuration tab. This option properly formats the message for pagers.
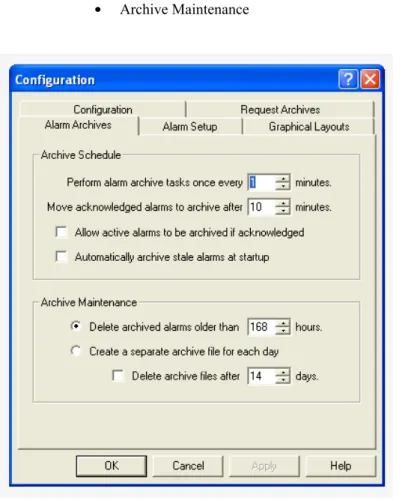
Alarm Archives Tab
The Alarm Archives tab, shown in Figure 4, is used to set up how the alarm archives perform. It is split into two (2) parts:
•
Archive Schedule•
Archive MaintenanceArchive Schedule Group Box
The Archive Schedule parameters set on this tab determine how and when the information is archived.
Perform Alarm Archive Tasks Once Every... Minutes Spin Box
The Perform Alarm Archive Tasks Once Every... Minutes spin box is used to set the time interval, in minutes, between archiving.
Move Acknowledged Alarms To Archive After... Minutes Spin Box
The Move Acknowledged Alarms To Archive After...Minutes spin box is used to set the time, in minutes, the system waits before archiving the alarms.
Allow Active Alarms To Be Archived if Acknowledged Check Box
The Allow Active Alarms To Be Archived if Acknowledged check box enables the system to mark an active alarm for archival once it is acknowledged.
Automatically Archive Stale Alarms At Startup Check Box
The Automatically Archive Stale Alarms At Startup check box enables the system to archive alarms that have been active for a long period of time.
Archive Maintenance Group Box
The Archive Maintenance parameters determine how archive records are stored and when they are deleted.
Delete Archived Alarms Older Than... Hours Radio Button and Spin Box
The Delete Archived Alarms Older Than... Hours radio button and spin box allows the user to set the time, in hours, the system waits before purging archived alarms.
Create a Separate Archive File for Each Day Radio Button
The Create a Separate Archive File for Each Day radio button enables the system to create daily archive files for later review.
Delete Archive Files After... Days Check Box and Spin Box
The Delete Archive Files After... Days check box and spin box gives the user the option of deleting daily archive files after a number of days when they may no longer be relevant.
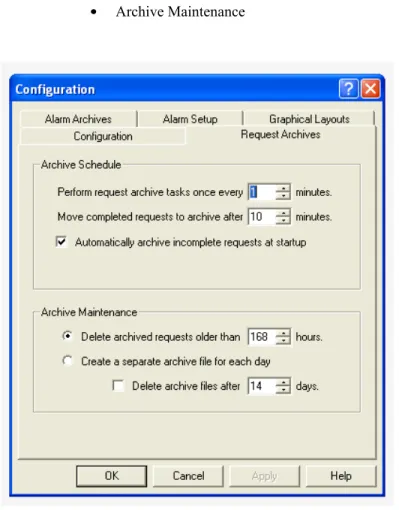
Request Archives Tab
The Request Archives tab, shown in Figure 5, is used set up how the request archives performs. Trunk Supervisor tracks the keys a keypanel user presses to speak to other users over a trunk, which is referred to as a request. These requests are then archived in a file known as a request archive file. This tab is split into two (2) sections:
•
Archive Schedule•
Archive MaintenanceArchive Schedule Group Box
The Archive Schedule group box is used to determine how and when request information os archived.
Perform Request Archive Tasks Once Every... Minutes Spin Box
The Perform Request Archive Tasks Once Every...Minutes spin box allows the user to set the interval, in minutes, between archiving the trunking requests.
Move Completed Requests to Archive After... Minutes Spin Box
The Move Completed Requests to Archive After...Minutes spin box is used to set the time, in minutes, the system waits before archiving the requests.
Automatically Archive Incomplete Requests At Startup Check Box
The Automatically Archive Incomplete Requests At Startup check box enables the system to archive requests made but not completed when the application opens.
Archive Maintenance Group Box
The Archive Maintenance group box is used to determine how archive records are stored and when they are deleted.
Delete Archived Requests Older Than...Hours Radio Button and Spin Box
The Delete Archived Requests Older Than...Hours radio button and spin box allows the user to set the time the system waits before purging archived requests.
Create a Separate Archive File For Each Day Radio Button
The Create a Separate Archive File For Each Day radio button enables the system to save daily archive files for later review.
Delete Archive Files After... Days Check Box and Spin Box
The Delete Archive Files After... Days check box and spin box gives the user the option of deleting daily archive files after a number of days when they may no longer be relevant.
Audio Analyzer Test Options
The Test Parameters and Test Schedule Tabs, shown in Figure 6, only appear in the Configuration window when an Audio Analyzer is installed in the system (see “Audio Analyzer Group Box” on page 12). The Audio Analyzer passes audio over the trunks and compares the audio received to determine the amount of audio loss compared to the amount of audio transmitted.
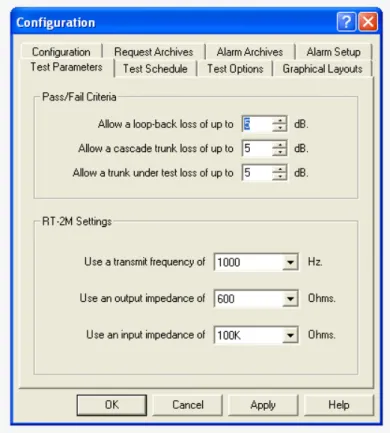
Test Parameters Tab
The Test Parameters tab, shown in Figure 7, is used to set up the RT-2M or AutoTIMs unit for testing trunk lines. The amount of loss allowed, test tone frequency, test tone levels, test sensitivity, and termination parameters are all set from this tab.
Pass/Fail Criteria Group Box
Allow a Loop-back Loss of Up To... dB Spin Box
The Allow a Loop-back Loss of Up To...dB spin box allows the user to manage the amount of acceptable audio loss before a trunk is considered to fail by the trunking system.
The default value for this field is 5dB.
Allow a Cascade Trunk Loss of Up To... dB Spin Box
The Allow a Cascade Trunk Loss of Up To...dB spin box allows the user to set a different amount of audio loss when the trunk makes multiple hops across more than one (1) trunked matrix system.
The default value for this field is 5dB.
Allow a Trunk Under Test Loss of Up To... dB Spin Box
The Allow a Trunk Under Test Loss of Up To...dB spin box allows the user to set the amount of acceptable audio loss of a trunk under test.
The default value for this field is 5dB. FIGURE 7. Test Parameters Tab
RT-2M Settings Group Box
The RT-2M Settings group box only appears when Trunk Supervisor detects an RT-2M unit.
Use a Transmit Frequency of... Hz Drop Down Menu
The Use a Transmit Frequency of... Hz drop down menu is used to determine the audio frequency used by the audio analyzer to test the trunks.
The default value for this field is 1000Hz.
Use an Output Impedance of... Ohms Drop Down Menu
The Use Output Impedance of... Ohms drop down menu is used to change the output impedance of the audio analyzer. The default value for this field is 600 Ohms.
Use an Input Impedance of... Ohms Drop Down Menu
The Use an Input Impedance of... Ohms drop down menu is used to change the input impedance of the audio analyzer. The default value for this field is 100k Ohms.
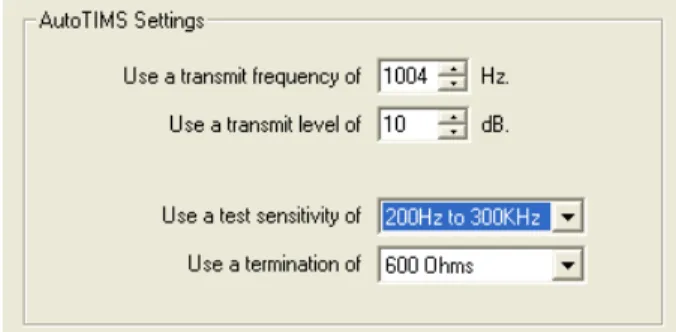
AutoTIMs Settings Group Box
The AutoTIMS Settings group box only appears when Trunk Supervisor detects an AutoTIMS unit.
Use a Transmit Frequency Of... Hz Drop Down Menu
The Use a Transmit Frequency Of... Hz drop down menu is used to determine the audio frequency used by the audio analyzer to test the trunks.
The default value for this field is 1004Hz.
Use a Transmit Level Of... dB Drop Down Menu
The Use a Transmit Level Of...dB drop down menu is used to determine the audio output level used by the audio analyzer to test the trunks.
The default value for this field is 10dB. FIGURE 8. AutoTIMS Settings
Use a Test Sensitivity of... Drop Down Menu
The Use a Test Sensitivity of... drop down menu is used to choose the level of sensitivity of the audio analyzer. The recommended sensitivity is 40Hz to 20Hz because this is the human vocal range.
The available options for this field are: 200Hz to 300kHz and 40Hz to 20kHz.
Use a Termination of... Drop Down Menu
The Use a Termination of... drop down menu is used to choose the different termination values for the audio analyzer. The default value for this field is 600 Ohms.
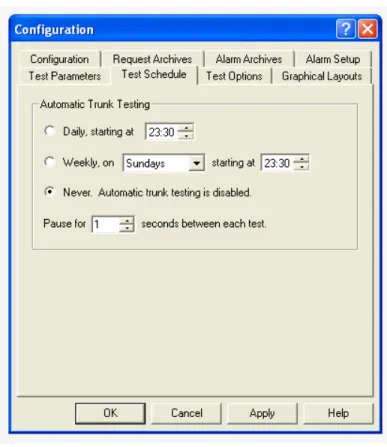
Test Schedule Tab
The Test Schedule tab, shown in Figure 9, is used to determine when trunk testing by the RT-2M or AutoTIMS unit occurs. Testing can be disable by selecting the Never option. It takes approximately 10 to 15 seconds to test a trunk line.
Automatic Trunk Testing Group Box
Daily, Starting At... Radio Button and Spin Box
The Daily, Starting At... radio button and spin box allows the user to schedule a daily test starting at a given hour of the day. The Trunk Supervisor’s computer clock is used to determine the trigger time.
This clock displays military time.
Weekly, On... Starting At... Radio Button, Drop Down Menu, and Spin Box
The Weekly, On...Starting At... radio button, drop down menu, and spin box allows the user to schedule a weekly test starting at a given hour of the day. The Trunk Supervisor’s computer clock is used to determine the trigger time.
This clock displays military time.
Never. Automatic Trunk Testing is Disabled Radio Button
The Never. Automatic Trunk Testing is Disabled radio button allows the user to disable automatic testing.
Pause For... Seconds Between Each Test Spin Box
The Pause For... Seconds Between Each Test spin box allows the user to set the time, in seconds, between each automatic trunk test.
Status Bar
Status Bar
The Status Bar is used to display a quick status on the primary connection dependencies of Trunk Supervisor. The status bar display is controlled from the View menu on the menu bar.
To display the status bar, do the following:
>
From the View menu, select Status Bar.Understanding the Status Bar
The Status Bar shows the status of three components of the Trunk Supervisor connection, the Trunk Master, the audio analyzer, and the trunk testing status.
NOTE: If the optional audio analyzer is also configured and the settings applied, the red X should change to a green check and the name changes from Audio Analyzer to the appropriate name of the analyzer (RT-2M or AutoTIMS).
Indicators
•
A red X indicates the connection cannot be established or has been broken.•
A green check mark shows the connection has been successfully established and is active.Before connections have been configured have been configured in the configuration window, the status bar should display as follows:
Once the Trunk Master settings have been entered and applied the status on the Trunk Master box should change from a red X to a green check box, displayed as follows:
Trunk Master Navigation Bar
The Trunk Master navigation bar is split into five (5) areas:
•
Intercoms•
All Alphas•
All Requests•
All Trunks•
Trunk ConflictsIntercoms View
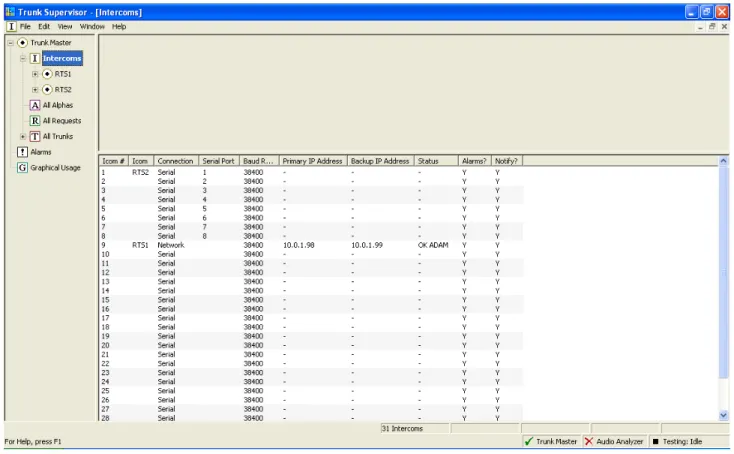
The Intercoms view allows you to view specific information regarding each intercom. Click on the main Intercom icon to view the following information:
FIGURE 10. Intercoms View
Column Description
Icom # The Icom # column displays the number assigned to the intercom to identify it in the system.
Icom The Icom column displays the name assigned to the intercom to identify it in the system.
Serial Port The Serial Port column displays the serial port on the trunk master to which the intercom is connected.
Baud Rate The Baud Rate column displays the baud rate used by the intercom.
Status The Status column displays the status of the intercom and the intercom type.
Alarms? The Alarms? column displays if alarms are enabled on the intercom.
All Alphas View
The All Alphas view displays every alpha function for all trunked intercoms (default). This information can be pared down using the Intercom and All Function filters at the top of the view.
To change from All Intercoms to a specific intercom, do the following:
>
From the For... drop down menu, select the specific intercom you want to display. To change from All functions to a specific intercom, do the following:>
From the Function Filter drop down menu, select the function you want to display. FIGURE 11. All Alphas ViewThe Alpha information is separated into columns and the entries can be sorted by clicking the column heading.
Column Description
Icom # The Icom # column displays the number assigned to the intercom to identify it in the system.
Icom The Icom column displays the name assigned to the intercom to identify it in the system.
FN Type The FN Type column displays the type of function:
•
PP – Point-to-Point•
PL – Party Line•
IF – Intercom Fold Back (IFB•
SL – Special List•
RY – Relay•
IS – Isolate (ISO)Number The Number column displays the number assigned to the function.
All Requests View
The All Request view, shown in Figure X, is used to view all requests in the trunking system, or a subset of requests in the system depending on the filter choices. A request is an individual conversation such as Point-to-Point, IB, PL, etc... For example, A person talking to three (3) people would generate three (3) requests.
The information is displayed in a table format and be sorted via the filters mentioned above, as well as, the column headings. FIGURE 12. All Requests View
Column Description
ID The ID column displays the number assigned to the request.
State The State column displays the state of the request. There are six (6) states:
•
Allocated – the trunk is allocated, but not be used (key is off).•
Queued – there is a request, but there has not been an allocation because either the destination is busy or it is a wait-to-talk channel.•
Active – the trunk is allocated and in use.•
Finished – the request has been completed and the allocation has cleared.•
Incomplete – the current status is old from a reset.Icom 1 The Icom 1 column displays the name of the intercom at one end of the trunk.
Alpha The Alpha column displays the alpha assigned to the intercom port.
Asgn The Asgn column displays the genera assignment to the intercom function (for example, N001).
T/L/I The T/L/I column displays the current status of the key.
•
Talk•
Listen•
InactiveIcom 2 The Icom 2 column displays the name of the intercom at the other end of the trunk.
Alpha The Alpha column displays the alpha assigned to the port at the other end of the trunk.
Asgn The Asgn column displays the genera assignment to the intercom function (for example, N002).
T/L/I The T/L/I column displays the current status of the key.
•
Talk•
Listen•
InactiveT Req The T Req column displays the time the request was made.
T Act The T Act column displays the time the request was activated.
T Fin The T Fin column displays the time the request was finished.
Trunks The Trunks column displays the trunk allocated for the request.
All Trunks View
The All Trunks view, shown in Figure X, is used to view the definitions and statuses of all trunks in the system. By using the options and filters at the top of the window, the user can filter the data to see only trunks between two (2 specified intercoms and/or specific trunk information.
As with all the views, the information is arranged in a table format and the data can be sorted by clicking on the column headings.
FIGURE 13. All Trunks View
Column Description
Trunk The Trunk column displays the number assigned to the trunk.
State The State column displays the state of the trunk. There are six (6) states:
•
Pass – passed test by AutoTIMS or RT-2M.•
Fail – failed test by AutoTIMS or RT-2M.•
Error – an undefined error on the AutoTIMS or RT-2M.•
Pending – queued for testing by AutoTIMS or RT-2M.•
Testing – currently being tested by AutoTIMS or RT-2M.•
Skipped – forced to skip (i.e., maintenance mode or in-use).Icom 1 The Icom 1 column displays the name of the first intercom in the link.
Alpha The Alpha column displays the alpha assigned to port on the first intercom.
Port The Port column displays the generic reference to the port on the first intercom.
Trunk Conflicts View
The Trunk Conflicts view is used to display a list of trunks whose definitions conflict with one (1) or more other trunk definitions because they share the same intercom and port number on at least one (1) end.
The information is displayed in a table format and can be sorted by clicking on the column headings.
Alpha The Alpha column displays the alpha assigned to port on the second intercom.
Port The Port column displays the generic reference to the port on the second intercom.
Test Status The Test Status column displays the pass or fail status of the last test.
Test Time The Test Time column displays the date and time of the last test.
Test Information The Test Information column displays measurements and parameters used in the last test including if the test was cascaded through another intercom system.
Cascadable? The Cascadable? column displays if the trunk can be cascaded.
Fixed? The Fixed? column displays if the trunk is fixed between points.
Alpha 1 The Alpha 1 column displays the name of the alpha currently using the port at the first end of the trunk.
Asgn The Asgn column displays the generic name of the assignment currently using the trunk at the first intercom end.
Alpha 2 The Alpha 2 column displays the name of the alpha currently using the port at the second end of the trunk.
Asgn The Asgn column displays the generic name of the assignment currently using the trunk at the second intercom end.
Auto Test? The Auto Test? column displays if automatic testing by AutoTIMS or RT-2M is allowed on this trunk.
Alarms? The Alarms? column displays if alarms are enabled for failure on this trunk.
Notify? The Notify? column displays if a notification is sent on failure of this trunk.
Column Description
Trunk # The Trunk # column displays the number of the trunk definition.
Icom 1 The Icom 1 column displays the name of the intercom system at the first end of the trunk.
Alpha The Alpha column displays the name of the intercom port at the first end of the trunk.
Port The Port column displays the name of the intercom port at the first end of the trunk.
Icom 2 The Icom 2 column displays the name of the intercom system at the other end of the trunk.
Alpha The Alpha column displays the name of the intercom port at the other end of the trunk.
Port The Port column displays the name of the intercom port at the other end of the trunk.
Conflicts with Trunk # The Conflicts with Trunk # column displays the number of the conflicting trunk definition.
Icom 1 The Icom 1 column displays the name of the intercom system at the first end of the trunk.
Alpha The Alpha column displays the name of the intercom port at the first end of the trunk.
Port The Port column displays the name of the intercom port at the first end of the trunk.
Icom 2 The Icom 2 column displays the name of the intercom system at the end of the trunk.
Alpha The Alpha column displays the name of the intercom port at the other end of the trunk.
Port The Port column displays the name of the intercom port at the other end of the trunk.
Alarms
Alarms View
The Alarms view shows alarms in the system. The default is to show all alarms, but the view may be reduced by using the check box/menu selection filters at the top of the window.
Show Trunk Master Alarms Check Box
The Show Trunk Master Alarms check box enables Trunk Supervisor to monitor and display Trunk Master Alarms.
Show Intercom Communication Alarms Check Box
The Show Intercom Communication Alarms check box enables Trunk Supervisor to display alarms generated when a connection to an intercom is established or broken.
For... Drop Down Menu
The For... drop down menu is used to select either all intercoms in the trunk system or a specific intercom for which alarms are displayed.
Show RT-2M Alarms or AutoTIMS Alarms Check Box (only when Audio Analyzer is configured)
The Show RT-2M Alarms or AutoTIMS Alarms check box is used to enable alarms for either the RT-2M or AutoTIMS to be displayed in the Alarm view.
Show Acknowledged Alarms Check Box
The Show Acknowledged Alarms check box is used to display alarms that have been seen by the user. Once a user have viewed the alarm, the Ack? column shows a Y. Clear this check box to suppress these alarms from displaying.
Show Request Busy Alarms Check Box
The Show Request Busy Alarms check box is used to display those alarms generated when a user requests a trunk line that is busy. Clear this check box to suppress these alarms from displaying.
Show Active Alarms Check Box
The Show Active Alarms check box is used to display active alarms currently in process. For example, if a configured intercom is not responding, then such an alarm is considered active until it is removed from the intercom list or reconnected. Clear this check box to suppress these alarms from displaying.
Show Resolved Alarms Check Box
The Show Resolved Alarms check box is used to display alarms that were active but are now resolved. For example, an intercom that lost connection and was restored. Clear this check box to suppress these alarms from displaying.
Show Stale Alarms Check Box
The Show Stale Alarms check box is used to display alarms that have not been resolved but are shutdown. Clear t his check box to suppress these alarms from displaying.
Show Unresolved Alarms Check Box
The Show Unresolved Alarms check box is used to display all unresolved alarms. Unresolved alarms are those that have not been closed. Clear this check box to suppress these alarms from displaying.
Info Bar 1 (page statistics at bottom of the view)
Alarms display field – displays the total number of alarms listed.
Active display field – displays the total number of active alarms.
Resolved display field – displays the total number of resolved alarms.
Stale display field – displays the total number of stale alarms.
Alarms Information View
The Alarms Information view displays alarm information for each alarm and is arranged in a table format and can be sorted by clicking on the table headings.
Column Description
ID The ID column displays the number assigned to the alarm
State The State column displays the current state of the alarm.
Available options are:
•
Active – lost contact•
Stale – Unresolved, but shutdown•
Resolved – Regained contactAck? The Ack? column displays the either a Y for Yes or an N for No.
>Right click on the
column entry to access a popup menu to select Y or N.Notification The Notification column display the status of the notification of the alarm. Available options are:
•
None – no notification for the alarm•
Pending – notification is pending•
Canceled – notification is canceled•
Sent – notification has been sent•
Suppressed – alarm occurred, but cleared before notification was sent•
Aborted – notification was aborted•
Error – There was an error in sending notificationDevice Type The Device Type column displays the type of device. Available options are:
•
Intercom•
Trunk•
AutoTIMS or RT-2MDevice Info The Device Info column displays the intercom name or trunk ID.
Alarm Type The Alarm Type column displays the type of alarm. Usually a test failure or loss of communications.
Description The Description column displays information on alarms, such as “lost contact with intercom” or “loss unmeasurable”.
T Active The T Active column displays the date and time an alarm became active.
T Resolved The T Resolved column displays the date and time an alarm was resolved.
T Ack The T Ack column displays the date and time the alarm was acknowledged.
Graphical Usage View
The Graphical Usage view allows the user to create custom views of the system. Intercoms are represented by circles in the view.
•
A single circle indicates an intercom communicating with the Trunk Master at 38.4K baud.•
A circle with a dot indicates an intercom communicating at 9600 baud.NOTE: Generally, intercoms communicating at 38.4k baud are local units, while those communicating at 9600 baud are remotely located with respect to the Trunk Master.
The color of the circle represents whether an intercom is communicating or not.If the circle is blue, the intercom is talking. If the circle is purple, the intercom is silent.
The line thickness showing the connections between the intercoms indicates the number of trunk between them. One (1) pixel of width indication one (1) trunk, two (2) pixels indicate two (2) trunks, and so on. A dashed line indicates there are no trunks between the two (2) intercoms. The color of the lines indicate the status of the trunk:
Contextual Menu
When you right click the mouse in certain areas of the application window a pop-up menu presenting additional menus specific to the window appears.
Line Color Status Indicated
Red Trunk in use
Yellow Trunk is allocated
Green Trunk is idle
Menu Item Description
Select an intercom to show... This allows you to choose an intercom to show Hide intercom caption This option hides the intercom caption below the circle
representing the Intercom.
Show all hidden intercoms This option shows all available intercom in the view.
Show trunk captions This option shows labels for each intercom such as the
name of the intercom.
Hide trunk captions This option hides the intercom caption so only the
Diagnostic Logs
The Diagnostic Logging window, shown in Figure 17, is used to enable logging, adjusting the number of days to keep log files, setting the maximum size of log files, and setting the levels of various items to log.
Log File Directory Display
The Log File Directory display shows the directory to which the daily log files are saved. One log file per day is generated in this folder. The location of the logs folder can be found in the Trunk Supervisor parent folder.
IMPORTANT: The location of the log files cannot be changed. FIGURE 17. Diagnostic Logging Window
Number of Days to Keep Combo Box
The Number of Days to Keep combo box is used to configure the number of days to keep the log files before the system removes them.
Logging Enabled Check Box
The Logging Enabled check box is used to enable logging. If this box is not selected, the log files are not saved.
Max. Files Size (kB) Combo Box
The Max File Size (kB) combo box is used to set the upper limit to the file size of a log. This helps when logging levels are set too high or an error occurs and excessive log output is produced, it won’t use up the space on the hard drive, which could cripple the computer Trunk Supervisor is active on. This option can be set to a generous level, but not exceptionally high.
TIP: This parameter if used in conjunction with the Number of Days to Keep parameter provides an excellent method of managing the space log files use on the hard drive.
Logging Levels Group Box
The Logging Levels group box is used to configure the levels of the types of events being logged.
System Column
The System column displays the different types of items tracked by the log file:
Notify Agent – Notification events. Default is 0 (catastrophic)
TMaster – Trunk Master events. Default is 0 (catastrophic)
TrunkTest – Trunk Testing events. Default is 1 (errors)
Dbase – Database events. Default is 1 (errors)
Log Level Column
The Log Level column is used to set the level to which a log is written to the log file.
IMPORTANT: Unless instructed by an RTS engineer, it is not recommended to set logging levels higher than 3. It is rare to use anything but the defaults.
The available log levels are available:
0 Catastrophic – A condition has happened that most likely causes the application to completely shut down.
1 Error – A condition preventing certain parts of the application from operating, but may not result in complete shut down of the application.
2 Warning – A condition which the application considers irregular, but is not critical.
3 Info – These log entries are purely informational. they give the user insight into what the application is working on at any given time.
4 Protocol – These log entries are more detailed than Info level entries and are primarily used for debugging purposes.
5 Debug – These log entries are only used by programmers for debugging the application. Only use this level of debugging is instructed by an RTS engineer.
6 - 10 Unused – Do not set logging levels greater than 5. To change the logging level, do the following:
1. From the System column, select the system event you want to modify the logging level.
2. Using the Adjust Arrows next to the default button, adjust the logginglevel up or down, as desired.
Description Column
The Description column is used to display the description of the System event.
Default Button and Adjust Arrows
The Default button and Adjust arrows are used to set the selected system event to its default value or to increase/decrease the logging levels. To change the system event log level, use the adjust arrows to either increase or decrease the default value.
All to Default Button
The All to Default button is used to set all system events to the default log level values.
Remember these logging levels the next time the application is started Check Box
The Remember these logging levels the next time the application is started check box is used to save the modifications to the logging levels after shut down. This means the application remembers the settings you have made the next time the application is opened.
Menu Quick Reference Guide
System Menu Bar
File Menu
FIGURE 18. File Menu
New Creates a new view in the graphic usage section
Save Saves the graphical usage view. (only active when Graphical Usage section is selected in the side bar)
Save As Creates a duplicate of the graphical usage view currently selected. (only active when Graphical Usage section is selected in the side bar)
Rename Allows the user to rename the selected view. (only active when Graphical Usage section is selected in the side bar)
Delete Deletes the currently selected graphical usage view (only active when Graphical Usage section is selected in the side bar)
Edit Menu
View Menu
FIGURE 19. Edit Menu
Allow Changes When selected, allows changes to be made to the graphical views. When not selected, prevents inadvertent changes from being made to the graphical views. (only active when Graphical Usage section is selected in the side bar)
Undo Changes Allows the user to undo a change made to a view. Changes made prior to a save cannot be undone.
Select All Selects all objects in the view window.
FIGURE 20. View Menu
Status Bar Removes or allows the bar at the bottom of the active window to display the current status of the Trunk Master, Audio Analyzer, or the Trunk Testing Status.
Info Bar 1 Depending on the sidebar selection, the menu bar appearing at the bottom the window display the status of objects within the window, such as number of trunks, number of trunks allocated, number of requests, etc.
Info Bar 2 Provides a second row of quick information for the selected section.
Trunk Master Version...
This menu displays the current Trunk Master software version. This can only be selected when a Trunk Master is connected.
Configuration... This menu item opens the application Configuration window.
Diagnostic Log Settings...
Window Menu
FIGURE 21. Window Menu
New Window This menu item creates a duplicate window of Trunk Supervisor. This means you can create separate windows for each intercom summary. The result of this is only obvious if the window currently being worked in is not maximized.
Close Window This menu item closes the currently opened window.
Cascade This menu item causes all open windows to descend from the top left side of the window to the bottom right side of the window.
Tile Horizontally This menu item divides the open window space between all the window, putting the first window listed at the top left adding windows horizontally until the next row is created.
Tile Vertically This menu item divides the open window space between all the window, putting the first window listed at the top left adding windows vertically until the next column is created.
Arrange Icons This menu item arranges icons within the application.
Window Instance Selection
This portion of the menu lists all the current window instances created by the user. If the you wanted to make a particular window previously viewed active, select it from this list.
Side Bar Navigation
Trunk Master
The Trunk Master menu tree allows the user to see the overall activity in the trunking system. This allows the user to filter information to tailor it to their needs.
Intercoms
The Intercom menu item allows the user to view the Trunk Edit view of the Trunk Master connections to verify all connections are properly set up without having to switch to Trunk Edit.
Intercom Summary
The Intercom Summary displays information specific to a connected intercom. This list grows and shrinks as to what is being defined or modified in Trunk Edit, as an expected or connected intercom system.
All Alphas
The All Alphas item displays all available alpha of all the connected intercom in the trunking network, not only those set aside for trunking.
All Requests
The All Requests item displays all requests made by keypanel users for trunks. When troubleshooting a trunk request, this is a good starting point.
All Trunks
The All Trunks item lists all defined trunks in the trunking system. FIGURE 22. Side Bar Navigation
Alarms
The Alarms item allows the user to filter any alarms sent by the system. This is useful when building a trunking system to identify when certain connections were established or failed.
Graphical Usage
The Graphical Usage item is a representation of the overall trunking system allowing users to get a visual idea of the activity and connectivity of the entire trunking system at a glace. This is especially useful when trying to evaluate the network design for excessive trunk cascading when ca indicate the trunking network is becoming over-worked.
Help Menu
FIGURE 23. Help Menu
Help Topics This menu item opens a help search box used to find particular information from the help file.
Context Help This menu item activates the context sensitive help. This means the cursor into a question mark allowing the user to click on the area of interest and open the relative help file.
Using Help This menu item opens the Help start page. From this page, you can search the help files for information about the application.
Release Notes... This menu item opens the current release notes for Trunk Supervisor. These notes are used to relay information directly to the user about modifications made in each version.
About Trunk Supervisor
The menu item opens an informational window providing basic information about Trunk Supervisor such as the major and minor version of the product.
Troubleshooting
IMPORTANT: When troubleshooting cabling issues, it is important the cable and termination are properly verified BEFORE plugging in the equipment. Varying levels of voltage are used for various standards. For example, RS-232 uses 3 to 15 volts (can be as high as 25 volts in some applications; whereas, RS-485 lines are typically 5volts (up to as much as 12 volts). Connecting a 25-volt RS-232 line into a 5-volt RS-485 device could potentially destroy the internal circuitry of the RS-485 hardware driver. Do not depend on protection circuits and always verify all connections before use.
General Connection Troubleshooting
While differing electrical standards are used in the communications field, many troubleshooting techniques are common to most situations. We suggest using these techniques to troubleshoot situations where a new connection cannot be established or an existing connection has been interrupted.
•
Continuity – It is a common mistake to assume continuity of either the cable or individual wires. There are several ways of testing continuity with purpose-built split-end testers or by applying low voltage across common at the other end using the continuity mode of a multimeter.•
Reversals – It is best to check continuity for each pin/wire to rule out pin reversals. However, not all cables are meant to be pin-to-pin (also known as straight-thru). In the case of RS-232 a null-modem cable purposefully reverse the transmit and receive pins on one end so that two hosts (terminal equipment) can be directly connected together. Similarly, a network crossover cable allows two host devices to be directly connected together as if they were going through a network hub or switch.•
Interference – The greater distance a copper cable runs, the greater its capacitive and inductive ability. While techniques like shielding and balanced signaling provide protections against interference, they cannot eliminate interference altogether.•
Resistance – Electrical cables with sufficient length can interfere with signaling when the reactance of the cable is sufficient to resist the change in flow of electricity essential to communication. Employing professional grade cable purpose-built for the intended use is the best way to safeguard against electrical resistance issues.Network Troubleshooting
If a connection cannot be established to the trunk master from the Trunk Supervisor, do the following:
1. Use a software utility that can pin the trunk master’s IP Address from the computer or same physical Ethernet connection running the Trunk Supervisor. If the Trunk Master does not respond to the network ping, then verify the physical network connections to the Trunk Master are correct.
2. If the physical Ethernet connections are verified, then contact your Network Administrator to verify ports have not been blocked or a firewall has not been enabled along the network route.
3. A crossover cable can also be used to connect a computer directly to the Trunk Master to verify the unit is responding to the network. There may be multiple Ethernet connections on the back of the Trunk Master, all of which may cause the link LED to activate, but only one is used by the Trunk Master software. Typically, the Ethernet the Trunk Master uses is the Ethernet on the card in one of the expansion slots.
Serial Troubleshooting
There are three (3) primary types of serial connections used in the RTS matrix systems – RS-232, RS-485, and USB. It can be difficult to troubleshoot when it does not work since it may not immediately be obvious if it is a hardware failure or software misconfiguration. When the target piece of equipment is suspected to be bad, it is generally advisable to establish the serial adapter in use is working properly. This is done by testing the serial adapter hardware with equipment known to be working properly, which could be another serial adapter. RS-232 can be wired in a loopback configuration where the receive and transmit pins are tied together so anything transmitted form the adapter is returned to the adapter. A terminal emulator can then be used to verify proper operation of the hardware.
Single-Ended Serial Signaling Considerations (RS-232, RS-423, PS/2, I2C, SCSI, etc)
Single-ended signaling standards use a single wire to transmit logic along with a drain to complete the circuit. In the case of RS-232, there is a wire for receive logic and a wire for transmit logic along with other wires for signal control that all rain through a common drain (multiple ground pins are present but are rarely isolated from each other). If problems occur, try the following:
1. Check overall continuity.
2. Make sure the cable being used is appropriate for the given purpose (null modem or not).
3. Make sure the cable length does not exceed the recommended length for the baud rate being used. Many factors influence these numbers including the purity of the metal used and even the temperature of the environment the cable is in.
Use a CAT-5 network cable (max 55pF per meter) standard, the following distances are typical for RS-232:
Balanced Serial Signaling Considerations (RS-485, RS-422, Serial ATA, PCI Express, 10 Gigabit Ethernet)
Data Rate (bps) Distance (Meters) Distance (Feet)
2400 60 196.9 4800 30 98.4 9600 15 49.2 19200 7.6 24.9 38400 3.7 12.1 56000 2.6 8.5
Balanced serial connections depend on sending the signal on two (2) wires. The signal on the first wire is unaltered, on the second wire, the signal’s polarity is inverted. When the signal is recombined, any interference shows up as a difference between the two (2) signals and is rejected.
If problems occur, try the following: 1. Check overall continuity.
2. Make sure not to reverse the pins on either end of the connection. RS-485 and RS-422 are very intolerant to pin reversals.
3. Check overall cable length. RS-485 can typically go as far as 4000 feet at 400–800Mbps over CAT-5 cables.
4. Lack of termination can greatly reduce the distance a differential signal can travel due to reflections and reception of outside electromagnetic interference. Terminate the differential signal wires by cross-connection the two (2) wires with a resistor equal to the characteristic impedance of the cable (for example, 24awg cable typically has an impedance of 120 Ohms).
Connection to the RT-2M Audio Analyzer
The serial cable between the Trunk Supervisor computer and the RT-2M must have a null-modem cable with all pins connected. The serial connection between the two (2) systems uses hardware flow control so the CTS and RTS pins are used.
All Trunks in Maintenance Mode
If an audio analyzer is selected in the View|Configuration|Configuration Tab, the Test Options tab appears with a section titled
After testing a trunk..., allowing the Leave failed trunks in maintenance mode option to be selected. If this option is selected, then trunks that fail are placed into maintenance mode and not be automatically tested again so it can be returned to service. Unless there is a specific reason to activate this option, it is best to leave it inactive.
Advanced Trunk Supervisor Settings
The most common configuration options for Trunk Supervisor are available via the Configuration window (see X). However, there are a number of other customization options only available through editing the registry directly.
To open the registry, do the following: 1. From the Start menu, select Run.... 2. At the Run command, type regedit.
The registry editor window appears.
3. In the left navigation, select HKEY_CURRENT_USER\Software\Telex\tksupv.
A list of advanced customization options appear. (defaults shown in brackets).
NOTE: The alternate line shading color offset is now a customizable registry setting.
Preferences\AutoUpdateSortOrder (0)
This option controls whether the sort order on list views is automatically updated with the list data is changed. When enabled, this can make the display visually distracting if the list data is changed frequently.
Allowable values for this setting are:
0 – The list is not automatically re-sorted when a data update occurs. 1 – The list is automatically re-sorted when a data update occurs.
Preferences\AlternateLineShading (2)
This option controls the shading of alternate lines in the list views. Allowable values for this setting are:
0 – No line shading 1 – Shade every other line 2 – Shade every other pair of lines 4 – Shade every other set of 4 lines
Preferences\AutoSynchronizeTreeView (1)
This option controls whether the navigation tree tries to remain synchronized to what is being displayed in the list view. For instance, if the user changes a filter settings, or navigates by using a context menu of the list view, the navigation tree updates itself and expands to show the current navigation node.
Allowable values for this setting are:
0 – Disable auto synchronization of the navigation 1 – Enable auto synchronization of the navigation
Preferences\CompactDBThreshold (0x00a00000)
This option sets the threshold (default 10MB) for determining if the database should be compacted at start up.
Preferences\CompactDBTimeout (20)
This option sets the timeout before automatically compacting the database at start up if no user input is received.
Preferences\CompactDB (1)
This option sets whether the auto-response is to compact (1) or not compact (0).
Preferences\JetEngineVersion (4)
This option lets you force which Jet Engine is used to create the main database (and compatible archive databases). Allowable values for this setting are:
3 – Use Jet V3.x 4 – Use Jet V4.x
Preferences\ShowNamelessIntercoms (0)
This option controls whether undefined intercoms appear in the navigation tree an in combo boxes showing lists of intercoms.
Allowable values for this setting are: 0 – Don’t show undefined intercoms 1 – Show undefined intercoms