User Perceptions of Dialogic Public Relations Tactics
via the Internet
Sheila M. McAllister-Spooner1
A usability study of New Jersey’s 19 community college Web sites was conducted to determine users’ perceptions of dialogic relationship-building
communication principles in their design and everyday usage. The results of the study —which encompassed a two-stage usability test with a sample of 119 undergraduate students—indicate that the full sample of New Jersey’s community colleges are not capitalizing on the interactive potential offered by the Internet. Despite negative user experiences, the data suggests that users did not have strong feelings for or against the sites. Of Kent and Taylor’s five dialogic Internet principals, users only had negative reactions to the lack of Dialogic Feedback Loop features.
Introduction
Because the World Wide Web has been shown to facilitate more balanced organization–public relationships, public relations practitioners and scholars have an important stake in the development of the Internet as a relationship-building medium (Kent et al., 2003). Equally important is the need to evaluate the effectiveness of a Web site by analyzing input and feedback from Web users. Usability is concerned with making interfaces consistent, controllable, and predictable, which in turn makes them easy and satisfying to use (Lazar & Preece, 2002). For communication research, the focus on the Web site user’s experience implies a perspective shift in which the Web site is not seen as a text, but as the space in which user experiences take place (Vorvoreanu, 2006).
Although colleges and universities are increasingly using the Internet as a vehicle for student recruitment and a method of application, little is known about the use of the Web in higher education settings (Poock & Lefond, 2001, 2003).
Furthermore, although practitioners and scholars argue for the use of dialogic Internet principles to build and maintain relationships, even less is known about user
perceptions of the highly recommended dialogic features. This current study seeks to fill that void.
To broaden scholars and professionals understanding of the Web as a recruiting and relationship building tool in academic settings, this essay will be divided into three sections: section one (1) will review the literature on higher education, the dialogic
Sheila M. McAllister-Spooner, Ph.D., is Assistant Professor of Communication at Monmouth University, [email protected].
theory of public relations, and usability research. Section two (2) will outline the methodology, data, and results of a study that examined a full sample of community college Web sites. And section three (3) will discuss the findings and directions for future research in public relations.
Higher Education, Dialogue, and Usability
As noted above, a gap exists in academic and professional contexts about how to maximize the Internet for relational public relations purposes. Dialogic public
relations is considered one of the most ethical and effective approaches to practicing public relations in situations when organizations are highly resource dependant,
however, most organizations still do not employ dialogue very effectively or respond to the needs of their publics (Kent et al., 2003; Esrock & Leichty, 1999). In order to
understand better the issues examined in this essay: higher, the dialogic theory of public relations, and usability, the research in each area will be reviewed, starting with higher education.
Communication Challenges in Higher Education
The services provided by colleges are diffused across a vast spectrum of special interest groups—a situation that creates a communication challenge, while at the same time offers timely opportunities for generating massive financial support (Martino, 2005). With unprecedented decreases in national and state funding, public relations practitioners are faced with the daunting task of having to increase the visibility and credibility of the institution with limited funds and resources. This can best be achieved by focusing their efforts on filtering the messages through the media. The popularity of college Web sites suggests that institutions of higher learning should put real effort into using the new medium as a communications tool (Will & Callison, 2006). The idea of the Web site as a community builder in academia presents a dramatic change in orientation. Unlike the former model that was based on inside/outside orientation, the emergent model is based on the outside/inside orientation; it is more interested in what students and other target audiences want (Sevier, 2004). Public relations practitioners have become an important part of not only attracting students, but also redefining the college’s relationship to the community. By maintaining dialogue, colleges can redefine existing relationships and proactively build ongoing relationships with the diverse constituency base. The next section will provide a brief review of the historical development of the dialogic theory of public relations.
Towards a Dialogic Theory of Public Relations
The dialogic theory of public relations was developed by Pearson (1989) and further expanded by Kent and Taylor (1998, 2002), McAllister and Taylor (2007), Taylor, Kent and White (2001), Perry, Taylor, and Doerfel (2003), Taylor and Kent (2004), and Taylor and Perry (2005) in response to the recent theoretical shift to the relational approach to public relations theory development (Bruning & Ledingham, 2000).
Dialogic communication is relational—it involves an understanding of the past and the present, but also has a focus on a continued and shared future for all
participants (Kent & Taylor, 2002). As a first step toward articulating a public relations theory of dialogue, Kent and Taylor (1998, 2002) developed five overarching tenets that encompass the implicit and explicit assumptions that underlie the concept of dialogue: mutuality, or the recognition of organization–public relationships; propinquity, or the temporality and spontaneity of interactions with publics; empathy, or the
supportiveness and confirmation of public goals and interests; risk, or the willingness to interact with individuals and publics on their own terms; and commitment, or the extent to which an organization gives itself over to dialogue, interpretation, and understanding in its interactions with publics (Kent & Taylor, 2002).
Dialogic Communication and the Internet
Dialogue is more than a relational strategy for interpersonal communication; dialogue can also guide mediated relationships (Taylor et al., 2001). Kent and Taylor (1998, 2002) provided a theory-based, strategic framework to facilitate relationship with publics though the World Wide Web. The authors developed the following five dialogic principles to guide organizations in creating mediated, two-way, dialogic relationships with publics: Useful Information, which suggests that organizations provide useful information of general value to all publics; Ease of Interface, which suggests that information should be provided in a logical hierarchical structure; Conservation of Visitors, which maintains that Web sites should have fast download speeds, offer timely information, and include only essential links to other related sites; Generation of Return Visits, which maintains that sites should contain features that make them attractive for repeat visits such as special forums, commentaries, on-line question and answer sessions, and online experts to answer questions for interested visitors; and Dialogic Feedback Loops, which allows publics to query organizations and offers organizations the opportunity to respond to questions. In terms of relationship building efforts, the dialogic feedback loop feature is arguably the most important because it allows publics to query organizations and offers organizations the opportunity to respond to
questions.
The literature examining the impact of the Internet on public relations suggests that dialogic communication is one of the more important theoretical constructs in public relations, especially in Webbed communication (Ryan, 2003). In an examination of mediated responsiveness through resource dependency theory, Kent et al. (2003) demonstrated that the more dialogically oriented an organization appears, the more likely an organization is to actually respond to its stakeholders (Kent et al., 2003). In a study looking at the relationship between Web characteristics and perceptions toward relational components, Jo and Kim (2003) found that interactivity has significant effects on relationship building, and that nonessential arrangement of interactivity and
In addition to mediation, organization–public dialogue via the Internet has been used to empower activist groups (Coombs, 1998; Kent at al., 2003; & Taylor et al., 2001), and expedite crisis management response tactics (Kent et al., 2003; Perry, Taylor & Doerfel, 2003; Taylor et al., 2001; Taylor & Perry, 2004). Web pages were also found to employ interactive features to collect information, monitor public opinion on issues, and proactively engage citizens in direct dialogue about a variety of matters (Esrock & Leichty, 1999).
Esrock and Leichty concluded that only a minority of Fortune 500 organizations are using the relatively new medium to its fullest potential. Similarly, in an examination of the full sample of New Jersey’s nineteen community colleges, McAllister and Taylor (2007) detected dialogic limitations. The authors argue that the overall lack of
interactive features that solicit input and feedback from key stakeholders could directly impact the dialogic potential of these public relations Web sites (McAllister & Taylor, 2007).
The terms “Web site experience” and “user experience” have recently emerged at the forefront of Web design and business literature (Vorvoreanu, 2006). The next section will review literature exploring user perceptions of the Internet.
User Perceptions of the Internet
A majority of the scholarly literature explores causes of user frustration (Lazar, Bessiere, Ceaparu, Robinson & Shneiderman, 2003; Bessiere, Ceaparu, Lazar,
Robinson, & Shneiderman, 2002; Ceaparu, 2002; Bhatti, Bouch & Kuchinsky, 2000; and Hachigian & Hallahan, 2003).
According to Lazar et al. (2003), the five most-cited causes of frustration on the Internet were: 1) dropped connections, 2) long-download times, 3) Web page not found, 4) e-mail not sent/received properly, and 5) pop-up advertisements. Bessiere et al. (2002) found that the strongest predictors of frustration were the severity of
interruption (time lost) and the importance of the user’s goal. Bhatti et al. (2000) found that users’ perception of the Quality of Service they receive affected users likelihood of going to a competitor’s Web site, and their opinions of the company’s products and of the company itself. Hachigan and Hallahan (2003) found that content quality is a critical issue, and that information quality includes the value of the site’s content as well as its usability.
Regarding users’ perceptions of college Web sites, inspiration was drawn from Abrahamson (2000), Mechitove, Moshkovich and Taylor (2001), Poock and Lefond (2001, 2003), and Will and Callison (2006). Mechitove et al. (2001) found that the most crucial parameters influencing overall perception of Web site effectiveness by students reflected issues of information content, entertainment value, and site design. Poock and Lefond (2001) found that college Web sites should have an organization that is logical, easy to follow, and has a focus on the prospective student in mind. These
findings were supported in a follow-up study examining the characteristics that
comprised an effective graduate school Web site, with 100% of the participants rating content as important or very important (Poock & Lefond, 2003).
Will and Coy (2006) sampled and analyzed 3,738 U.S.-based colleges and universities to find that prospective donors were the most often-targeted public, followed by faculty/staff, and then prospective and current students. The researchers also found that the five items students most often seek on the Web were the five most common items linked from college home pages (Will & Coy, 2006).
With a review of the relevant literature in place, the next section will describe the research design and methodology used to assess user perceptions of relationship-building and dialogic features of community college Web sites.
Research Design and Methodology
Although prospective and current students expressed the desire and willingness to interact via the Internet, there is a void in research exploring two-way
communication between these critical publics and the colleges. This current study seeks to fill that void by posing the following research questions:
RQ1. How do college Web sites meet the information needs of students? This question was assessed by asking the participants to find critical enrollment information on the respective Web sites.
RQ2. How do users view college Web sites? This question involves an assessment of user expectations of college Web sites in relation to Kent and Taylor’s (1998, 2002) Dialogic Internet Principles.
Usability research—a major new avenue for public relations theorists and practitioners to better understand how Web sites operate and how characteristics of Web-based messages might moderate communication effectiveness—has particular relevance for enhancing the effectiveness of Web sites and other interactive techniques (Hallahan, 2001).
New Jersey colleges were selected because they offer a uniform area to survey. From a public relations perspective, college Web sites are of interest because they are highly resource-dependent non-profit organizations.
The study was conducted as an optional exercise for undergraduate students recruited from information technology courses (N = 119). Pre-paid calling cards were issued to participants as an added incentive to participate. Because usability testing does not require randomly assigned groups nor groups of sufficient number to assure statistical power for making comparisons, as few as 3-5 subjects might be sufficient to test simple problems (Hallahan, 2001). Battleson et al. (2001) reinforced Neilson’s
(2000) findings that small usability studies (5 or more people) are valid for homogeneous groups.
In addition to collecting basic demographic information and media use data, the online survey instrument includes measurements of user perceptions of each of the five theoretical constructs. Questions on the survey instrument about overall Web site design, navigability, ease of interface, usefulness of information, generation of return visits, the rule of conservation, the potential for feedback (dialogic loop), and
functionality tap into the underlying construct of dialogic communication. All measures are on a seven-point Likert scale (3 = very strongly agree, 0 = about 50/50, -3 = very strongly disagree). Alterations were made to the user surveys based on findings revealed in a pre-test of the user surveys performed by 10 students.
Participants were asked to find answers to five questions about the college on the Web site. Following the Web site experience, the participants were asked to complete a 38-item questionnaire that gathered participant demographic information, general Internet experience, the participants’ rating of the overall Internet experience, and the participants’ rating of particular dialogic Internet features. All measures are on a seven-point Likert scale (3 = extremely superior, 0 = neutral, -3 = extremely inferior). The anonymity and confidentiality of the subjects was preserved in all phases of the research.
Results Descriptives
The minimum age reported for the sample of 119 undergraduate students was eighteen years of age and maximum age reported is 61 years of age, with 87% of the population surveyed under the age of 30 (M = 23.44, SD = 8.99). Nearly 75% of the sample reported high school as the highest level of education completed (n = 89), 5% reported trade certification (n = 6), 13% reported associate degree programs (n = 16), and 7% reported bachelor degree programs (n = 8). In terms of sample breakdown for the individual colleges (M = 6.26, SD = 1.7), the minimum number of respondents in a sub-sample was 5 (4%), and the maximum number of respondents in a sub sample was 12 (10%).
Collective Findings
Table 1 reports the overall results of the first part of the research design, which tests the users’ actual experiences of the sites. Combined, the users detected 47% of the content sought (n = 336), 40% of the content could not be found (n = 230), and 10% of the total questions were not answered (n = 72). Collectively, the data suggests less than half of the sample had successful user experiences.
Table 1
Overall User Experiences
Scale Item M SD
Useful Information (1 item)
Locate first day of semester 1.36 0.533 Conservation of Visitors (1 item)
Locate last date site updated 1.73 0.831 Generation of Return Visitors (3 items)
Locate downloadable financial aid forms 1.12 0.727 Locate opportunities for online registration 1.13 423 Locate opportunities for online payment 1.54 0.937 Dialogic Feedback Loop (1 item)
Locate forums for comments and/or suggestions 1.73 1.023 Ease of Interface: Sum of potential features (N = 714) n n%
Information provided and found 336 47.1 Information provided and not found 230 32.2 Information not provided 76 10.6
Not Answered 72 10.1
Note. N = 119
To test whether variability exists between the mean scores for the nineteen individual cases, a one-way analysis of variance (ANOVA) was calculated on the overall user experiences by case. The analysis yielded a significant main effect for the
Conservation of Visitors construct F(18,100) = 1.97, p < .05, and non-significant effects for the remaining four constructs: Useful Information F(18, 100) = 1.67, p > .05; Ease of Interface F(18, 100) = 1.45, p > .05; the Generation of Return Visitors F(18,100) = 1.50, p > .05; and the Dialogic Loop F (18, 100) = 1.69, p > .05. These results suggest that it appears likely that of the population means were equal for four out of the five dialogic features and that the Conservation of Visitors feature causes differences in the scores.
Table 2 reports the overall user assessments of Kent and Taylor’s Dialogic Internet Features. The data suggests that the user assessments of the college Web sites were neutral. Although the Useful Information, Ease of Interface, and
Conservation of Visitor features received positive assessments, the Generation of Return Visitors items and the Dialogic Feedback Loop items (M = -.54, SD = 1.5) received negative assessments.
Table 2
Overall User Assessments of Dialogic Internet Features
Scale Item M SD
Useful Information Features (2 items)
Quality of Information 0.241.18 Quantity of Information 0.241.18 Ease of Interface Features (3 items)
Information Easy to Find 0.271.2
Navigation 0.081.3
Organization of Academic Offerings 0.181.2 Conservation of Visitors (2 items)
Location of Information 0.151.2
Speed of site 0.661.3
Generation of Return Visitor Features (3 items)
Online services 0.253.73
Satisfactory experience 0.211.28 Likelihood of Returning -1.041.7 Dialogic Feedback Loop (3 items)
Opportunities to give input -0.541.5
Opportunities to see what others have said -0.751.5
Level of interactivity 0.091.1
Note. N = 119
A one-way analysis of variance (ANOVA) was calculated on the overall user assessments by case to test whether variability exists between the mean scores for the nineteen individual cases. The analysis yielded a non-significant main effects for the five constructs: Conservation of Visitors, F(18,98) = 1.35, p > .05; Useful Information, F (18, 98) = .526, p > .05; Ease of Interface F(18, 96) = .336, p > .05; Generation of Return Visitors F(18,98) = 1.16, p > .05; and the Dialogic Loop F (18, 97) = .843, p > . 05. Although the sub-sample sizes ranged from 5 to 12, these findings suggest that it appears likely that of the population means were equal for four of the five dialogic features.
Case-wise Dialogic Scores
Research Question 1 asked whether the community college Web sites are meeting the information needs of students. As reported in Table 3, scores denoting the users’ actual experiences of the dialogic features were sporadic. Cases that scored high in the respective dialogic principle—where 50% or more of the features were detected—are also reported (denoted by *). These cases have the foundational features for dialogic potential in the particular area.
Of the nineteen colleges, 13 scored high in the Useful Information features (68.42%), 7 scored high in the Ease of Interface features (36.84%), 8 scored high in the Conservation of Visitors features (42.10%), 12 scored high in the Generation of Return Visitors Features (63.16%), and 4 scored high the Dialogic Feedback Loop features (21.05%). Eight of the nineteen colleges received high overall scores (42.10%), which were calculated by summing the five individual dialogic scores. These cases have the foundational features for dialogic potential.
Pearson correlations between the case-wise dialogic feature scores and the case-wise total scores were calculated to reveal highly significant relationships with the Ease of Interface features (r = .994, p <.01), and the Generation of Return Visitors features (r = .931, p <.01). Significant relationships were detected with the Useful Information features (r = .57, p <.05) and Dialogic Feedback Loop features (r = .675, p <.01). Nonsignificant correlations were detected with the Conservation of Visitors features (r = .322, p =.178).
Table 3
Case-wise Comparison of User Experiences of Dialogic Features
Case Useful Information (1 item, M = 3.68, SD = 1.89) Ease of Interface (6 items, M = 17.84, SD = 6.01) Conservation of Visitors (1 item, M = 1.74, SD = 1.48) Generation of Return Visits (3 items, M = 11.63, SD = 5.51) Dialogic Feedback Loop (1 item, M = . 947, SD = 1.31) Total Score (12 items, M = 35.84, SD = 13.45) N N n% N n n% N n n% N n n% N n n% N n n% 1 N = 8 8 4 50.0* 48 26 54.2* 8 4 50.0* 24 16 66.6* 8 2 25.0 96 52 54.6* 2 N = 1212 9 75.0* 72 33 46.0 12 1 8.3 36 28 77.7* 12 3 25.0 144 74 51.4* 3 N = 7 7 3 42.8 42 21 50.0* 7 4 57.1* 21 13 61.9* 7 1 14.2 84 42 50.0* 4 N = 6 6 5 83.0* 36 23 63.8* 6 1 16.6 18 16 88.0* 6 1 16.6 72 46 63.4*
6 N = 8 8 3 37.5 48 22 45.8 8 3 37.5 24 11 45.8 8 5 62.5* 96 44 45.8 8 N = 5 5 3 60.0* 30 13 43.3 0 0 100.0* 15 8 53.3* 0 0 100.0* 50 24 48.0 9 N = 5 5 1 20.0 30 9 30.0 5 1 20.0 15 6 40.0 0 0 100.0* 55 17 30.9 10 N = 6 6 2 33.3 36 23 63.9* 6 2 33.3 18 17 94.4* 6 2 33.3 72* 46 63.9* 11 N = 5 5 4 80.0* 30 14 46.7 5 2 40.0 15 7 46.7 5 1 20.0 60* 28 46.67 12 N = 5 5 4 80.0* 30 12 40.0 0 0 100.0* 15 8 53.3* 5 0 0.0 55* 24 43.6 13 N = 6 6 3 50.0* 36 18 50.0* 0 0 100.0* 18 14 77.8* 6 1 16.7 66* 36 54.5* 14 N = 5 5 4 80.0* 30 13 43.3 0 0 100.0* 15 7 46.7 5 0 0.0 55* 24 43.6 15 N = 7 7 3 42.9 42 20 47.6 7 5 71.4* 21 11 52.4* 7 1 14.3 84* 40 47.6 16 N = 5 5 4 80.0* 30 13 43.3 5 2 40.0 15 7 46.7 6 0 0.0 61* 26 42.6 17 N = 6 6 6 100.0* 36 16 44.4 6 3 50.0* 18 7 38.9 6 0 0.0 72* 32 44.4 18 N = 5 5 5 100.0* 30 15 50.0* 5 1 20.0 15 8 53.3* 5 1 20.0 60* 30 50.0* 19 N = 5 5 3 60.0* 30 11 36.7 5 1 20.0 15 7 46.7 5 0 0.0 60* 22 36.7
* High scoring case in respective dialogic feature (≥50% of potential items detected
These findings indicate that, other than the Conservation of Visitors experience question, the scale items constitute as reliable measurements of the overall dialogic experience. The overall scores of the cases accurately measure the dialogic capacity of the respective colleges, particularly in the areas of Useful Information, Ease of
Interface, Generation of Return Visitors, and Dialogic Feedback Loop. The data
suggests that all of the items accurately measure the usefulness of the information, the ease of interface, and the potential for dialogic feedback loops. The data also suggest that being able to find the date that the site was last updated may not be a reliable predictor of dialogic potential.
Research Question 2 how users view college Web sites. Table 4 reports the case-wise scores of Part 2 of the usability which measures users’ assessments of Kent and Taylor’s Internet principles. Cases that scored positive in the respective features— with mean scores of .00 or greater— are also reported (denoted by *). These cases have the foundational features for dialogic potential in the particular area.
Of the nineteen colleges, 16 scored positive in the Useful Information features (84.21%), 15 scored positive in the Ease of Interface features (78.95%), 18 scored positive in the Conservation of Visitors features (94.74%), 7 scored positive in the Generation of Return Visitors features (36.84%), and 6 scored positive the Dialogic Feedback Loop features (31.58%). Thirteen of the nineteen colleges received overall positive scores (68.42%). These scores were calculated by summing the five individual dialogic scores. These cases have the foundational features for dialogic potential. Table 4
Case-wise Comparison of User Assessments of Dialogic Features
Case Useful Information (2 items, M = . 258, SD = .347) Ease of Interface (3 items, M = . 279, SD = .368) Conservation of Visitors (2 items, M = .409, SD = .357) Generation of Return Visits (3 items, M = -.166, SD = .510) Dialogic Feedback Loop (3 items, M = -. 273, SD = .622) Total Score (13 items, M = -. 086, SD = .638) N M SD N M SD N M SD N M SD N M SD N M SD 1 N = 8 16 .33* 1.05 24 .33* 1.04 16 .56* 1.03 24 .00* 0.590 24 1.63*0.44 104 .57* 0.62 2 N=12 24 .38* 1.06 36 .29* 1.27 24 .50* 1.14 36 -0.33 1.53 36 -0.78 1.51 156 .01* 0.55 3 N = 7 14 .71* 1.44 21 .43* 1.43 14 .21* 1.67 21 .29* 1.85 21 -0.19 1.96 91 .29* 0.33 4 N = 6 12 .58* 1.83 18 .61* 1.72 12 .75* 1.29 18 -0.28 1.78 18 -0.17 1.62 78 .30* 0.48 5 N = 7 14 -0.14 1.10 21 -0.05 1.46 14 .00* 1.41 21 -0.19 1.47 21 -1.0 1.05 91 -0.28 0.41 6 N = 8 16 .44* 1.67 24 .30* 1.77 16 .50* 1.82 24 -0.48 1.75 24 -0.25 1.7 104 .10* 0.44 7 N = 7 7 .00* 1.28 21 .11* 1.32 14 -0.08 1.24 21 -0.22 1.52 21 -0.56 1.58 91 -0.16 0.26 8 N = 5 10 .10* 0.994 15 1.53*0.629 10 .56* 1.01 15 -0.40 1.64 15 -0.53 1.25 65 .25* 0.83 9 N = 5 10 .00* 0.00 15 .00* 0.655 10 .29* 0.951 15 .33* 0.816 15 .07* 0.704 65 .14* 0.16
10 N = 6 12 .42* 0.900 18 .22* 1.06 12 .25* 1.21 18 -0.11 1.49 18 -0.94 0.966 78 -0.03 0.54 11 N = 5 10 .40* 1.43 15 .43* 1.09 10 .33* 1.41 15 -0.87 1.64 15 .00* 1.46 65 .06* 0.55 12 N = 5 10 .20* 0.789 15 .47* 0.915 10 .29* 0.756 15 .33* 0.816 15 .08* 0.793 65 .27* 0.15 13 N = 6 12 .33* 0.778 18 -0.06 0.639 12 .45* 1.13 18 .17* 1.03 18 -0.50 0.985 78 .08* 0.37 14 N = 5 10 -0.30 0.675 15 -0.07 0.961 10 .29* 0.756 15 -1.13 1.46 15 -0.93 1.22 65 -0.43 0.59 15 N = 7 14 .29* 1.28 21 -0.10 1.25 14 .43* 1.16 21 -0.10 1.55 21 -0.10 1.51 91 .08* 0.26 16 N = 5 10 .70* 0.483 15 .27* 0.704 10 .63* 0.916 15 .80* 0.941 15 .07* 1.03 65 .49* 0.31 17 N = 6 12 .92* 1.08 18 .33* 1.23 12 1.58* 1.38 18 .56* 1.34 18 .39* 1.61 78 .76* 0.51 18 N = 5 10 -0.10 0.876 15 .00* 1.30 10 .13* 1.36 15 -0.92 1.60 15 -1.0 1.22 65 -0.38 0.54 19 N = 5 10 -.35* 1.46 15 .27* 1.33 10 .10* 1.73 15 -0.60 1.64 15 -0.47 1.30 65 -0.21 0.38
* High scoring case in respective dialogic feature (M >.00)
Measures of Association
Pearson correlations between the dialogic feature scores and the total scores were calculated to reveal highly significant relationships with the Generation of Return Visitors features (r = .637, p < .01) and the Dialogic Feedback Loop features (r = .637, p < .01); and significant relationships with the Useful Information features (r = .462, p < . 05). Nonsignificant correlations were detected with the Ease of Interface features (r = . 350, p > .05) and the Conservation of Visitor features (r = .350, p > .05).
These findings indicate that the Ease of Interface and the Conservation of Visitors assessment items may not constitute reliable measurements of the overall dialogic potential assessment. Whereas the Useful Information, Generation of Return Visitors, and Dialogic Feedback Loop items do constitute reliable measurements of the overall dialogic communication potential assessment.
Based on these findings, the researcher employed multiple regression analysis to test the relative influence of Kent and Taylor’s dialogic principle scores on the total
dialogic scores.Multiple regression is used to account for (predict) the variance in an interval dependent, based on linear combinations of interval, dichotomous, or dummy independent variables (Garson, 2006).
Results of this regression analysis yielded one model that significantly predicted the total assessment scores of the Web sites, F(5, 18) = 3.45, p = .34. The model— responsible for 57% of the variability—retained all five assessment scores. Although nonsignificant correlations were detected with the Ease of Interface features (r = .350, p > .05) and the Conservation of Visitor features (r = .350, p > .05), results of the
multiple regression suggest that the user assessments of the individual dialogic features are reliable predictors of the overall assessments.
In an effort to determine whether associations exist between the users’ experiences and the users’ assessments, the researcher deployed a regression analysis. The next section reports the results of that analysis.
Measures of Association between User Experiences and User Assessments
The researcher employed a stepwise multiple regression analysis to test the relative influence of Kent and Taylor’s dialogic principles on the dependent variable “I was able to find what I was looking for.” The researcher selected this item because it gives an overall assessment of the success of the actual experiences.
The independent variables included in the calculation include the user assessments of “the selection of images used on the site,” “the overall look of the site,” “ability to see what others have said about the college,” “ease of use,” “overall appeal,” “information location,” “organization of academic offerings,” “quality of information,” “quantity of information,” “speed of site,” “interactivity,” and “online services”.
Stepwise regression was selected because it systematically adds variables in order of importance. Furthermore, it removes any variables already in the model that were no longer significant predictors. This approach allows for the presentation of a more parsimonious model. One caveat is needed: the Stepwise Regression does not explore curvilinear relationships among the independent variables as they explain the dependent variable. Stepwise Regression does identify the linear explanatory variables in order of importance (that is, their unique contribution to explain the users’ ratings of their respective college Web sites). It removes overlap among the independent
variables and it presents a partitioned model showing the relative influence of variables that make significant contributions to explaining the variability of the ratings.
Assumptions were tested by examining normal probability plots of residuals versus predicted residuals. No violations of normality, linearity, or homoscedasticity of residuals were detected.
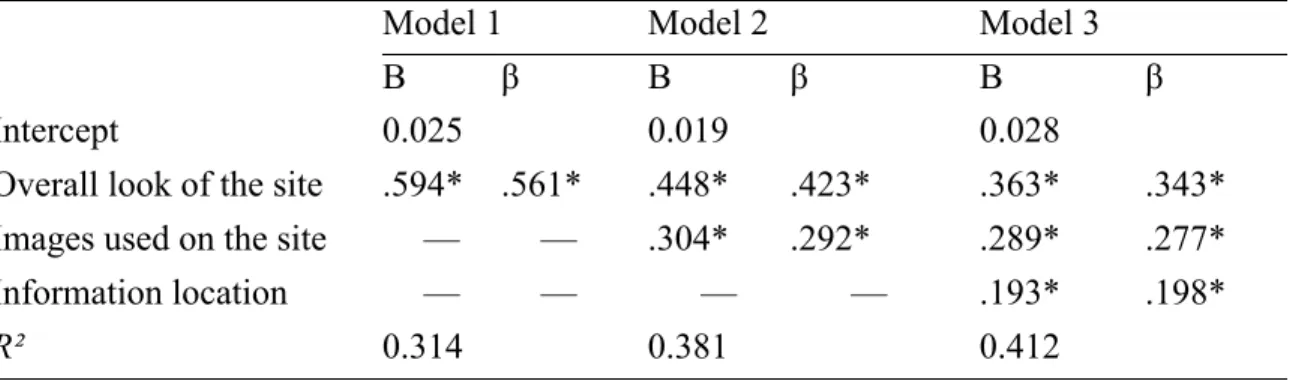
Results of the stepwise regression revealed three models that significantly predicted users’ abilities to find what they were looking for, F(1, 112) = 51.35, p ≤.001, F (1, 111) = 11.89, p = .001, and F(1, 110) = 5.87, p = .017. The three models—
responsible for considerable variance, 31.4%, 48.1%, and 41.2%, respectively— retained three items (“the overall look of the site,” “images used on the site,” and “information location”).
Table 5 displays the unstandardized regression coefficients (B), intercept, and standardized regression coefficients (β) for each variable in the respective models. Table 5
Dialogic Predictors of Users’ Ability to Find What They Were Looking For
Model 1 Model 2 Model 3
B β B β B β
Intercept 0.025 0.019 0.028
Overall look of the site .594* .561* .448* .423* .363* .343* Images used on the site — — .304* .292* .289* .277* Information location — — — — .193* .198*
R² 0.314 0.381 0.412
In terms of individual relationships between the independent variables and users’ abilities to find what they were looking for, “the overall look of the site” (t = 3.84, p ≤.001), “images used on the site” (t = 3.38, p =.001), and “information location” (t = 2.42, p =.017) each significantly predicted ability to find information. Together those variables contributed 40.1% in shared variability. Most germane to this current study is that “location” of information” predicts the least amount of variability. On the contrary, user assessments of visual elements have more predictive ability than the actual location of the information.
These findings are compelling. Although user assessments are largely determined by graphic and visual elements of the respective sites, location of
information is a key determinant. This is particularly interesting in light of the fact that graphics and images can potentially reduce the speed of the site and users of college Web sites have no patience for slow download speed (Poock & Lefond, 2001).
Reflections on How Users View College Web Sites
The highly competitive nature of college Web sites suggests a need to study and address the needs and preferences of both current and prospective Web users (Kiang Ng, 2003). Although evidence suggests that students will rely more and more on the Web for information about colleges and universities, clearly lacking are empirical data to assist college administrators in developing effective Web pages based on the wants and needs of the actual users (Poock & Lefond, 2001). This study is an attempt to fill that void.
A user’s overall response or assessment of the experience of using a site can impact the message’s effects (Hallahan, 2001). The data suggests that users are not able to find critical enrollment and academic information, and that improvement is needed in the method of content delivery, as well as the services offered via
community college Web sites. Despite the fact that they were unable to locate critical information on the community college Web sites, the data also suggests that users did not have strong feelings for or against the sites. With the exception of the Dialogic Feedback Loop features, the user assessments of the remaining Internet principles were positive. This is interesting in light of negativity of the users’ actual experiences.
This study reiterated the fact that usability testing is an integral part of Web site development. The findings identified strengths and weaknesses, which lead to
recommended changes, which will in turn; need to be evaluated, implemented, and tested again in future research.
Conclusion
The increasing presence of the Internet in the contemporary society raises important questions about the role it plays in organizational communication and the field of public relations. This study can be seen as a critical step in expanding our understanding of the dialogic theory of public relations.
References
Abrahamson, T. (2000). Life and death on the Internet: To Web or not to Web is no longer the question. The Journal of College Admissions, 68, 6-11. Battleson, B., Booth, A., & Weintrop, J. (2001). Usability testing of an academic
library Web site: A case study. The Journal of Academic Librarianship, 27(3), 199-198.
Bessiere, K., Ceaparu, I., Lazar, J., Robinson, J. & Shneiderman, B. (2002).
Understanding computer use frustration: Models and measures of incident and individual factors. Paper under review. Retrieved September 28, 2005 from http:// www.cs.umd.edu/hcil/pubs/tech-reports.shtml.
Bhatti, N., Bouch, A., & Kuchinsky, A. (2000). Integrating user-perceived quality into Web server design. Computer Networks, 33, 1-16.
Bruning, S. D., & Ledingham, J. A. (2000). Organization and key public
relationships: Testing the influence of the relationship dimensions in business. In J. Ledingham & S. Bruning (Eds.), Public relations as relationship management: A relational approach to the study and practice of public relations (pp. 159-174). Hillsdale, NJ. Lawrence Erlbaum Associates.
Ceaparu, I. (2002). Governmental Statistical Data on the Web: A Case Study of
FedStats. Paper under review. Tech report available at: http://www.cs.umd.edu/ hcil/pubs/tech-reports.shtml
Ehling, W. P., White, J., & Grunig, J. E. (1992). Public relations and marketing practices. In J. E. Grunig’s Excellence in public relations and
communication management (pp. 357-394). Mahwah, NJ: Lawrence Erlbaum Associates.
Gilroy, M. (2005, August 15). Community colleges: Struggling with multiple missions. Hispanic Outlook, pp. 24-25.
Hachigian, D., & Hallahan, K. (2003). Perceptions of public relations web sites by computer industry journalists. Public Relations Review, 29, 43-62.
Hallahan, K. (2001). Improving public relations web sites through usability research. Public Relations Review, 27, 223-239.
Kent, M. L., & Taylor, M. (1998). Building a dialogic relationship through the World Wide Web. Public Relations Review, 24, 321-340.
Kent, M. L., & Taylor, M. (2002). Toward a dialogic theory of public relations. Public Relations Review, 28, 21-37.
Kent, M. L., Taylor, M., & White, W. (2003). The relationship between Web site design and organizational responsiveness to stakeholders. Public Relations Review, 29, 66-77.
Kiang Ng, C. (2003). Evaluation of a graduate school Web site by graduate
assistants. College Student Journal. Retrieved October 8, 2005, from http:// www.findarticles.com/p/articles/mi_m0FCR/is_2_37/ai_103563749/print Lazar, J., Bessiere, K., Ceaparu, I., Robinson, J., & Shneiderman, B. (2003).
Help! I’m lost: User frustration in web navigation. IT & Society, 1(3), 18-26. Lazar, J., & Preece, J. (2002). Social considerations in online communities:
Usability, sociability, and success factors. In H. van Oostendorp, Cognition in the Digital World, Mahwah, NJ. Lawrence Erlbaum Associates.
Mechitove, A., Moshkovich, H. M., & Taylor, R. (2001). Comparative analysis of academic Web sites. Retrieved October 1, 2005, from ProQuest database. Modjeska, D., & Marsh, A. (1997). Structure and memorability of Web sites.
Computer Science Research Institute of the University of Toronto. Retrieved October 1, 2005, from http://www.ischool.utexas.edu/~i385ef04/readings/ Modjeska.pdf.
N.J. Commission on Higher Education (2006). Enrollment in colleges and
universities, by level and attendance status, Fall 2004. Retrieved January 16, 2006, from http://www.nj.gov/highereducation/enroll04.htm
Nielsen, J. (2000). Why you only need to test with 5 users. October 28, 2005, from www.useit.com/alertbox/20000319.html
Pearson, R. (1989). A Theory of Public Relations Ethics, unpublished Doctoral dissertation, Ohio University.
Perry, D. C., Taylor, M. & Doerfel, M. L. (2003). Internet-based communication
in crisis management. Management Communication Quarterly, 17(2), 206-232. Poock, M. C., & Lefond, D. (2001). How college-bound prospects perceive
university Web sites: Findings, implications, and turning browsers into applicants. College & University, 77(1), 15-21.
Poock, M. C., & Lefond, D. (2003). Characteristics of effective graduate school Web sites: Implications for the recruitment of graduate students. College & University, 78(3), 15-19.
Sevier, R. (2004). A president’s primer on developing an effective Web strategy (or 10 things to understand before you spend another dime on your Web site.) Retrieved May 4, 2004, from http://www.stamats.com/whitepapers/pdf/
WhitePaper12.pdf
Taylor, M., & Kent M. L. (2004). Congressional web sites and their potential for public dialogues. Atlantic Journal of Communication, 12(2), 59-76. Taylor, M. & Perry D.C. (2005). The diffusion of traditional and new media
tactics in crisis communication. Public Relations Review, 31, 209-217. Taylor, M., Kent, M. L., & White, W. J. (2001). How activist organizations are
using the Internet to build relationships. Public Relations Review, 27, 263-284. Vorvoreanu, M. (2006). Online organization-public relationships: An
experience-centered approach? Public Relations Review, 32, 395-401.
Will, E. M., & Callison, C. (2006). Web presence of universities: Is higher
education sending the right message online? Public Relations Review, 32, 180-183.
Williams, S. (1993). Reaping community trust. In S. Jones (Ed.), Shaping the
community college image (pp.17-43). Greeley, Colorado: National Council for Marketing and Public Relations.