Department of Computer Science and Software Engineering University of Canterbury
September 2009
Evaluating the Effectiveness of Multiple Presentations
for Open Student Model in EER-Tutor
A thesis submitted in partial fulfilment of the requirements for the Degree of Master of Science in Computer Science in the University of Canterbury by
Dandi Duan
Supervisor: Professor Dr. Antonija Mitrovic1 Associate supervisor: Dr. Neville Churcher2
1Department of Computer Science and Software Engineering, University of Canterbury 2Department of Computer Science and Software Engineering, University of Canterbury
Acknowledgements
First of all, please allow me to say thank-you to my supervisor Professor Antonija Mitrovic, who has steadily supported me throughout the research period. She has given me countless great ideas, explained whatever things I did not understand, and guided me whenever I was lost. Even she has become busier and busier, she has always been so enthusiastic and patient to me, which has been a great encouragement as I sometimes was not confident enough. Completing this research and writing up the thesis has not been an easy thing for me. Without her efforts I could never reach this point. It is my pleasure to have her involved in one of the most important moments in my life.
I also want to thank my co-supervisor Dr. Neville Churcher, especially for his recommendations about the visualization of the OSM at design phase. Thank-you to Dr. Brent Martin as well, who has been the co-leader of the ICTG and has given me great suggestions at our regular group meetings.
Not only my supervisors, but also my ICTG fellows have shown me their strong supports. I must thank Moffat Mathews and Jay Holland for helping me with so many things, such as setting up the system for evaluation; thank Amali Weerasinghe for sharing her opinions about EER-Tutor and students’ self-assessment; thank Puramudi Suraweera and Konstantin Zakharov for their previous contributions to EER-Tutor and its student model. Actually all the ICTG members are superb! I am very proud to be one of them.
Finally I would like to thank my family and friends. Thanks to Mum and Dad, who are far away from me but support me in every possible way. A big thank-you to Alex who looked after me very well at the time I struggled with my study. And thanks to Henry Chu and Xianglin Deng for accompanying with me in the department and giving me suggestions about my research.
Table of Contents
Acknowledgement 3 List of Figures 9 List of Tables 11 Abstract 13 Chapter 1 Introduction………...161.1Intelligent Tutoring Systems.…………..………17
1.2Student Modelling………...18
1.3Research Overview………..19
1.4Thesis Structure………...21
Chapter 2 Background………23
2.1Intelligent Tutoring Systems………...23
2.1.1 Architecture of ITSs………...24
2.1.2 Constraint-Based Modelling………..26
2.2EER-Tutor………...28
2.2.1 Overview of EER-Tutor……….29
2.2.2 Student Model in EER-Tutor……….31
2.3Open Student Model………33
2.3.2 Target-Arrow Abstraction………...37 2.3.3 Text Summary………38 2.3.4 Ranked List………40 2.3.5 Concept Hierarchy……….41 2.3.6 Concept Map………..43 2.3.7 Bayesian Networks………46
2.3.8 Multiple Presentations for OSM………47
Chapter 3 Research Hypotheses and Design………50
3.1 Research Goals………50 3.2 Research Hypotheses………...51 3.3 Design………..52 3.3.1 Overview………..52 3.3.2 Concept List……….53 3.3.3 Concept Hierarchy………54 3.3.4 Concept Map………56 Chapter 4 Implementation………..60
4.1 Mapping between Constraints and Concepts………...60
4.2 Summary of Learning………..62
4.3 Interface………...63
Chapter 5 Evaluation………..70
5.1 Evaluation Description………71
5.2 System Modifications………..72
5.3 Test Results and Discussion……….72
Chapter 6 Conclusion………..83
6.1 Research Conclusion………83
6.2 Future Work……….85
References 89
Appendix A Pre- and Post- Tests 98
List of Figures
2.1 Architecture of typical IT………25
2.2 User interface of KERMI..……….27
2.3 Architecture of EER-Tutor.……….29
2.4 Interface of EER-Tutor.………...30
2.5 OSM in EER-Tutor as skill meters.……….32
2.6 OSM in ELM-ART….…………...………..35
2.7 OSM in SQL-Tutor….……….36
2.8 OSM in QuizGuide……….……….37
2.9 Text summary in Flexi-OLM………….……….38
2.10 OSM in LOZ……….……..39
2.11 Ranked list in Flexi-OLM………...40
2.12 OSM in e-Kermit……….41
2.13 Topic hierarchy in Flexi-OLM………42
2.15 OSM in DynMap………44
2.16 Concept map in Flexi-OLM………..45
2.17 A fragment of Bayesian student model in VisMod………46
3.1 Concept hierarchy of EER domain………55
3.2 EER domain concepts presented as an EER diagram………57
4.1 The main page of OSM in EER-Tutor………64
4.2 Concept list of the OSM in EER-Tutor………..65
4.3 Concept hierarchy of the OSM in EER-Tutor………66
4.4 Concept map of the OSM in EER-Tutor………67
5.1 Ratings for difficulty of the OSM………..77
5.2 Ratings for usefulness of the OSM………77
List of Tables
3.1 Summary of ER notions………..58
5.1 Summary of students’ interaction with EER-Tutor……….72
5.2 Summary of the experimental group’s interaction with the OSM……..73
5.3 Correlations for the OSM………74
5.4 Correlations for different views in the OSM for experimental group…75
5.5 Correlations among the new views……….75
Abstract
As one of the central problems in the area of Intelligent Tutoring Systems (ITSs), student modelling has been widely used to assist in systems’ decision making and students’ learning. On the one hand, by reasoning about students’ knowledge in the instructional domain, a system is able to adapt its pedagogical actions in order to provide a customized learning environment. These actions may include individualized problem-selection, tailored instructions and feedback, as well as updating the presentation of student models. On the other hand, students can reflect on their own learning progress by viewing individual Open Student Models (OSMs) and enhance their meta-cognitive skills by learning from the system’s estimation of their knowledge levels. It is believed that making the information in the student model available to students can raise students’ awareness of their strengths and weaknesses in the corresponding domain and hence allow them to develop a more effective and efficient way of learning.
An OSM has been developed in EER-Tutor. EER-Tutor is a web-enhanced ITS that supports university students in learning conceptual database modelling. Students design Enhanced Entity-Relationship (EER) diagrams and receive different level of feedback in a problem-solving environment. The pedagogical decisions on feedback generation and problem selection are made according to student models. Previously, student models in EER-Tutor are presented to students on request as skill meters. Skill meters have been proved useful in helping students to improve their meta-cognitive skills. However, as the simplest presentation of a student model, skill meters contain very limited information. Some studies show that an OSM with multiple views is more effective since it supports individual preferences and different educational purposes.
The focus of our work is to develop a variety of presentations for the OSM in EER-Tutor. For this purposes, we have modified the system to include not only skill
meters but also other presentation styles. An evaluation study has been performed after the development. Both subjective and objective results have been collected. This thesis presents the extended EER-Tutor, followed by the analysis of the evaluation study.
CHAPTER
1
Introduction
Learning is the process of acquiring new knowledge and skills. As part of education and personal development, learning occurs in everyone’s life. Over several centuries, educationalists have devoted a great amount of efforts to the research of successful teaching and learning. Today, along with the rapid development of computer science and network technologies, modern pedagogy has been brought to a new level. By adequately exploiting computer software and the Internet, educators are able to deliver a variety of new teaching strategies and instruction styles through convenient modern channels, whereas students are able to obtain knowledge and experience in flexible or even personalized environments. The eventual goal is enabling students to learn more effectively and efficiently.
Educators have been widely aware of the fact that the effectiveness of learning is affected by an array of factors, including students’ background knowledge and experiences, personal abilities and motivations, learning environments, and learning goals set by both instructors and students themselves. Since students’ needs are very diverse, a simple learning environment may fail to cater specific needs of individuals [Holt et al., 1994]. Therefore, many researchers have been working in different areas to support individualization of learning process.
Our aim is to develop a learning environment which provides a set of presentation styles for OSM. Such student models are believed to satisfy individual preferences
and various teaching purposes [Bull et al., 2007]. There have been a number of studies in the area of multi-view OSM, but only a few have involved with objective evaluation. In our research, we use both subjective questionnaires and objective tests to evaluate the enhanced OSM and then draw the conclusion of how OSM with multiple presentations helps to improve students’ meta-cognitive skills.
1.1
Intelligent Tutoring Systems
While technologies are used to support learning processes, the definition of Technology Enhanced Learning (TEL) is very broad and changes continuously. The dynamic nature of TEL causes the existence of heterogeneous computer-based systems and tools, which are used in a wide variety of contexts. Among numerous existing educational systems, we often see eLearning tools, in which teachers or trainers place learning materials, so that students can study online without taking face-to-face interactions. Although eLearning platforms have become globally popular and some involve with pedagogical elements and adaptive hypermedia, they are still limited to providing instructions over the Internet. The ease they bring into teaching and learning processes does not necessarily guarantee a better learning gain because they cannot provide students with personalized assistance and immediate responses according to students’ learning performance. If eLearning tools do not hold the key to successful learning, are there any computer-based systems that simulate human teachers and give feedback in real time? The answer to this question is Intelligent Tutoring Systems (ITSs).
An intelligent tutoring system is an adaptive educational system that provides problem-solving environment and customized feedback. One of the goals of ITSs is to provide learners with individualized instruction comparable to one-to-one human tutoring. One-to-one tutoring has been proved to be more effective than traditional classroom style instruction [Bloom, 1984]. It is the best model to assist students in achieving personal highest performance because human tutors can adapt pedagogical
actions at any time on the basis of students’ current learning state. However, in real situation, it is often not practical for students to receive sufficient individual support. ITSs, as a potential solution to this problem, have been invented under such circumstances. Although current systems are still far from reaching the goal, research in the area of ITS has been constantly growing, together with the development of other related fields, such as Artificial Intelligence, Education, and Psychology.
1.2
Student Modelling
Student modelling has been widely recognized as one of the central problems in the area of ITSs. In order to make correct pedagogical decisions and deliver customized instructions, a system has to model each student’s level of knowledge in the instructional domain.
One of the key issues in successfully modelling a student is how to obtain a complete and accurate model. Ideally, a student model should illustrate the student’s knowledge state, preferred learning strategies, area of interests, preferred presentation style, and so on [Mitrovic et al., 2001]. However, the task of building such a model can be too difficult to complete. Attempting to model what a student knows correctly is not enough, but attempting to model what a student knows incorrectly is too complicated since the range of misconception is unlimited. Recall that our goal of ITSs is to build computer-based tutors that achieve the same teaching effects as human tutors, and then the student modelling process of ITSs should be close to how human teachers estimate each student’s current knowledge state. Previous research has claimed that human teachers, although use very loose models of their learners, are highly effective in what they do [Holt et al., 1994]. Therefore, even using student models with limited precision, an ITS can still be very useful.
There are different approaches to student modelling. Traditionally, student models are invisible to students. They are used only by the system to perform tailored instructions. Students are not aware of the existence of student models. In recent years, more work
has been done on presenting student model to the student, known as Open Student Model (OSM). OSM allows students to view their own models and examine the system estimation of their knowledge levels. When students are aware of their strengths and weaknesses, they may adjust their learning strategies at each stage of the learning process.
According to how much the student is involved into the maintenance of their individual models, student modelling may also be classified as passive, active and interactive modelling. Passive modelling does not need any assistance from students; whereas active modelling may require students to help with the modelling process. In the case of interactive modelling, students play an active role in the development of their own models. The student models are made inspectable. Students may be allowed to change their models or negotiate with the system about the accuracy of the models.
There is also regard on the development of OSMs for peers and instructors [Bull and Hghiem, 2002], as well as cross-course OSMs [Bull et al., 2009], but they are outside the scope of our research. Our work is based on passive open student modelling within a single domain.
1.3
Research Overview
In a one-to-one learning environment, a good human tutor is capable to assess a student’s knowledge level based on his/her performance. The tutor may also discuss it with the student on request. In addition, the tutor may be able to explain the estimation in several ways. Depending on the ability of the student and the learning goal, an appropriate way of explanation should be provided to the student. The student is hence aware of his/her own learning progress and is able to reflect on the learning process. At the end, the student should not only learn the domain knowledge, but also develop better meta-cognitive skills.
way of presenting open student model should be in line with the method human tutors use to explain their view of students’ knowledge. That means the open student model should cater for individual preferences.
At the first glance, it seems like the change of OSM does not matter much in terms of the increase in learning gain. Since the pedagogical module is the core of ITS, the student module may be considered no more than an auxiliary component. However, the goal of ITSs should be not only supporting learning about a particular domain, but also teaching students effective and efficient ways of learning. This development of meta-cognitive skills has been considered as an important goal of modern ITSs [Mitrovic and Martin, 2007].
In this research, we have modified EER-Tutor by extending its OSM to include multiple views. When students check their learning progresses, they are provided with a few options. They can choose the view they prefer at any point of time and switch between views freely. We hypothesized that students will be able to gain better understanding of their own knowledge levels by using such a student model. This enhancement of meta-cognition may finally lead to positive effects on learning in the domain.
There are three main phases in this research project:
Design an presentations that are of different styles and complexities and are suitable for EER domain and our teaching goals.
Implement each of the presentations and integrate them into the student model to form consistent delivery of the system.
Evaluate the effectiveness of the extended OSM using pre and post tests as well as questionnaire, and analyze both subjective and objective results.
The contribution of this research is in providing an approach to simulate human-to-human interaction in OSM part of ITSs, where the system gives evaluation or suggestions to students about their performance of certain tasks, and students
improve their meta-cognitive skills by learning how to learn. The evaluation study of this research shows students’ opinions about the developed system and their preferences on the presentations. It also looks into how students’ learning in the domain has been affected. These results will guide future improvement and development in the area.
1.4
Thesis Structure
There are six chapters in this thesis. Chapter presents background information and literature reviews relevant to this research project. The chapter consists of three parts, including an overview of ITSs and Constraint-Based Modelling (CBM), details of EER-Tutor and its student model, and current approaches used for OSMs. A list of presentation styles for OSM is introduced. The advantages and disadvantages of each presentation are also analyzed. In addition, examples of using multiple presentations concurrently in one student model are given and discussed.
From Chapter 3, we start presenting the core work of the research. In Section 1 of Chapter 3, the goals and hypotheses of this research are outlined, along with motivations and supportive reasoning. The second section in Chapter 3 focuses on the design part of the research. Each of the presentations that are added into OSM in EER-Tutor is described in great detail. Reasons for choosing such styles are explained. Chapter 4 continues the theme with how the new views are actually implemented. This evolves with underlying structures and calculations, redesign of interfaces, and system integration. Chapter 5 delivers the evaluation study of this research, including what evaluation methods have been used, how the evaluation has been conducted in reality, what results have been collected, plus a thorough analysis of the results.
Finally, Chapter 6 summarizes the overall work of this research. A conclusion is drawn based on the findings from evaluation. Some suggestions are given towards the improvement of OSM in ITSs. Ideas for future directions of this field are also presented.
CHAPTER
2
Background
In this chapter, we present some related works relevant to our context. We start with looking at the typical architecture of Intelligent Tutoring System, as well as the functions of each component in it. Constraint-Based Modelling is then introduced, which is an approach of overcoming the intractable nature of completely and accurately modelling students’ knowledge state. The second section gives details into EER-Tutor, which is the test bed for this research project. The student model part of EER-Tutor is highlighted since it is where we had made modifications. In the last section, a number of existing open student models are listed and discussed. We focus on how these models are presented to students, what are their pros and cons, and how students feel about them. We also address why a student model that includes multiple views are more preferable, followed by examples from previous research.
2.1
Intelligent Tutoring Systems
Psychological research has proved that one-to-one human tutoring is more effective than traditional classroom instruction with a learning improvement of two standard deviations [Bloom, 1984]. This finding has inspired and encouraged so many pioneers of research in ITSs, who have strived to build computer-based tutoring systems that deliver instructions in a way that is similar to one-to-one learning. ITSs are considered intelligent because they provide direct customized feedback to learners without the
the performance of human experts and simulate different aspects of human tutors. The development of such ITSs is an interdisciplinary field that is supported by research in artificial intelligence, computer science, education, and psychology.
ITSs can be used in a variety of instructional domains. Previous research has successfully built a number of ITSs for a broad range of fields. Some well-known examples include Cognitive Tutors [Koedinger and Anderson, 1993] for studying algebra and geometry in high school, Lisp-Tutor [Anderson et al., 1995] for learning Lisp programming language, Andes [Gertner and VanLehn 2000] for solving problems in college-level physics, AutoTutor [Graesser et al., 1999] for helping students learn physics, computer literacy and scientific reasoning, SQL-Tutor [Mitrovic, 1998; Mitrovic et al., 2001] for practicing Structured Query Language (SQL) in database management, and EER-Tutor [Suraweera and Mitrovic, 2004] for learning Enhance Entity-Relationship (EER) modelling in database design. Although these ITSs are developed through different approaches, their underlying structures can be abstracted to a consistent form.
2.1.1 Architecture of ITS
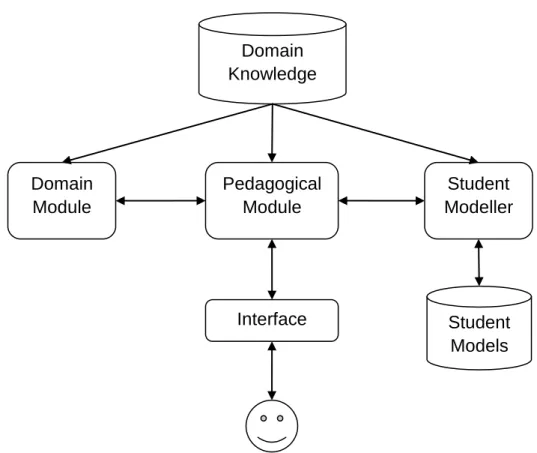
Although the existing ITSs are of different types and domains, their fundamental structures remain relatively stable. As shown in Figure 2.1, a typical ITS contains four major components: a domain module, a pedagogical module, a student modeller, and a user interface [Polson and Richardson, 1988; Freedman, 2000].
Domain Module
Research in expertise systems has shown that any domain module or expert module has to contain an abundance of precise and detailed knowledge derived from people who have many years of experiences in a particular domain [Polson and Richardson, 1988]. Therefore, the function of domain module involves codifying large amount of domain concepts as well as their interrelationship. It contains a description of the
domain knowledge that the ITS is teaching.
Figure 2.1: Architecture of typical ITS
Student Modeller
The student modeller evaluates students’ solutions, captures students’ interactions with the system, and uses the data to describe each student’s knowledge, including misconceptions and knowledge gaps. The resulting student models are dynamic. They are the system’s estimation of each student. The quality of student models is very important because they help to constrain instructional approaches. Pedagogical decisions are made on the basis of information stored in student models.
Pedagogical Module
The pedagogical module works as the core of ITS and interacts with all the other components in the system to form tutoring processes. It receives data from the domain module and student models as inputs, and then takes corrective actions, such as
Domain Knowledge Domain Module Pedagogical Module Student Modeller Interface Student Models
providing feedback, when mismatches between students’ knowledge and the domain expert’s presumed knowledge are found. These pedagogical actions are finally forwarded to the user interface.
User Interface
The user interface provides the means for students to interact with the ITS. It usually presents domain contents, questions or problems, feedback and solutions, as well as system tools to students.
2.1.2 Constraint-Based Modelling
Constraint-Based Modelling (CBM) was first introduced by Ohlsson as an approach to student modelling [Ohlsson, 1994]. Based on the theory of learning from performance errors [Ohlsson, 1996], CBM was designed to eliminate the necessity of building complete bug libraries and hence conquer the intractability of student modelling. Unlike Model Tracing (MT) approach [Anderson et al., 1995], which traces the sequence of states that a student has gone through in order to solve a problem, CBM concentrates on representing the domain using a set of explicit constraints that are derived from correct solutions. These constraints act like the fundamental principles of the domain. All correct solutions should not violate any of these constraints regardless of problem states; whereas all incorrect solutions are implicitly signified because the violation of constraints indicates errors. In other words, the constraint set partitions the universe of possible solutions into the correct and the incorrect ones [Mitrovic and Ohlsson, 1999].
According to Ohlsson and Rees’ introduction of formal notation for constraints, a
state constraint is an ordered pair <Cr, Cs>, where Cr is the relevance condition, and
Cs is the satisfaction condition. The relevance condition determines the class of
problem states for which the constraint is relevant. The satisfaction condition
semantics of a constraint is: if Cr is true, then Cs must also be true, otherwise
something is wrong.
A simple example in daily life is: if someone is a New Zealand citizen, then he/she
must enrol for elections. In this example, the relevant condition is met when a person
is a New Zealand citizen, and then the satisfaction condition has to be met as well in order to result in a correct state, which means, the person must enrol to be registered on the electoral roll.
In terms of student modelling, a student’s solution is correct if it satisfies Cs for each
constraint whose Cr has been met. Generally, when a student submits a solution to a
problem, the solution is matched against Cr in each constraint, resulting in a set of
constraints that are relevant to the problem. Each of these constraints is satisfied when its Cs has also been matched. Consequently, the solution is considered correct when
all relevant constraints are satisfied. Any violation of Cs will cause error.
It is clear to see that testing whether a known problem state is consistent with a particular set of constraints is trivial. This CBM approach simply reduces the complex computations for modelling students to pattern matching. It does not require a runnable expert module or an extensive bug library, which is difficult to build and takes huge amount of computational time in large domains [Mitrovic and Ohlsson, 1999]. Also, since the sequence of steps that a student arrives at a problem solving process does not matter in CBM, students’ solutions are not limited to certain strategies. This characteristic enhances the robustness of constraint-based ITSs, and hence encourages students’ creativity.
The Intelligent Computing Tutoring Group (ICTG) at the University of Canterbury has developed a number of constraint-based ITSs for different domains, such as SQL-Tutor for Structured Query Language [Mitrovic, 1998; Mitrovic et al., 2001], EER-Tutor for conceptual database design [Suraweera and Mitrovic, 2002, 2004], NORMIT for data normalization [Mitrovic, 2002, 2005], CAPIT for punctuation and
capitalization in English [Mayo and Mitrovic, 2001], and COLLECT-UML for collaborative learning of UML design [Baghaei et al., 2007]. In the following section, we will introduce EER-Tutor in depth since it is the system we used for this research project.
2.2
EER-Tutor
Figure 2.2: User interface of KERMIT. Adapted from Suraweera and Mitrovic [2002].
EER-Tutor is a constraint-based ITS in which students can develop skills on Enhanced Entity-Relationship (EER) modelling. Originally, the ICTG has developed KERMIT as a stand-alone constraint-based ITS for teaching basic Entity-Relationship (ER) modelling (shown in Figure 2.2) [Suraweera and Mitrovic, 2002]. Later, KERMIT has been re-implemented to a web-based ITS using WETAS, which is a web-based authoring shell [Martin and Mitrovic, 2002a,b]. KERMIT has been proved to significantly enhance students’ performance and has finally been extended to
EER-Tutor [Suraweera and Mitrovic, 2004]. As the successor of KERMIT, EER-Tutor contains a larger set of constraints and problems so that it can handle the enhanced part of database modelling based on EER notations [Zakharov et al., 2005].
2.2.1 Overview of EER-Tutor
As a web-based tutoring system, EER-Tutor is divided into server side and client side. The server processes students’ submissions, generates corresponding feedback, and records students’ interactions with the system; whereas the client side is presented as a set of dynamic web pages [Zakharov et al., 2005]. The architecture of EER-Tutor is displayed in Figure 2.3.
Figure 2.3: Architecture of EER-Tutor.
Problems and Solutions Pedagogical Module Constraint -Based Modeller
Web Server Student
Models Constraints
Web Browser Internet
EER-Tutor provides a problem-solving environment, in which students design EER schemas based on a given set of requirements. Unlike many other ITSs, EER-Tutor does not have a problem solver [Suraweera and Mitrovic, 2002]. Its domain knowledge is represented as a set of syntax and semantic constraints. The database problems and ideal solutions are also predefined. The constraint-based student modeller evaluates each solution by comparing it against the ideal solution according to the system’s knowledge base. Student models are maintained and updated dynamically. The pedagogical module drives the entire system by connecting all the components together and making individualized instructional decisions on the basis of student models. Consequently, messages are sent back to the interface to form the exchange of requests and responses between the Web Browser and the Web Server.
Figure 2.4: Interface of EER-Tutor. Adapted from Zakharov et al. [2005].
On the client side, EER-Tutor is presented to end-users as HTML pages, which can be displayed using any common Web browser. Figure 2.4 shows the main page of EER-Tutor’s interface. On the top of the page, an array of red buttons navigates users
to other pages provided by the system, such as student model and tutorial. Beneath that it is the textual description of a database modelling problem. The central area of the page is embedded with a Java applet, which allows students to draw EER models using a given list of tools. Once the student has finished drawing, he/she can click the left button at the bottom to submit the solution. Feedback will be generated immediately and be shown inside the vertical panel on the right. In the case that the student wants to see the ideal solution, he/she can click the other button to receive a pop-up page with full solution.
2.2.2 Student Model in EER-Tutor
Two types of student models are maintained in EER-Tutor: short-term models and long-term models [Suraweera and Mitrovic, 2004]. The short-term student model consists of the satisfaction and violation details of each constraint that is relevant for the current problem state. It is obtained by matching student solutions to ideal solutions and the knowledge base. Every time when a solution is submitted, the student modeller matches it to constraints and determines the ones whose relevance conditions are matched. If a constraint’s relevance condition is met, its satisfaction condition is also checked against the problem state. Any violation on the satisfaction condition of a relevant constraint will signal an error in the student solution. This short-term student model is only applicable within the scope of the current problem. The pedagogical module of the system uses the short-term model to generate customized feedback to the student.
In contrast to the short-term student model, the long-term model records the history of each constraint’s usage for the student. It contains a list of constraint numbers that the student has encountered. For each of these constraints, there is information on how many times it has been relevant for the student’s solutions and whether it has been satisfied or violated each time. This long-term student model is saved into a file every time when the student logs out, and is loaded again when he/she logs in next time. It
is used by the pedagogical module to select new problems for the student.
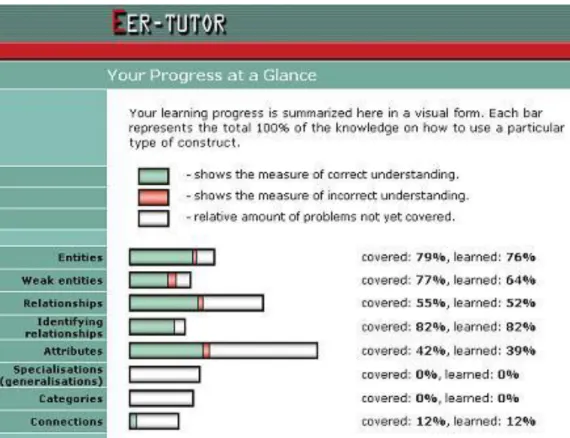
Originally, the long-term student model in EER-Tutor is open to students in the format of skill meters, as shown in Figure 2.5. It is a separate page that can be reached by clicking through the relevant button on the navigation frame of the main page. The page starts with briefly introducing the contents inside student model as a summary of the student’s learning progress, followed by short descriptions of colors being used in the meters. There are totally eight progress bars, each of which represents a major concept in the EER domain. The length of a bar indicates the relative amount of knowledge for that particular concept. The green part of a bar specifies how much the student has correctly learned about a concept; the red part gives the measurement of misconception; and the white part shows the relative amount of problems not yet covered. Each bar is also associated with percentages corresponding to covered and learned knowledge. This presentation is a highly abstracted summary of the student model in EER-Tutor.
2.3
Open Student Model
Student modeller is an essential component for adaptive educational systems. It is responsible for collecting data about all students’ activities in the learning environment, including their performance on problem solving and their interactions with the system. By analyzing such data, student modeller is also able to model each student’s level of knowledge in the instructional domain. Usually, the resulting student models are able to tell how much each student has learned on each topic, as well as how well each student has performed on each topic. These models are then used to generate customised pedagogical actions, such as problem selection and tailored feedback. Therefore, student modeller is the part that makes a tutoring system adaptive and robust.
As mentioned before, in the case of OSM, the stored information in student model is made available to the corresponding student. Students are able to view the representations of their understanding of each concept in the domain. This is believed to raise student’s awareness of their current knowledge levels and encourage them to reflect on the learning processes [Bull, 2004; Bull and Hghiem, 2002; Kay, 1997]. In a system equipped with OSM, students can check their progress over time, know how much and how well they have learned, and adjust their own learning strategies based on their strengths and weaknesses in the domain. By using such a system, they do not only study domain knowledge, but also gradually develop meta-cognitive abilities. They are aware of their own learning states and are capable to carry out self-assessment and self-reflection. The development of these meta-cognitive skills should be taken into account when designing modern ITSs [Mitrovic and Martin, 2007].
Over the past years, OSM has become increasingly important and interesting. It has been widely developed in educational systems and environments across different domains. Cook and Kay [1997] have used the accessible user model and associated
viewer programs for systems that support learning of the sam text editor. Weber and Brusilovsky [2001] have opened the user model in ELM-ART, an intelligent interactive educational system for teaching programming in LISP. Dimitrova [2002] has allowed learners to interact with STyLE-OLM, an open learner model demonstrator, in order to generate conceptual representation of their knowledge. Bull and McEvoy [2003] have implemented open learner model in C-POLMILE, an intelligent learning environment for C programming. Zapata-Rivera and Greer [2004] have designed ViSMod, which allows students to create their own models using Bayesian networks. The ICTG has also developed OSM in e-KERMIT [Hartley and Mitrovic, 2002] and SQL-Tutor [Mitrovic, 2003].
Although many educational systems have supported OSMs, the actual representations of student models differ widely. Existing systems have adopted a variety of presentation techniques for OSMs, ranging from simple summaries to complex views. Generally, the simplest views only show high level summaries of students’ knowledge on each major topic in the domain, whereas more complicated presentations are likely to display relationships between concepts as well. Moreover, OSM can be either inspection-only or interactive. Ordinary OSM only allows students to view its contents so that they do not have any control over student models. There are also a number of interactive OSMs being designed [Brusilovsky et al., 1996; Dimitrova et al., 2001; Zapata-Rivera and Greer, 2004], which enable students to edit or even negotiate with student models.
Different presentation techniques have shown diverse advantages and disadvantages, therefore they are suitable for different domains and systems. Since we do not implement negotiable student model in this project, we will not discuss related aspects. Rather, we focus on the representation style of each OSM. In the following subsections, we introduce some well-known examples of OSM, including the formats they are using, their pros and cons, and their suitability in terms of system requirements and learning goals.
2.3.1 Skill Meters
Skill meter is one of the most popular formats for OSM. It has been implemented in a number of tutoring systems, such as Geometry Tutor [Aleven and Koedinger, 2000], ELM-ART [Weber and Brusilovsky, 2001], C-POLMILE [Bull and McEvoy, 2003], and SQL-Tutor [Mitrovic and Martin, 2007]. Skill meters are usually displayed as a set of progress bars, each of which indicates the percentage of materials a student has learned for a particular topic or concept [Bull, 2004].
Figure 2.6: OSM in ELM-ART. Adapted from Weber and Brusilovsky [2001].
Figure 2.6 shows the OSM in ELM-ART, a web-based ITS designed to teach programming in Lisp. On each page of the course, learners can select a model button to view information about the status of that page. The system displays a table with
columns for the page with its current annotation and learning states. The learning states, represented as progress bars, indicate a student’s current knowledge of that page [Weber and Brusilovsky, 2001].
Figure 2.7: OSM in SQL-Tutor. Adapted from Mitrovic and Martin [2007].
In Figure 2.7, we show another example of skill meters. This is the OSM used in SQL-Tutor [Mitrovic and Martin, 2007], an ITS designed by the ICTG to help students learning the database query language SQL. This presentation of OSM is similar to the one used in EER-Tutor, as explained in Section 2.2.
Skill meter has one important advantage of being very intuitive and easy to understand. That means, students do not need to spend much time on “learning” such OSM. However, the simplicity of skill meter may also limit the extent to which OSM can help students to reason about their knowledge. Skill meters are usually high-level summaries of students’ learning status in the domain. They do not provide details in terms of students’ performance. Also, they may not be able to tell relationships among concepts in the domain.
2.3.2 Target-Arrow Abstraction
Brusilovsky and Sosnovsky [2005] have developed a web-based, self-assessment system, QuizPACK, to provide students with specially constructed classroom quizzes and adaptive guidance. They have also developed the QuizGuide system, which is a value-added service that helps students to select appropriate quizzes. In QuizGuide, they have introduced target-arrow abstraction as a way of presenting OSM.
Figure 2.8: OSM in QuizGuide. Adapted from Brusilovsky and Sosnovsky [2005].
As the interface between students and QuizPACK, QuizGuide visualizes the current state of student model by annotating domain topics with target and arrow icons (displayed in Figure 2.8). The color of a target indicates the importance of the corresponding topic as a subgoal of the course. The number of arrows in a target
indicates the system estimation of student’s knowledge on that topic. Topics that are not ready to be learned are represented as barred targets. Since a student’s learning goals and knowledge levels are constantly changing, different views of icons are shown almost every time the student accesses QuizGuide [Brusilovsky and Sosnovsky, 2005].
Same as using skill meter, the use of target and arrow icons exposes a highly abstracted summary of student model. Although students can find out a list of major domain topics and may easily understand what QuizGuide is trying to tell, the system presents only limited information about the underlying models.
2.3.3 Text Summary
Text summary is another simple presentation style for OSM. When using this format, student’s domain knowledge is usually described in natural language. Students can read through paragraph-like textual reviews to understand their knowledge levels and find out any misconceptions.
Figure 2.9: Text summary in Flexi-OLM. Adapted from Bull and Mabbott [2007].
Mabbott and Bull [2007] have included text summary in the open learner model of their system Flexi-OLM, as shown in Figure 2.9. In this view, domain knowledge is
represented in a group of concepts, which are categorized into five paragraphs according to student’s performance. The first three parts refer to three different levels of student’s understanding in domain topics. The fourth part, which is printed in red color, indicates misconceptions occurred in student’s learning process. Finally the last part lists all the topics that have not yet been modeled due to the lack of sufficient data.
Figure 2.10: OSM in LOZ. Adapted from Mohanarajah et al. [2005].
Another example is a fuzzy logic based learner model used in LOZ, a system for learning Object-Z notation [Mohanarajah et al., 2005]. As displayed in Figure 2.10, since there is fuzzy logic behind the model, fuzzy rule application process can be well described in natural language. Consequently, the view can reflect a human tutor’s decision-making process while teaching the student.
According to the existing examples, textual summaries usually imitates human tutors’ teaching process sound like human-to-human communication, and hence are easily accepted and understood by students. The special arrangement of paragraphs may be able to focus students’ attention onto their level of knowledge. However, the text-only presentation seems less attractive comparing to other views that use graphical visualizations.
2.3.4 Ranked List
Ranked list is another example of views that display concepts according to students’ knowledge levels. In a ranked list, domain topics or concepts are ordered by how much the student knows about each of them, usually from high level to low level, and then to misconceptions, with the rest listed as having insufficient data for modelling.
Figure 2.11: Ranked list in Flexi-OLM. Adapted from Bull and Mabbott [2007].
In Flexi-OLM, ranked list is also included. From Figure 2.11, it can be seen that each concept is associated with a colored box. Each color indicates a certain level, such as green for excellent knowledge, yellow for moderate knowledge, white for limited knowledge, and red for misconceptions. At the end, grey boxes are used for unclassified topics [Mabbott and Bull, 2007].
When domain topics in OSM are sequenced according to students’ performance, students may easily find out what their strengths and weaknesses are. Also, in a list view, topics may be ranked in other ways and hence deliver other advantages. For example, they can be alphabetically displayed so that users can quickly search certain topics. No matter what logic is used for ranking, there should be enough topics
defined in the domain to form a proper list. If there are very few topics, they may be modeled coarsely as know or unknown rather than into different levels, and it may be meaningless to create an alphabetical list.
2.3.5 Concept Hierarchy
All the presentation styles mentioned so far have not described any domain structures. They merely list some or all domain concepts in various ways. In contrast, concept/topic hierarchy is a tree structure built on the basis of conceptual relationships in a domain. As a popular view for OSM, concept hierarchy has been implemented in several systems, such as the sam text editor, e-Kermit, and Flexi-OLM.
Figure 2.12: OSM in e-Kermit. Adapted from [Hartley and Mitrovic, 2002].
In e-Kermit [Hartley and Mitrovic, 2002], a detailed visualization of student model has been developed in the form of a hierarchy (shown in Figure 2.12). All the
constraints are grouped pedagogically into domain categories and subcategories; whereas individual constraints are demonstrated as leaves of the tree. Each node in the tree is associated with some progress statistics, which indicate percentages of corresponding materials being taught and correctly learned. Since the concept hierarchy in e-Kermit is designed similar to a directory-view, students are also able to expand or contract certain categories to examine only part of the view in details.
Figure 2.13: Topic hierarchy in Flexi-OLM. Adapted from Bull and Mabbott [2007].
Figure 2.13 shows another example of concept hierarchy. It is the hierarchical structure used in Flexi-OLM to presents all the domain topics. Same as what have
been done in the ranked list view, they have included colored boxes as an add-on to the hierarchy in order to indicate different levels of students’ knowledge.
Concept hierarchy is different from previous views we have introduced because it does not only display student’s learning progress but also demonstrate domain structure. Previous research has found out that students tend to focus less on knowledge levels when using concept hierarchy. Instead, they spend more time on learning the overall structure and the relationships of concepts [Mitrovic and Martin, 2007; Bull and Mabbott, 2007]. Concept hierarchy may include textual description for each concept, and may also use skill meters, progress percentages, or different colors to indicate knowledge levels. It may include only a small number of topics at a time so that students can focus on a portion of the model.
2.3.6 Concept Map
Figure 2.14: Concept map in VCM. Adapted from Cimolino et al. [2003].
Concept map has been widely used for externalizing learner’s belief of propositions and relationships in a domain. Current implementations of concept map in student
modelling vary in several ways. In some systems, such as STyLE-OLM [Dimitrova, 2003] and VCM [Cimolino et al., 2003] (shown in Figure 2.14), the focus is on leaner constructed maps. In DynMap [Rueda et al., 2006] (shown in Figure 2.15) and COMOV [Perez-Martin and Alfonseca, 2007], it is the system who generates dynamic maps according to student data. Flexi-OLM [Bull and Mabbott, 2006] has also adopted this format, but its concept map is pre-constructed.
Figure 2.15: OSM in DynMap. Adapted from Rueda et al. [2006].
Figure 2.16 is a screen shot of concept map used in Flexi-OLM, which shows an example of presenting student’s knowledge using predefined map. Topics are connected by one-way arrows, specifying their relationships. The same color scale is used to indicate user’s understanding of a topic [Mabbott and Bull, 2006]. This concept map tends to be more complex than the topic hierarchy introduced in Figure 2.13. It delivers intricate domain structures and relationship among domain topics to viewers.
Figure 2.16: Concept map in Flexi-OLM. Adapted from Bull and Mabbott [2007].
Concept maps seem to be more complicated than other presentation styles. They may be very difficult to design and to understand. However, in a map view, students are able to see the differences in knowledge level at a glance. They may be distracted by the overall structure of concepts in the domain, but this may turn to be an advantage if one of the aims for OSM is encouraging students to learn such structure [Mabbott and Bull, 2007]. Students are also likely to spend time on exploring the areas with insufficient data. Consequently, the system may collect more data about students and then build better models.
2.3.7 Bayesian Networks
Zapata-Rivera and Greer [2001] have developed VisMod, an interactive visualization tool for Bayesian learner models. As displayed in Figure 2.17, learners and teachers can visualize the model using various techniques, such as color, size, closeness, link thickness, and animation.
Figure 2.17: A fragment of Bayesian student model in VisMod. Adapted from Zapata-Rivera and Greer [2001].
VisMod is able to capture information about learner’s knowledge, learning preferences, or even social aspects of learning [Zapata-Rivera and Greer, 2001]. It aims to not only support students’ knowledge awareness but also refine learner models as students interact with their own models. However, in some domains, using Bayesian networks for OSM can be very complicated for both developers and learners.
2.3.8 Multiple Presentations for OSM
In the previous sections, we have introduced a wide variety of presentation styles for OSM. It can be seen that each of them has pros and cons, and therefore is suitable for different situations in terms of domains, system types, educational goals, and students’ knowledge levels. If a system includes multiple views for its OSM, it may be more preferable for both educators and learners [Mabbott and Bull, 2004]. Previous research has raised the topic of multi-view OSM and has given some recommendations [Mabbott and Bull, 2007]. Based on their findings, several considerations should be given when offering students different views of student model.
First of all, it has been noticed that users do have different preferences for views to use. They may find some presentations more useful than others, and they may have different opinions about a particular presentation. For example, an alphabetically ranked list of concepts may be good when students want to search for certain concepts. For another example, since students have different levels of understanding about a domain, some of them may like concept map because it clearly shows where the problems are, whereas some others may be less inclined to use it due to its complexity.
The second consideration is that different purposes of OSM can be achieved using multiple presentations. Usually, the initial purpose of opening up student model is to support students’ self-reflection and planning. Some presentations are appropriate for this purpose, such as a list of concepts ranked by level of knowledge. However, the usage of OSM is not limited to this. For example, another purpose may be allowing students to provide information to the areas that have insufficient data, so that more accurate models can be built. In this case, a concept map may work well due to its visualization of these areas.
instance, in some domains, designing a concept map or Bayesian network may be infeasible, whereas in some other domains, concept hierarchy may be unavailable.
Last but not least, students’ focus of attention in presentation styles should also be considered. For example, if they find some formats particularly difficult, they are likely to switch to other views. If they are offered too many choices, they may scan each view very quickly and therefore neglect some important aspects.
CHAPTER
3
Research Hypotheses and Design
Chapter 3 starts with presenting our research objectives, including what we have aimed to discover from the research, and what hypotheses we have tried to prove. The chapter also demonstrates the processes of designing new views for the OSM in EER-Tutor. Firstly, we give an overview of the design for multi-view OSM; and then we introduce each of the new views in details.
3.1
Research Goals
This research has been aimed to achieve the following specific goals:
Perform an intensive study of existing formats for visualizing student models in a variety of educational systems, in order to find out their advantages and disadvantages as well as their suitability in different situations.
Analyze the current status of OSM in EER-Tutor, including how students are actually modeled, how student models are presented to users, and how effective the current presentation is.
Select a set of most suitable views for OSM in EER-Tutor according to the characteristics of the domain and its students, and the requirements of the system.
Design each of the selected views within the EER domain; so as to present domain concepts in appropriate ways in terms of layouts and meaningfulness.
Implement these designs in the actual tutoring system, including the development of each view based on the underlying details of student models in EER-Tutor, the integration of multiple views into the system, and the implementation of interface controls that allow students to choose between different views.
Evaluate the resulting EER-Tutor and its OSM by conducting an experiment that provides both subjective and objective results; analyze the results and then draw our conclusion.
3.2
Research Hypotheses
Before undertaking this research, we have made two main hypotheses that correspond to our research goals. Firstly, users have individual preferences of presentations for OSM in EER-Tutor. Secondly, the use of multi-view in OSM helps students with their learning in the tutoring system.
Previous research has pointed out that users do have preferences for presentation styles of student model. Mabbott and Bull [2007] have adapted their system Flexi-OLM, a multi-view open leaner model for the domain of C programming, to enable students to select their preferred presentations. The results have suggested that learners prefer a diversity of views for learner model and they benefit from the flexibility of using different layouts. In another study, Bull and her colleague have tracked learners’ visual attention while using multiple views in Flexi-OLM. They have found that students visually attend to different views of leaner model [Bull et al., 2007]. Back to the research done in the ICTG, Hartley and Mitrovic [2002] have evaluated a two-level OSM used in one of our ITSs, KERMIT. The student model has been presented in two ways: one as a simple set of skill meters, the other as a hierarchy containing more details (see Subsection 2.3.5). Results have shown that students have appreciated having access to such OSM.
most comfortable to work with. Consequently, they can understand their student models better, as well as improve their meta-cognitive skills and even domain knowledge as much as they can. Such good understanding of student models may maximize the benefits of OSM. As we introduced before, the most important usage of OSM is to enhance students’ abilities in self-assessment. Also, studies have shown that the development of students’ meta-cognitive skills can result in better problem solving and better learning [Swanson, 1990]. Therefore, starting with an extended OSM in EER-Tutor, and then leading to the improvements of students’ abilities in meta-cognition, we finally want to see the progress in their learning of the instructional domain.
This research is the first implementation of multiple views of student models in a constraint-based ITS. At the end the research, we aim to check whether students have individual differences in using these views, and whether the use of such OSM eventually lead to positive effects on students’ learning processes.
3.3
Design
In order to implement multiple presentations for OSM in EER-Tutor, the first thing is to design a set of views that are appropriate for the domain and the system. Each view should represent EER domain at certain level. Together they should form a multi-layered OSM that can summarize the domain and analyze students precisely. These selected views need to be sketched out according to the knowledge base. For each view, it has to be decided what concepts should be included, what relationships should be presented, and how they should be visualized.
3.3.1 Overview
We have done an intensive study of OSM presentations used in existing educational systems, as summarized in Chapter 2. These presentation styles have been compared to see their strengths and possible weaknesses. Now we need to relate them to EER
domain and our tutoring system, and decide which ones to include.
First of all, we need a simple OSM format that can be understood easily by every user. Originally, EER-Tutor already includes skill meters. Although they are just a high-level summary of the domain and represent only a small number of domain topics, they have been proved useful in other ITSs in terms of helping students with self-assessment [Mitrovic and Martin, 2007]. The successful use of skill meters in KERMIT, which is the predecessor of EER-Tutor, has encouraged us to keep this format. It is the simplest view among all the views. The brevity allows students to quickly comprehend meanings behind the view. The limitations have to be complemented by other views in the OSM.
Beyond skill meters, we need some views with higher complexities. That means, they should present more information about user and the domain than what skill meters do. We have finally chosen concept list, concept hierarchy and concept map, which are discussed respectively in the following sections. These views, along with skill meters, are not proposed to be shown all together to end users. We intend to present only one of them at a certain point of time. Students should be able to freely access the views they prefer and switch between views at any time they like.
3.3.2 Concept List
Since skill meters only display eight major domain topics (as shown in Figure 2.5) and there are a number of topics and sub-topics in EER domain, it is necessary to have a format of student model that shows all the concepts being taught in the tutoring system. In line with the layout of skill meters, we have decided to use a concept list rather than a text summary. The concept list is extended from skill meters. It represents a full list of domain concepts and remains a consistent looking with skill meters. Each concept is still associated with a coloured progress bar and two percentages: one for coverage of knowledge, the other one for correctly learned knowledge. For students’ convenience, these concepts are ranked by the order they are
being introduced into the corresponding course. As the concept list adopts the appearance of skill meters, it should be easy to understand by both previous and future users of the system.
3.3.3 Concept Hierarchy
The views so far do not visualize the structure of the domain. They merely display partial or complete lists of domain concepts. In skill meters and concept list, all the concepts are treated equally, and their relationships are omitted. However, concepts in EER domain have close associations with each other. These associations can be illustrated using a concept hierarchy.
Recall that concept hierarchy is a tree view of OSM, in which all the domain concepts are categorized into branches and nodes. By including this kind of presentation style, we want to provide students with information about the structure of the EER domain. While using it, students may learn not only about their own performance but also some knowledge regarding to the generalization/specialization relationships among domain topics and concepts. Also, students may be able to locate a category of concepts that they are good or not good at. The understanding of this view may require some prior knowledge about the domain. Therefore, this concept hierarchy is considered to suit advanced students who want to gain an overall image of the knowledge base.
As shown in Figure 3.1, we have developed a hierarchy view for all the EER concepts, which can be used to represent OSM in the tutoring system. In this diagram, each box indicates a domain concept, and each arrow shows a top-down relationship between two concepts. All the concepts are categorized according to their meaning. Together they build different levels of the tree. Same as in other views, each concept in the hierarchy has been planned to have two percentages that tell about user’s knowledge levels.
3.3.4 Concept Map
Although the concept hierarchy presents the structure of the whole EER domain and categorizes all the topics and concepts, there are still relationships that cannot be represented in a tree view. Actually, the concepts and relationships among EER concepts can be really intricate. We need a map-like view to visualize them. Moreover, since our purposes of using OSM are that students do not only reflect on their own learning processes but also gain more knowledge about the domain, a well designed concept map is a necessary member of the multi-view OSM. Concept map is usually hard to design and understand since it is one of the most complex presentation techniques. However, the extra information being delivered by concept map can be a very interesting challenge for advanced students.
As a popular presentation method of OSM, concept maps have been implemented in many educational systems with various layouts. In our case, we have designed an EER diagram to represent the concept map of EER domain, as shown in Figure 3.2. Table 3.1 provides a summary of ER notation as well [Elmasri and Navathe, 2003]. EER diagrams are generally used for modelling databases, but it also works well in illustrating complicated relationships of EER concepts. All the domain concepts are drawn in the diagram, either as entities or as attributes. Their relationships being displayed in this view are much more comprehensive than the top-down relationships being shown in the concept hierarchy. Each concept has also been planned to have two percentages corresponding to taught and learned knowledge.
By examining this EER diagram of EER concepts, students have a chance to enhance their meta-cognitive skills, learn domain concepts, as well as study an example of EER modelling, as EER modelling is the primary teaching goal of EER-Tutor. Moreover, when a concept has not been well learned, other concepts close to it on the map are also likely to have knowledge gaps, so students may be able to find out the areas they are having problems with.
CHAPTER
4
Implementation
Once the new views for OSM in EER-tutor have been designed, the next phase is the actual implementation of such OSM in the system. To achieve that, the original EER-Tutor has been well studied, with some parts of the system being particularly examined, such as the semantic and syntax constraints. As the core of the research, issues related to the OSM itself has also been learned, including how student models are set up, how they are updated, and how they are made viewable to students. After that, we have implemented the new views in line with the original system.
In this chapter, we firstly introduce how the constraints in the system are associated with the concepts being displayed in OSM; and then we explain how the percentages for covered and learned knowledge are calculated; finally the interface of the extended OSM are addressed in the last section.
4.1
Mapping between Constraints and Concepts
In Section 2.2 we have looked at the current implementation of OSM in EER-Tutor, which is in the format of skill meters. There are only eight major concepts shown to students as progress bars. However, in the multi-view version of OSM, there are more than thirty categories and concepts available for viewing. To fit our new design into the current system, each concept being displayed in the new presentations must rely on a list of related constraints, and vice versa, each constraint can affect a set of
![Figure 2.2: User interface of KERMIT. Adapted from Suraweera and Mitrovic [2002].](https://thumb-us.123doks.com/thumbv2/123dok_us/9935649.2486398/28.892.141.762.345.846/figure-user-interface-kermit-adapted-suraweera-mitrovic.webp)

![Figure 2.4: Interface of EER-Tutor. Adapted from Zakharov et al. [2005].](https://thumb-us.123doks.com/thumbv2/123dok_us/9935649.2486398/30.892.139.761.513.979/figure-interface-eer-tutor-adapted-zakharov-et-al.webp)
![Figure 2.6: OSM in ELM-ART. Adapted from Weber and Brusilovsky [2001].](https://thumb-us.123doks.com/thumbv2/123dok_us/9935649.2486398/35.892.149.745.411.981/figure-osm-elm-art-adapted-weber-brusilovsky.webp)
![Figure 2.7: OSM in SQL-Tutor. Adapted from Mitrovic and Martin [2007].](https://thumb-us.123doks.com/thumbv2/123dok_us/9935649.2486398/36.892.138.758.239.645/figure-osm-sql-tutor-adapted-mitrovic-martin.webp)
![Figure 2.8: OSM in QuizGuide. Adapted from Brusilovsky and Sosnovsky [2005].](https://thumb-us.123doks.com/thumbv2/123dok_us/9935649.2486398/37.892.172.726.381.949/figure-osm-quizguide-adapted-from-brusilovsky-and-sosnovsky.webp)
![Figure 2.10: OSM in LOZ. Adapted from Mohanarajah et al. [2005].](https://thumb-us.123doks.com/thumbv2/123dok_us/9935649.2486398/39.892.142.763.344.703/figure-osm-in-loz-adapted-from-mohanarajah-et.webp)
![Figure 2.11: Ranked list in Flexi-OLM. Adapted from Bull and Mabbott [2007].](https://thumb-us.123doks.com/thumbv2/123dok_us/9935649.2486398/40.892.349.545.342.702/figure-ranked-list-flexi-olm-adapted-bull-mabbott.webp)
