qmethod: A Package to Explore Human
Perspectives Using Q Methodology
by Aiora Zabala
AbstractQ is a methodology to explore the distinct subjective perspectives that exist within a group. It is used increasingly across disciplines. The methodology is semi-qualitative and the data are analysed using data reduction methods to discern the existing patterns of thought. This package is the first to perform Q analysis in R, and it provides many advantages to the existing software: namely, it is fully cross-platform, the algorithms can be transparently examined, it provides results in a clearly structured and tabulated form ready for further exploration and modelling, it produces a graphical summary of the results, and it generates a more concise report of the distinguishing and consensus statements. This paper introduces the methodology and explains how to use the package, its advantages as well as its limitations. I illustrate the main functions with a dataset on value patterns about democracy.
Introduction
Identifying the different perspectives on or attitudes towards topics of public concern is an important research objective in fields spanning social (e.g.,Zografos,2007), environmental (e.g.,Sandbrook et al., 2011) and health sciences (e.g.,Thompson et al.,2001). Q is a clearly structured, systematic, and increasingly-used methodology designed specifically for these purposes (Watts and Stenner,2012; Barry and Proops,1999). It is aimed at exploring the distinct perspectives, discourses, or decision-making styles within a group in order to address practical matters such as the acceptance of new policies and technology or increasing public participation. The method can be used, for example, to identify student learning styles, farmer attitudes towards natural conservation (e.g.,Davies and Hodge,2012;Brodt et al.,2006), user views on technology innovation (Petit dit Dariel et al.,2013), transportation habits (van Exel et al.,2011), citizen identities (Davis,1999), heterogeneous concepts of love (Watts and Stenner,2005), or leadership styles in business.
In essence, the data collected in Q methodology (also known asQ techniqueorQ-sort) consist of a set of items (usually statements) sorted in a specific arrangement. These statements represent all possible opinions, which each respondent sorts in order to express their views (usually frommost agree
tomost disagree).1 The analytical process reduces the data based on principal components analysis (PCA) or factor analysis (FA). However, instead of correlating variables (as in regular PCA and FA), in Q the respondents are correlated in order to elucidate the relationships between them. The standard data reduction method is followed by a set of analytical steps specific to Q methodology. The final results consist of a small number of sets of sorted statements (typically called thefactors), which are different from each other and summarise the perspectives existing among the respondents. These results can be used for further research: to model the relation between perspectives and other variables, to develop a quick test to identify perspectives in larger populations, or to understand the evolution of perspectives over time.
The analysis for Q methodology requires multiple matrix algebra operations which have been described in detail (see Chapter 4 and Appendix inBrown,1980). The full analysis is implemented in software specific to Q, predominantly PQMethod, which is freely available, written in Fortran, and fully functional in Windows and Mac-OS (Schmolck,2014). Other software include PCQ (paid-license, Windows only,Stricklin and Almeida,2004) and Q-Assessor (paid-license, web-based,Epimetrics Group, LLC,2010). The latter two provide tools for data collection, but the final output and report are virtually the same in all three.
This R package improves the existing Q software in a number of ways. It is fully cross-platform. It allows a completely transparent examination of the equations and the constants used in the com-putation at each step of the analysis, helping researchers to better understand the process. For the data reduction technique, correlation coefficients other than Pearson are also allowed. The output is concisely structured and tabulated in numerical form rather than in a large fixed width text file, therefore it provides a more straightforward and flexible means to study and handle the results. Thus
qmethod(Zabala,2014) results can be easily used for further quantitative modelling and for graphical representation. In addition, the final output in this package provides a clearer and more synthetic report on distinguishing and consensus statements (see below). The package also includes a specific plot()method to build a novel visualisation of the results, as well as import and export functionality. 1While the Likert scales predominate in practice, Q-sorts are also widely used and include standardised sets of statements. The advantages and disadvantages are reviewed inSerfass and Sherman(2013).
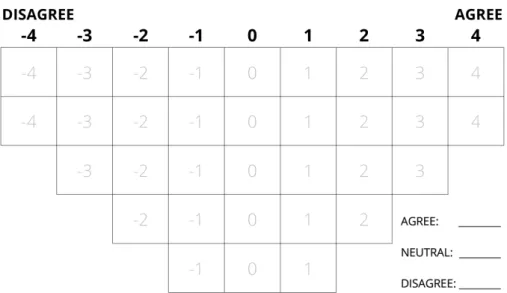
Figure 1:An example of a grid to sort statements in Q method.
The Q methodology
Q is a powerful methodology to shed light on complex problems in which human subjectivity is involved. Subjectivity is understood as how people conceive and communicate their point of view about a subject (McKeown and Thomas,2013). The method originated from a 1935 proposal to correlate respondents instead of variables in FA by Stephenson (Stephenson,1935), an assistant to Spearman—the developer of FA. Q was used initially in psychology, then in political science, and, after that, in several other fields. The analytical process is clearly structured and well established (Stephenson,1953;Brown,1980), and Q is increasingly being used across disciplines and for different purposes such as policy evaluation, understanding decision-making, or participatory processes.
The following characteristics of the methodology will help in deciding whether it is a suitable approach for a given question. It is versatile due to its compatibility with small samples (see below). It is predominantly exploratory because the patterns of views emerge from the study and thus prevent the researcher from imposing a frame of reference or pre-determined assumptions and definitions (McKeown and Thomas,2013;Stenner et al.,2008). It is a mixed or semi-qualitative methodology because though the data collected are quantitatively analysed, their interpretation is extensively qualitative (Ramlo,2011) and makes thorough use of theory. The results can be used in combination with other qualitative methods and as a starting point for quantitative confirmatory methods. For example, Q can be combined with discourse analysis, or it can be used in regression models to examine how perspectives influence behaviour. The basic analytical principle is to correlate the entire responses of individuals. These responses are measured using the same unit, which is often calledpsychological significanceorself-significance, and they indicate the salience (engagement or disengagement) of the statement for the respondent. Both aspects contrast with regular FA, in which variables are correlated and, having different units, may also be incommensurable.
Research design
In its most frequent form, the Q approach consists of selecting a set of statements and asking respon-dents to sort them over a grid, frommost agreementtomost disagreement(see Figure1for an example of a grid). The statements are a representative sample of theconcourse, the whole set of possible expres-sions on a topic, gathered from all possible points of view (in theory, a concourse would be infinite). The researcher collects a large set of statements from interviews, reviews of literature or mass media, expert consultation, participant observation, etc. This collection is reduced to a final representative selection that usually ranges between 40 and 80 statements (Watts and Stenner,2012). The statements can express understandings or behavioural preferences relating to the topic. Occasionally, photos, sounds, or other types of stimuli may be used instead of statements.
The sample of respondents does not need to be large or representative of the population, but it must be diverse. The aim is to get the most diverse range of opinions, regardless of whether they are minority ones. The shape of the grid used to sort the statements is up to the researcher. This grid is usually bell-shaped as in Figure1, assuming that fewer statements generate strong engagement (Brown, 1980). Respondents commonly sort the statements according to their agreement or disagreement, although there are other possibleconditions of instruction—different ways in which participants are
asked to sort the statements (McKeown and Thomas,2013), e. g., “Sort the statements according to how person A would respond”. A succinct description of the research design can be found invan Exel and de Graaf(2005),Watts and Stenner(2012) offer a detailed reference manual, and a key and extensive work is that ofBrown(1980).
Analytical process
The data collected from all respondents are introduced into a matrix with statements as rows and respondents as columns, where the cell values are the score in the grid in which the respondent sorted the statement. For example, in Figure1the statements that a respondent most disagreed with would get a score of−4. Sample data available with the package can be loaded by using the command data(lipset). The array of scores for all the statements sorted by a single respondent (the column) is called theQ-sort.
The process of analysis has two main parts. In the first, a multivariate data reduction technique is applied, either centroid factor analysis or PCA. This package currently implements only the PCA solution. PCA is readily available in R, and the results from both techniques are similar (McKeown and Thomas,2013;Watts and Stenner,2012). The centroid algorithm for factor analysis is an alternative method for FA used almost exclusively in Q methodology and described inBrown(1980). This algorithm differs from standard FA (as implemented infactanal()) and their results, although highly correlated, are not identical.
Initially, a correlation matrix between Q-sorts is built, and the chosen multivariate technique reduces this correlation matrix into components. The components are ordered by the total variability that they explain, and so the first components summarise most of the variability of the initial correlation matrix. Then the first few components are selected and rotated in order to obtain a clearer and simpler structure of the data. The usual criteria by which the number of components is selected include,
inter alia, the total amount of variability explained, eigenvalues higher than a certain threshold—both accessible through the callloadings(principal(...))frompsych(Revelle,2014), and a compromised solution between complexity and interpretability (further details about the possible criteria are given inWatts and Stenner,2012).
The rotation of components in Q studies can be either manual (judgemental) or mathematically optimal (analytical). The rotation results in a matrix of componentloadingswith Q-sorts as rows and components as columns, indicating the relationship between each Q-sort and component. Mathemati-cal rotation is implemented in the package within the functionqmethod(). This function calls internally principal()frompsych, which conveniently wraps the rotation modes fromGPArotation(Bernaards and Jennrich,2005) into a single function. Any of the rotations implemented inprincipal()can be called inqmethod, and"varimax"is the most commonly used. Manual rotation is not integrated in the current version.2
The second part of the analysis is particular to Q. It consists of a) flagging the Q-sorts that will define each component (hereafter calledfactor, as it usually is in the literature; implemented in the functionqflag()), b) calculating the scores of statements for each factor (z-scores and factor scores, implemented inqzscore()), and c) finding the distinguishing and consensus statements (implemented inqda()).3
The most representative Q-sorts for each factor areflagged(a), meaning that only these Q-sorts are used for subsequent calculations. The purpose of flagging is to obtain more distinguishable perspectives, and it may be done either automatically or manually, the latter occurring when the researcher has relevant knowledge about any of the respondents. Automatic flagging is based on two criteria: that the loading`should be significantly high (the significance threshold for a p-value<.05 is given by equation1, whereNis the number of statements;Brown 1980), and that the square loading for a factorjshould be higher than the sum of the square loadings for all other factors (equation2, wherefis the total number of factors;Brown 1980). Some Q-sorts may be considered confounding because they load highly in more than one factor and thus they are not flagged. Alternatively, manual flagging may be used (see details on how to run manual flagging inImplementation of the analysis in 2The graphical interface PQROT, for Windows and Mac-OS only, complements PQMethod and allows manual rotation.
3All the necessary equations are detailed inBrown(1980) and may be examined in the corresponding R function by typing its name, e. g.,qzscore.
qmethod). ` > 1.96√ N (1) `2j > f
∑
i=1 `2i −`2j (2)The z-scores (b) indicate the relationship between statements and factors, i. e., how much each factor
agreeswith a statement. The z-score is a weighted average of the scores given by the flagged Q-sorts to that statement. The factor scores are obtained by rounding the z-scores towards the array of discrete values in the grid. In Figure1, this array of discrete values would bec(-4,-4,-3,-3,-3,-2,... ,4).4 The final outcome of the analysis is the selected number of factors, representing one perspective each. These perspectives are a hypothetical Q-sort that has been reconstructed from the factor scores.
Next, some general characteristics are calculated in order to compare the factors. For each factor, the following are provided: the number of flagged Q-sorts, the composite reliability, and the standard error (SE) of factor scores. Two additional matrices indicate the similarity between the z-scores of each pair of factors: the correlation coefficients and the standard error of differences (SED, based on the
SE).5
Finally, the factor comparison identifies the consensus and distinguishing statements (c). For each pair of factors, if the difference between the z-scores of a statement is statistically significant (based on the SED), then what both factorsthinkabout that statement is distinct. When none of the differences between any pair of factors are significant, then the statement is considered of consensus.
Interpretation and reporting
The interpretation of each perspective is based on the Q-sort reconstructed from the factor scores and on the salience and distinctiveness of the statements. Each respondent may be more closely related to one of the perspectives, and this relation is determined by the loadings calculated at the beginning. The key elements to look at are the relative position of statements within the grid (particularly those at the extremes), the position of a statement in a perspective versus the position of the same statement in other perspectives, and the distinguishing and consensus statements. Each perspective is given a semantic denomination and is described in as much length as necessary, each description deriving from the literature and from qualitative explanations collected after each response.
The essential characteristics of a Q study include the process of selecting statements, the shape of the distribution grid, the number of participants and the criteria for their selection, the methods for extraction and rotation of factors, and the number of Q-sorts loading on each factor. The results are usually reported with a table of statements including either their z-scores or factor scores, and an indication of which statements are distinguishing and which consensus. The table of factor loadings may also be included, showing the Q-sorts that were flagged.
Implementation of the analysis in qmethod
The core of the package consists of a main functionqmethod()and four subordinate functions that conform to the steps of the analysis:qflag(), qzscores(),qfcharact(), andqdc(). The function qmethod()is a wrapper that calls internally PCA to calculate loadings and the four other functions. The individual functions can be run independently to build the analysis step-by-step in order to maintain more control over what happens at each stage or to perform more advanced analysis. Yet running the individual steps will rarely be necessary unless the researcher wants to use other methods for extraction or manual flagging. The core functionality is complemented with additional functions to print, summarize, plot, import, and export.
The raw data is provided toqmethod()as a matrix or data frame with statements as rows and Q-sorts as columns. The number of factors to extract is necessary, and this can be decided upon exploration of the raw data based on criteria recommended in the literature, as explained above inAnalytical process. The method for rotation is"varimax"by default, but other methods can be specified. If respondents do not have to follow the distribution grid strictly when sorting the statements, then the argumentforcedshould beFALSEand a vector must be provided in the argument 4The calculations of both z-scores and rounded scores are implemented in the functionqzscores(). The function calculates factor weights and the weighted average scores for each statement. Then it standardizes the scores into the z-scores and rounds the z-scores to the discrete values of the distribution.
5All the general factor characteristics are calculated in the functionqdcharact(). These are based on the loadings, the flagged Q-sorts, and a matrix of z-scores resulting fromqzscores().
distribution. Thisdistributionvector is the array of values corresponding to the grid. By calling qmethod()with all the necessary arguments, the full analysis is performed and the outputs are put together in an object of class"QmethodRes".
In order to run manual flagging, the functions corresponding to individual steps may be used instead ofqmethod(): namely,qzscores()andqdc()(qfcharact()is called internally inqzscores()). First, and in order to assess which Q-sorts to flag, one may run the functionqflag()and examine the resulting table of loadings. Second, inqzscores()a logical matrix ofnQ-sorts and ffactors may be provided in the argumentflagged, where the cells may beTRUEto indicate flagging. After calculating the z-scores, distinguishing and consensus statements may be identified using the functionqdc().
The package also allows the use of correlation coefficients other than Pearson for the extraction of factors, namely Spearman and Kendall. These may be appropriate for non-parametric data and may sometimes enable a greater amount of variability to be explained with fewer factors (for a technical note about correlation coefficients, seeBrown,1980, p. 276).
Understanding and exploring results from theqmethod()function
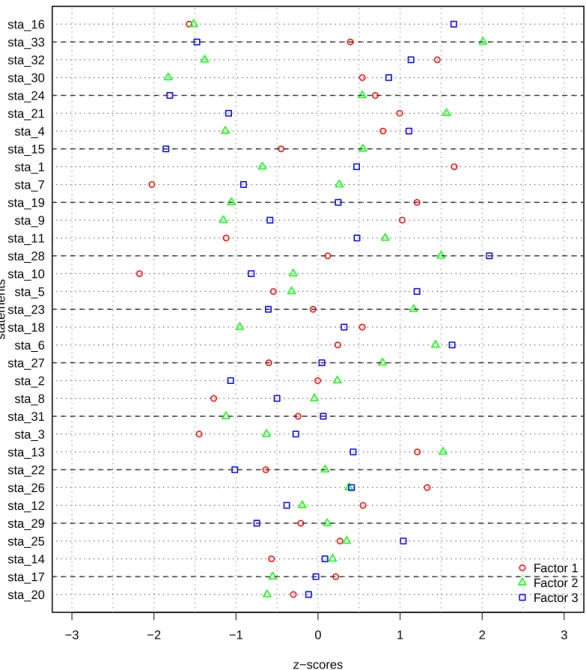
The functionqmethod()returns the results in a list of class"QmethodRes"containing eight objects. The methodprint()for an object of class"QmethodRes"provides a snapshot of the full results with descriptive names for each object within the list, as listed below (in parenthesis, the actual names of the objects within the list).6The methodsummary()displays the essential tables. In order to visualize the results at a glance, the methodplot()builds a dot-chart of z-scores, as in Figure2.
1. “Q-method analysis”(...$brief): a list with basic information of the analysis including date, number of Q-sorts and of statements, number of factors extracted, and rotation.
2. “Original data”(...$dataset): a data frame with the raw data.
3. “Q-sort factor loadings”(...$loa): a data frame with the rotated loadings obtained from principal().
4. “Flagged Q-sorts”(...$flagged): a logical data frame indicating which Q-sorts are flagged for which factors, obtained fromqflag().
5. “Statement z-scores”(...$zsc): the weighted average value of each statement for each factor, obtained fromqzscores().
6. “Statement factor scores”(...$zsc_n): the scores rounded to match the array of discrete values in the distribution, obtained fromqzscores().
7. “Factor characteristics”(...$f_char): a list of three objects, obtained fromqfcharact(): (a) A matrix with the general characteristics of each factor(...$f_char$characteristics):
• Average reliability coefficient • Number of loading Q-sorts • Eigenvalues
• Percentage of explained variance • Composite reliability
• Standard error of factor scores
(b) The matrix of “Correlation between factor z-scores”(...$f_char$cor_zsc). (c) The matrix of “Standard errors of differences between factors”(...$f_char$sd_dif). 8. “Distinguishing and consensus statements”(...$qdc): a data frame that compares the z-scores
between all pairs of factors, obtained fromqcd().
The last object “Distinguishing and consensus statements” may be explained in detail. This object results from an internal call to the functionqdc(). For each pair of factors, this function calculates the absolute difference in z-scores and compares this difference with the significance thresholds for .05 and .01 p-value levels. The functionqdc()returns a data frame with statements as rows and comparisons as columns. All the comparisons are synthesised in the first variable of the data frame, which is a categorical variable named"dist.and.cons"that indicates whether the statement is of consensus or distinguishing for one or more factors (see an example below inUsage example). The following are the possible categories that a statement can fall into in the"dist.and.cons"variable:
• “Distinguishes all”: When all the differences between all pairs of factors are significant. 6Note that in the output of results the statements have a unique ID of the type"n*"and the actual text of the statements is not merged. Adding the corresponding text of the statements to the final results can be easily done using, for example,merge(),cbind()orrownames(). See an example below inUsage example.
• “Distinguishes fionly”: When the differences between factoriand all other factors are significant, and the differences between all other pairs of factors are not.
• “Distinguishes fi(...)”: When the differences between factoriand all other factors are significant, and some (but not all) of the differences between other pairs of factors are significant. If this is the case for more than one factor, the string is concatenated, e. g., “Distinguishes f1 Distinguishes f3”. This category may arise only in solutions of four or more factors. • “Consensus”: When none of the differences are significant because all factors give the statement
a similar score.
• "": Leaves an empty string in the cell of those statements which do not fulfil any of the above conditions, i. e., statements that are neither consensus nor clearly distinguishing any factor from all the rest. But while they do not distinguish any particular factor from all the rest, they do distinguish some pairs of factors. The role of these statements may be inspected in detail by looking at the significance columns.
This structure of results is different from that of other Q software and it contains all the necessary information without any redundancy. This output can be converted into the exact outline provided by PQMethod by using the functionexport.qm()(see below), an outline that is much longer. Most of this conversion consists of taking the data frames of z-scores, of factor scores, and of distinguishing and consensus statements (objects 5, 6, and 8 within the list of results), and reordering or merging them according to different criteria.
Importing and exporting data
The functionimport.pqmethod()retrieves data from a .DAT file, which is the raw data file saved by PQMethod software. Individual data frames from a"QmethodRes"object may be exported as a CSV using, for example,write.table()(to find the objects to export from within the list of results, see the description of the outputs above inUnderstanding and exploring results from theqmethod()function). The functionexport.qm()saves all the results obtained fromqmethod()in a text file, building the report which is then used for the interpretation. This report has two flavours defined in the argument style:"R"and"PQMethod". "R"exports the results exactly as the functionqmethod()returns them. "PQmethod"exports the results following the structure of the output in PQMethod (a .LIS file). Note that the latter is a much longer outline and has some redundant information in the form of tables reordered according to different criteria. This alternative outline might be convenient for researchers accustomed to PQMethod.
Usage example
For demonstration purposes, I use theLipsetdataset about the value patterns of democracy (Lipset 1963andStephenson 1970, both inBrown,1980), which contains 9 respondents and 33 statements. The following code performs a full analysis using principal components and varimax rotation to extract three components (factors).
data(lipset)
lipset[[1]] # Shows the dataset, a matrix of 33x9 lipset[[2]] # Shows the text of the 33 statements
results <- qmethod(lipset[[1]], nfactors = 3, rotation = "varimax")
The objectresultsis of class"QmethodRes", and the specific methodsummary()for this class returns the basic information and the data frame of factor scores as shown below. This data frame contains the three factors or main perspectives. Each perspective has a distinct array of statement scores, which correspond to the scores in Figure1and indicate the agreement or disagreement of the given perspective with each statement. For example, perspective one is in strong agreement with statement 1 ("sta_1"has a score of 4), whereas the statement deserves the opposite opinion according to perspective two (a score of−2) and perspective three considers it in the middle ground (a score of 1). The next matrix contains general information about each factor, of which the most relevant piece may be the number of loading Q-sorts and the explained variance, which are approximate indicators of the strength of each perspective and of the proportion of the opinions they explain.
> summary(results) Q-method analysis.
Finished on: Tue Oct 21 10:22:50 2014 Original data: 33 statements, 9 Q-sorts Number of factors: 3
Rotation: varimax
Flagging: automatic
Correlation coefficient: pearson Factor scores fsc_f1 fsc_f2 fsc_f3 sta_1 4 -2 1 sta_2 0 1 -3 sta_3 -3 -1 -1 sta_4 2 -3 2 sta_5 -1 -1 3 sta_6 0 3 3 sta_7 -4 1 -2 sta_8 -3 0 -1 sta_9 2 -3 -1 sta_10 -4 -1 -2 sta_11 -2 2 2 sta_12 1 0 -1 sta_13 3 3 1 sta_14 -2 0 0 sta_15 -1 2 -4 sta_16 -3 -4 4 sta_17 0 -1 0 sta_18 1 -2 1 sta_19 3 -2 1 sta_20 -1 -1 0 sta_21 2 4 -3 sta_22 -2 0 -2 sta_23 0 2 -1 sta_24 2 1 -4 sta_25 1 1 2 sta_26 3 1 1 sta_27 -2 2 0 sta_28 0 3 4 sta_29 -1 0 -2 sta_30 1 -4 2 sta_31 -1 -2 0 sta_32 4 -3 3 sta_33 1 4 -3 f1 f2 f3
Average reliability coefficient 0.80 0.80 0.80 Number of loading Q-sorts 3.00 3.00 3.00
Eigenvalues 2.09 1.97 1.68
Percentage of explained variance 23.17 21.93 18.68 Composite reliability 0.92 0.92 0.92 Standard error of factor scores 0.28 0.28 0.28
Any of the results may be retrieved by using the corresponding object name indicated under Under-standing and exploring results from theqmethod()function, and thus customised for easier exploration. For instance, the z-scores may be shown by using the commandresults$zsc. In the example below, the factor scores are merged with the actual text of the statements and then ordered. The data frame is reordered according to the scores of the statements for each factor, so that the researcher can quickly identify which statements are in most agreement for a given perspective, and what other perspectives think of the same statements:
# Merge the statements with their actual text: scores <- cbind(results$zsc_n, lipset[[2]]) # Order the results by the scores of each factor: for (i in 1:length(results$loa)) {
View(scores[order(scores[i], decreasing = TRUE), ], title = paste0("Order for f", i))
● ● ● ● ● ● ● ● ● ● ● ● ● ● ● ● ● ● ● ● ● ● ● ● ● ● ● ● ● ● ● ● ● −3 −2 −1 0 1 2 3 z−scores statements sta_20 sta_17 sta_14 sta_25 sta_29 sta_12 sta_26 sta_22 sta_13 sta_3 sta_31 sta_8 sta_2 sta_27 sta_6 sta_18 sta_23 sta_5 sta_10 sta_28 sta_11 sta_9 sta_19 sta_7 sta_1 sta_15 sta_4 sta_21 sta_24 sta_30 sta_32 sta_33 sta_16 ● Factor 1 Factor 2 Factor 3
Figure 2:An example of aplotof an object of class"QmethodRes". The statements are ordered by the standard deviation of z-scores for all three factors.
The methodplot()for class"QmethodRes"returns a dot-chart of the z-scores specifically adapted for Q methodology, as in Figure2. In this figure, built with the code below, the comparison among the z-scores of all factors can be explored. For example, all three points are far from each other in statement 33, meaning that each of the three factors holds a distinctive opinion regarding this statement. For statement 20, however, the points are clustered together, indicating consensus. Finally, statement 16 clearly distinguishes factor three from the rest (its point being far from the other two).
par(lwd = 1.5, mar = c(4, 4, 0, 0) + 0.1) plot(results)
abline(h = seq(from = 2, to = 32, by = 3), col = grey(0.2), lty = 2)
The table of distinguishing and consensus statements below conveys the observations gleaned from Figure2with greater precision. For example, column"f1_f2"shows the absolute difference in z-scores between factor one and factor two. In the column immediately to the right ("sig_f1_f2"), a single star or double star indicate differences that are significant at p-values< .05 and < .01 respectively, and arise from the magnitude of the difference and the thresholds given by the SED.
> # Data frame of distinguishing and consensus statements: > format(results$qdc, digits = 1, nsmall = 2)
dist.and.cons f1_f2 sig_f1_f2 f1_f3 sig_f1_f3 f2_f3 sig_f2_f3
sta_1 Distinguishes all 2.34 ** 1.19 ** 1.15 **
sta_2 Distinguishes f3 only 0.24 1.06 ** 1.30 ** sta_3 Distinguishes f1 only 0.82 * 1.18 ** 0.36
sta_4 Distinguishes f2 only 1.92 ** 0.32 2.24 ** sta_5 Distinguishes f3 only 0.22 1.75 ** 1.53 ** sta_6 Distinguishes f1 only 1.19 ** 1.39 ** 0.20
sta_7 Distinguishes all 2.28 ** 1.12 ** 1.17 **
sta_8 Distinguishes f1 only 1.23 ** 0.77 * 0.46 sta_9 Distinguishes f1 only 2.18 ** 1.61 ** 0.57 sta_10 Distinguishes f1 only 1.87 ** 1.36 ** 0.51 sta_11 Distinguishes f1 only 1.94 ** 1.60 ** 0.35
sta_12 0.74 0.93 * 0.19
sta_13 Distinguishes f3 only 0.31 0.78 * 1.09 **
sta_14 Consensus 0.75 0.65 0.09
sta_15 Distinguishes all 1.00 * 1.40 ** 2.40 **
sta_16 Distinguishes f3 only 0.06 3.23 ** 3.17 **
sta_17 0.77 * 0.24 0.53
sta_18 Distinguishes f2 only 1.49 ** 0.22 1.27 **
sta_19 Distinguishes all 2.26 ** 0.96 * 1.30 **
sta_20 Consensus 0.32 0.19 0.51
sta_21 Distinguishes f3 only 0.57 2.09 ** 2.66 **
sta_22 0.72 0.38 1.10 **
sta_23 Distinguishes f2 only 1.23 ** 0.55 1.77 ** sta_24 Distinguishes f3 only 0.16 2.50 ** 2.35 **
sta_25 0.08 0.77 * 0.69
sta_26 Distinguishes f1 only 0.95 * 0.92 * 0.03
sta_27 1.39 ** 0.65 0.74
sta_28 Distinguishes f1 only 1.38 ** 1.97 ** 0.59
sta_29 0.32 0.54 0.86 *
sta_30 Distinguishes f2 only 2.36 ** 0.32 2.69 ** sta_31 Distinguishes f2 only 0.88 * 0.31 1.19 ** sta_32 Distinguishes f2 only 2.83 ** 0.32 2.51 ** sta_33 Distinguishes all 1.62 ** 1.87 ** 3.49 **
In the above example, the statements 3, 6, 8, 9, etc. (labelled"Distinguishes f1 only") distinguish factor one (f1) but do not distinguish f2 from f3. The statements 1, 7, 15, 19, and 33 (labelled "Distinguishes all") distinguish bothf1 from the other two and alsof2 fromf3: all factors think differently about these statements. Meanwhile, statements 14 and 20 are of consensus because none of their differences are significant at p-level= .05 (no stars appear in any of the"sig_*" columns). In addition, those statements with empty values under"dist.and.cons"need to be looked at individually (statements 12, 17, 22, 25, 27, and 29). For example, statements 12 and 25 distinguishf1 fromf3, but they do not distinguish either againstf2 (whose p-value is<.05 as indicated in column "sig_f1_f3", but none of the other comparisons are significant).
Validation
The package was validated with thelipsetdataset and with three other datasets, extracting 2, 3, 4 and 5 factors with each of them. The results ofqmethodwere contrasted with the results of analyses based on the same options but performed in PQMethod. For studies of 1 to 3 factors, all the numbers in factor loadings and z-scores match to the fourth decimal those given in PQMethod. For studies of 4 or more factors, all the numbers match to the second decimal. Occasional divergences in the third and fourth decimals of the loading values arise from the PCA algorithms themselves, which are coded externally to this package.7The factor scores match in all cases.
The selection of distinguishing statements matches exactly. A difference in the selection of consen-sus statements is due to a greater restrictiveness in this package. For inqmethod, the only statements identified as consensus are those in which none of the differences are significant at p-value<.05 7Four different R functions for principal components were compared with two datasets to test whether the method employed is the source of this divergence: prcomp(),princomp(), both from the base packagestats, principal()frompsych, andPCA()fromFactoMineR(Husson et al.,2014). The results show that loadings and z-scores obtained from these methods differ only after the 14th decimal.
(that is, only those statements which do not produce stars in any columns). PQMethod also indicates consensus statements with no significances at p-value<.05 with a star, but it further identifies as
consensusthose statements with some differences significant at a p-value between .01 and .05 (these statements have single stars in some of the comparisons, though no double stars). In PQMethod, therefore, the statements with differences significant at a p-value between .01 and .05 are shown both consensus and the distinguishing lists for some or all of the factors. For example in the above table, statements 12, 17, 25, 26, and 29 have no double stars but have one or more single stars; in PQMethod these would be included as bothdistinguishingandconsensusstatements. Such double labelling can be confusing in the interpretation. Whereas in this package the statements with differences signif-icant at a p-value between .05 and .01 are not labelled as consensus, but rather as"Distinguishes f*","Distinguishes all", or"", depending on each case. The role of each statement can be fully understood by inspecting the table of distinguishing and consensus statements.
The order of factors in the matrices (e. g., in the matrix of loadings) may differ between both tools in some cases. This is because in R, the components in PCA are ordered according to the explained variance of the rotated components. In PQMethod, the factors are ordered according to the explained variance of the unrotated factors instead. This discrepancy affects neither the numerical results nor the interpretation.
Summary and future work
Q is an effective methodology for understanding the diversity of perspectives across disciplines. qmethodis the first R package to analyse Q methodology data. This package produces tabulated results that are easy to examine and interpret, and ready for graphical representation or further numerical analysis. It provides a more concise output of distinguishing and consensus statements as well as a synthesising plot function. This core functionality is complemented by additional functions that import data from other Q software, summarise the results, and export the outputs in plain text for the interpretation in two flavours. Further usage details can be found in theqmethodreference manual available from CRAN. Potential developments for the current implementation include the introduction of centroid extraction as an alternative to PCA, manual rotation of factors, a graphical interface, functions for data collection, and a 3D plot method to explore the results further. Researchers who would like to contribute to these or other developments are welcome to contact the author.
Acknowledgements
During the development of this package, the author was funded by the Department of Research of the Basque Government. The author is grateful to Steven Brown and Peter Schmolck for making Q datasets publicly available and for allowing theLipsetdataset to be used in this R package; to Laurent Gatto for his advice in developing it; and to Ben Fried, two anonymous reviewers, and the editor for their useful comments on the manuscript.
Bibliography
J. Barry and J. Proops. Seeking sustainability discourses with Q methodology.Ecological Economics, 28 (3):337–345, 1999. [p163]
C. A. Bernaards and R. I. Jennrich. Gradient projection algorithms and software for arbitrary rotation criteria in factor analysis.Educational and Psychological Measurement, 65:676–696, 2005. [p165] S. Brodt, K. Klonsky, and L. Tourte. Farmer goals and management styles: Implications for advancing
biologically based agriculture.Agricultural Systems, 89(1):90–105, 2006. [p163]
S. R. Brown. Political Subjectivity: Applications of Q Methodology in Political Science. Yale Uni-versity Press, New Haven and London, 1980. URL
http://qmethod.org/papers/Brown-1980-PoliticalSubjectivity.pdf. [p163,164,165,167,168]
B. B. Davies and I. D. Hodge. Shifting environmental perspectives in agriculture: Repeated Q analysis and the stability of preference structures.Ecological Economics, 83:51–57, 2012. [p163]
T. C. Davis. Revisiting group attachment: Ethnic and national identity.Political Psychology, 20(1):25–47, 1999. [p163]
F. Husson, J. Josse, S. Le, and J. Mazet. FactoMineR: Multivariate Exploratory Data Analysis and Data Mining with R, 2014. URLhttp://CRAN.R-project.org/package=FactoMineR. R package version 1.27. [p171]
S. Lipset. The value patterns of democracy: A case study in comparative analysis.American Sociological Review, 28(4):515–531, 1963. [p168]
B. McKeown and D. Thomas.Q-Methodology. Sage Publications, London, 2013. [p164,165]
O. Petit dit Dariel, H. Wharrad, and R. Windle. Exploring the underlying factors influencing e-learning adoption in nurse education.Journal of Advanced Nursing, 69(6):1289–1300, 2013. [p163]
S. E. Ramlo. Q methodology and its position in the mixed-methods continuum.Operant Subjectivity, 34(3), 2011. [p164]
W. Revelle.psych: Procedures for Psychological, Psychometric, and Personality Research. Northwestern University, Evanston, Illinois, 2014. URLhttp://CRAN.R-project.org/package=psych. R package version 1.4.4. [p165]
C. Sandbrook, I. R. Scales, B. Vira, and W. M. Adams. Value plurality among conservation professionals.
Conservation Biology, 25(2):285–94, 2011. [p163]
P. Schmolck. PQMethod (version 2.35), 2014. URLhttp://schmolck.org/qmethod/. [p163]
D. G. Serfass and R. A. Sherman. A methodological note on ordered Q-Sort ratings.Journal of Research in Personality, 47(6):853–858, 2013. [p163]
P. Stenner, S. Watts, and M. Worrell. Q Methodology. In C. Willig and W. Stainton-Rogers, editors,The SAGE Handbook of Qualitative Research in Psychology, chapter 13, pages 215–239. Sage Publications, London, 2008. [p164]
W. Stephenson. Technique of factor analysis.Nature, 136:297, 1935. [p164]
W. Stephenson.The Study of Behavior; Q-Technique and its Methodology. University of Chicago Press, Chicago, 1953. [p164]
W. Stephenson.The Value Patterns of Democracy. University of Missouri, Columbia, 1970. [p168] M. Stricklin and R. Almeida. PCQ (version 1.4.1), 2004. URLhttp://www.pcqsoft.com/. [p163] C. Thompson, D. McCaughan, N. Cullum, T. A. Sheldon, A. Mulhall, and D. R. Thompson. The
accessibility of research-based knowledge for nurses in United Kingdom acute care settings.Journal of Advanced Nursing, 36(1):11–22, 2001. [p163]
N. J. A. van Exel and G. de Graaf.Q Methodology: A Sneak Preview. 2005. URLhttp://qmethod.org/
articles/vanExel.pdf. [p165]
N. J. A. van Exel, G. de Graaf, and P. Rietveld. “I can do perfectly well without a car!”.Transportation, 38:383–407, 2011. [p163]
S. Watts and P. Stenner. The subjective experience of partnership love: A Q methodological study.The British Journal of Social Psychology, 44(Pt 1):85–107, 2005. [p163]
S. Watts and P. Stenner. Doing Q Methodological Research: Theory, Method & Interpretation. Sage Publications Ltd, London, 2012. [p163,164,165]
A. Zabala.qmethod: An R Package to Analyse Q Method Data. University of Cambridge, Cambridge, UK, 2014. URLhttp://CRAN.R-project.org/package=qmethod. R package version 1.2.4. [p163] C. Zografos. Rurality discourses and the role of the social enterprise in regenerating rural Scotland.
Journal of Rural Studies, 23(1):38–51, 2007. [p163]
Aiora Zabala
Department of Land Economy University of Cambridge
19 Silver Street, Cambridge CB3 9EP UK