Visualization Using Flexible Displays
Jesus Caban
W. Brent Seales
University of Kentucky
Department of Computer Science
jesus, seales
@netlab.uky.edu
Abstract
The resolution, degree of complexity, and visual capabili-ties that users desire in order to meaningfully explore com-plex datasets pose an important technical challenge to re-searchers developing visualization technology. Although new visualization methods can be used within a traditional desktop environment, advances in multiple-view simulation and continued increases in the resolution, scale, and com-plexity of datasets themselves is now making the back-end display technology become a crucial informational bottle-neck.
This work focuses on how to build and deploy scalable display systems. These systems enable and encourage the development of visualization strategies that exploit high resolution, multiple data and user views, stereo cues, adaptive and non-homogeneous display resolutions, and rapid display configurability. With this enabling technology it becomes possible to more readily match the functional capabilities of the end-display to the requirements of the data and to the visualization strategy that most naturally supports the kind of analysis the users desire.
KEYWORDS: Visualization, Data Analysis, Computer Vi-sion
1
Introduction
Three primary elements on which visualization applications are based are data, tools to manipulate and transform the data, and a system that meaningfully renders the result. Ad-vances in the first two elements have continued to out-pace the capabilities of end-user display systems, and this paper discusses techniques for narrowing that gap. Our approach centers on scalable, projector-based display systems that are intended to enable meaningful and effective visualization in the face of current problems: large datasets that contain rela-tively subtle effects to be explored, requiring complex (com-putationally expensive) refinement transformations and flex-ible display configurations.
It is clear that data acquisition devices (scanners, sen-sors) and data simulation environments are producing raw data in unprecedented volumes. Likewise, computational environments and algorithms to refine, enhance, and trans-form this data have continued to advance.[11] These trends have heightened the mismatch between the massive scale and complex refinement of the data to be examined, and the capabilities of the devices that form the end-user envi-ronment. Display systems, for example, continue to support relatively low data resolutions and are inflexible in their con-figuration and operation. The motivation for this work is the desire to eliminate such constraints: resolution limits, con-figuration inflexibility, and the strong logical divide created at the framebuffer between the data and the display.
Visualization applications deal with device resolution limits by providing the user with the ability to control the data and refine the view. One common operation is drilling down through scale by zooming [9]. While this provides a way for the user to focus the available resources on the data of interest, it does not address the more fundamental mis-match between display resolution and data resolution.
We address this issue through a scalable projector-based system that can provide a space of resolution options based on a set of projectors that cooperatively render data. A pro-jector at its widest zoom setting (short focal length) yields fewer “pixels per inch” (ppi) on the display surface than one set to its narrowest zoom. Control of projector zoom alone can provide a way to vary the ppi of the display. When a display is built from many potentially overlapping projec-tors, the management of the geometric relationship between the projectors becomes complex. We show how the control of ppi via multi-projector display systems can be managed automatically and achieves resolution scalability.
Most visualization applications accept the inflexible na-ture of the display environment and search for ways to lessen their effect. This inflexibility normally leads either to expen-sive, monolithic, single-application systems, or to systems that simply cannot provide an adequate visualization expe-rience. We address this difficulty by building a flexible sys-tem from casually positioned projectors. Since the relative
geometry of member projectors is very loosely constrained, it allows a large number of configurations. Flat walls, com-pletely immersive rooms, high-resolution display on irreg-ular surfaces, and back-projected applications are all possi-ble with only the cost of mounting projectors and sensors in desired locations. By providing a much higher degree of flexibility, we enable visualization application developers to optimize the user’s display configuration in ways that were previously impossible.
The framebuffer as the interface between the data and the display environment does not directly support logical ab-stractions that may be desirable such as data layering and multi-view simulation. Applications that facilitate rapid and seamless switching between logical, functional, and spatial views of the data must collapse and composite these views at the level of the single, common framebuffer. This implies that the framebuffer itself as the abstraction can become an information bottleneck.
In fact it may be more desirable to extend the multi-layered abstraction beyond the framebuffer, all the way down to the display [15]. For example, rapid transitions between views, where each data view is a complex, dis-joint distillation of a large dataset, may be best accomplished more efficiently by dedicated devices, each with access to its particular relevant data. Using projection, the display sur-face itself becomes an optical framebuffer, where a number of multiple layers represented as separate framebuffers can be combined optically.
We show how we can support the partitioning of projec-tors into sets that can function together, each set assigned to manage a single logical framebuffer, with the sets together forming a number of framebuffers that combine optically into a single display. Stereo display, for example, can be implemented by assigning one projector set to the frame-buffer for the right eye, and a second set for the left eye. In the same way, framebuffers can be mapped to logical or functional data views, or can simply provide auxiliary detail available on command. We believe that support for a set of framebuffers assignable to projector sets can enable a num-ber of interesting visualization scenarios.
After a brief review of related research, the remainder of this paper addresses the techniques we have developed to enable display scalability, flexibility, and layered multi-ple framebuffers. The high-resolution visualization display system we discuss supports flexible, parallel, multi-layered, multi-form, and adaptive-resolution visualization. We be-lieve that by reducing or removing the display constraints of limited resolution, rigid inflexibility, and single-frame-buffer architecture, we can narrow the gap between large raw/refined datasets and the end-user display system.
2
Related Work
A primary purpose in building scalable and flexible displays is to facilitate new and emerging visualization techniques. There has been recent attention given to scalable, flexible displays from projectors [24, 14, 16, 19], with a few re-searchers addressing layered display [10, 15].
There are several unique points to emphasize about our work. First, we rely on commodity hardware to support applications that cannot afford the cost of more expensive hardware. Second, we emphasize flexibility by accommo-dating unknown display surfaces and arbitrary projector po-sitioning. Third, we support “as-is” OpenGL applications by leveraging the Chromium distributed rendering project [7]
By using a cluster of computers, we distribute the com-putational load of rendering to create a scalable system than fits the requirements demanded by particular visualization applications. Such display systems have become impor-tant for scientific visualization and industrial applications. Although top research laboratories can afford to invest in commercially available systems [2, 5, 6], such facilities are beyond the means of many groups. We believe that simi-lar systems can be deployed in research settings in a more cost-effective way and that this will be useful for display environments for visualization, data explorations and multi-dimension data simulators.
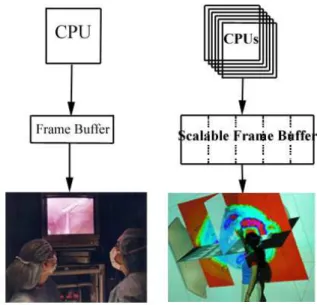
Figure 1: Driven by a cluster of computers for parallel simu-lation and rendering, high-resolution, complex data sets cre-ate an immersive experience.
Cluster computing requires distributed processing and rendering algorithms in order to distribute the data and pro-cess it in parallel (Figure 1). Rendering methods like
“sort-first” divide the display space into a number of regions, which can vary in size and shape. A portion of the display is assigned to each render process, which is responsible for rendering in parallel its portion of the display. The “sort-last” approach, also know as image composition, assigns a rendering process to perform both geometric processing and rasterization in a way that is independent of all other ren-dering processes. Local images rendered by the individual processes are composited together to form the final image. [13, 21, 20, 17]
In either of these cases, the array-of-projectors architec-ture allows side-by-side positioning to creating a scalable display. Since there are very few positioning constraints, the projector array can be positioned to completely over-lap other projectors to create a number of coincident layers on the display surface. Such configurations allow experi-mentation with visualization systems that support new ideas such as smoothly-blended high-resolution insets, continuous shadow removal in front projection displays, and 3D stereo graphics display systems. [10, 12]
With respect to visualization, most approaches accept the constraint of low spatial resolution. Given the limitations, there are efforts to pack more information into the available display real estate. For example, multi-dimensional func-tions, which are important in many applicafunc-tions, become challenging as the number of dimensions increases. One ap-proach to managing increased dimensionality is to display multiple, coordinated graphics at a coordinated time instant. Coordinated data views such as plots and reconstructions give a sense of how complex data are related as a function of time.
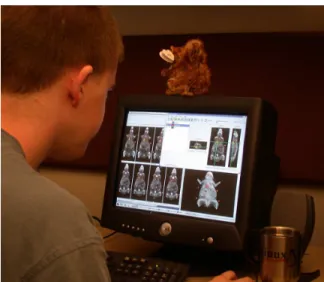
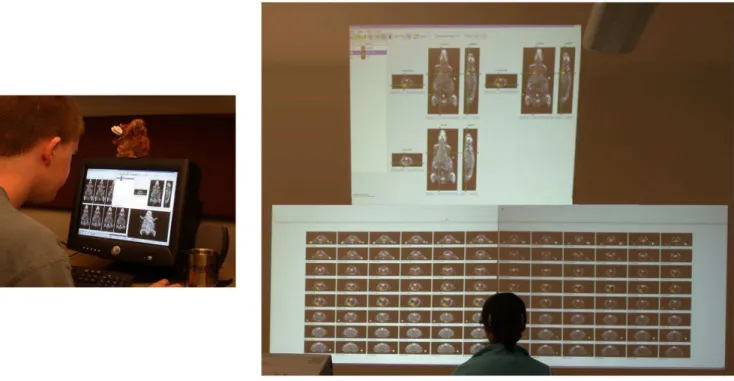
Such multiple window coordinations [18] offer a number of benefits, such as improved user performance over other exploration methods, discovery of unseen relationships, and unification of a desktop environment. The obvious problem is display real estate (Figure 2). As the number of dimen-sions and coordinated views increase, the number of inde-pendent windows grows. When the display cannot grow in resolution, multi-form and coordinated multiple-views data are severely limited.
Another important technique in data visualization is
multi-layered visualization. A multi-layered visualization
can be used in visualization and data exploration in sin-gle or multi-user collaboration display systems. In appli-cations such as virtual collaborative environment, people can display local and collaborative simulations simultane-ously. In collaborative multi-layered environments, the lay-ers have logical, dedicated semantics and are based on radi-cally different datasets. Furthermore, multi-layered display can be used to display stereo graphics and stereo visualiza-tion where two layers, one for each eye, create the impres-sion of 3D-stereo graphics. [1, 23]
Figure 2: The limited display real estate of an ordinary mon-itor is a serious impediment for a user interested in multi-views visualization software to study a microCT data set.
3
Implementation
Although large-scale, high-resolution displays may help solve issues for visualization of coordinated multiple-views simulators, it is challenging to build them. Issues of cost, flexibility, maintenance and setup all play a role in mak-ing use of the technology for visualization. Our approach is to build multi-projector display systems from commodity hardware (projectors, PCs, graphics cards). The support of a large number of projectors arranged in any geometric con-figuration leads to the scalability and flexibility we wish to provide.
We address the primary problems of flexible, scalable deployment and cost-effective use through a commodity-hardware-based design. We assume projectors are arranged in an tiled configuration, where several projectors are posi-tioned together to create a seamless display area. The reso-lution (pixels per inch) of the surface can vary by changing both individual projector settings (zoom and position rela-tive to the display surface) and collecrela-tive projector geome-tries.
Standard distributed rendering approaches makes it pos-sible to coordinate the operation of this projector set [24, 14]. We focus here on the primary issues of geometric and photometric correction, which we solve through a camera-based monitoring system. This system makes very few as-sumptions about the display surface shape and the projector locations. We address geometric and photometric correction here, and in section 4 we discuss how these solutions lead to new possibilities for visualization applications.
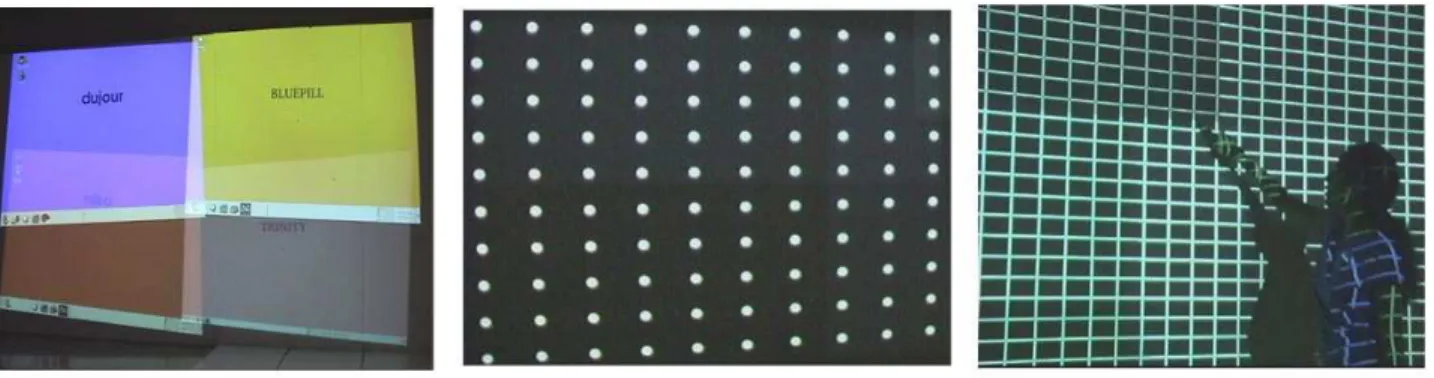
Figure 3: A high-resolution, tiled display system is built from a set of casually positioned projectors. Cameras automatically calculate a set of alignment transformations to create a seamless display area.
3.1
Geometric Correction
Tiled display systems face the physical alignment problem with the recognition that aligning the projectors manually is very challenging. It is possible to build systems through precise physical alignment. Although some of such sys-tems allow partial overlap, special care is always taken to ensure each projector generates an exact rectangular image that is easy to align with neighboring projectors in a tiled pattern.[2, 8]
It is difficult to achieve correct alignment, and it is rare to change the configuration once an alignment is obtained. Most often precise physical mounting devices and restricted geometric configurations are used to assist the alignment process. Even with these aids, vibration, weight, and lamp-changing all necessitate frequent re-calibration, which may lead to hours spent re-aligning the system.
Geometrically correct means that geometric primitives in the displayed imagery, such as lines, triangles, polygons and texture, appear correct to the viewer, regardless of the indi-vidual projector positions, their relative geometry, and the underlying display surface. In our display system we use a calibration method that works for any unknown smooth surface: planar or non-planar surfaces [16]. We project a number of fiducials onto the display surface from each pro-jector involved in the system. Each fiducial is detected in the camera, which we assume can see the entire display. When it is not possible to view the entire display region with a single camera, it is straightforward to employ multiple cam-eras with overlapping fields-of-view. In the image plane, fiducials form the vertices of a triangulated grid, which we use to define a (piecewise) warping function. This warping function defines how to transform the framebuffer of each projector, before display, such that the display will appear geometrically unified as a part of the complete projector set. We have implemented and deployed this system using cameras and projectors. The system automatically
calcu-lates the piecewise warp, and supports the calibration of a system projectors at a cost of approximately 12 seconds per projector. For example, we can modify and then calibrate a 5 projector system in about one minute. When each projec-tor is XGA resolution, a 5-projecprojec-tor display can display an image of about 5 mega-pixels.
Figure 3 shows camera-based calibration. The projec-tors are not physically aligned, but the alignment is dynami-cally calculated through displayed fiducials that are detected by the camera. After the piecewise warp has been calcu-lated based on the detected fiducials, we display a uniform grid across the entire display in order to demonstrate that the warp function is correct. This is the essence of the provision for flexibility: the camera-based system yields the flexibility by avoiding the need for physical alignment. The projected imagery is aligned through warping operations derived from the camera, which allows the user to deploy and experiment with a practical, flexible tiled display.
3.2
Photometric Correction
Since intensity varies among projectors, and since overlap regions are multiply-illuminated, there are areas in the dis-play that are noticeably brighter to the user. In order for the complete display to be seamless, we attenuate brightness in overlap areas so that the user has the impression of one con-tinuous display environment.
Our system addresses the photometric problem by calcu-lating a blending factor based on the geometry of overlap-ping projector regions. These overlapoverlap-ping areas are detected via the fiducials and the cameras. Once detected, the pro-jected brightness in overlapping areas is attenuated based on the number of projectors contributing to the display area. This method creates an efficient first-order approximation to the photometric issue that substantially supports the illusion that the user is viewing a single, continuous display.
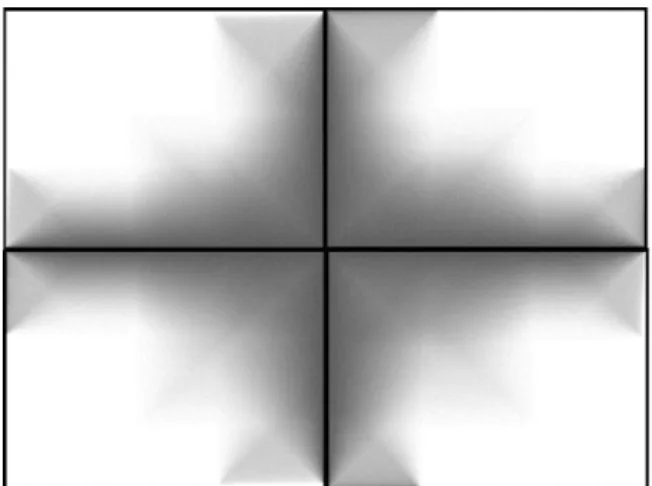
Figure 4: The geometrically aligned system is also photometrically blended via a set of alpha masks. The alpha masks are calculated based on the degree of projector overlap and serve as a photometric correction applied to each projector.
Figure 5: Alpha-blending images created for an array of 2x2 casually positioned projectors
With multiple, overlapping projectors, geometric warping corrects the structure but does not correct for brightness. The brighter areas are still noticeable even with correct geome-try warping (figure 4c), and that distracts the user. By using simple alpha blending (figure 5), with alpha values derived from the overlap structure detected in cameras, the display becomes structurally correct and photometrically blended (Figure 4d).
4
Support for Visualization
New display capabilities hold promise as an enabling tech-nology for advanced visualization systems designed to ex-ploit them. In particular, we anticipate in the following ar-eas:
Scalable, Adaptive Resolution:
Displays can function at lower and higher resolutions as required by an application. More projectors in various con-figurations gives a scalable and controllable way to improve
and experiment with issues in brightness, pixels-per-inch on the display surface, and trade-offs such as ppi vs. brightness. An interesting capability that is now practical, which has not been widely explored, is the usefulness of the adaptive dis-play.
Flexibility:
The display package we have implemented solves the ge-ometric and photge-ometric problems together with software for distributed rendering [7, 4]. This making possible the rapid deployment of a flexible high-resolution display sys-tem. We have demonstrated this system for on-the-spot demonstrations, collaborative efforts, visualization centers and individual use (offices and small labs).
We can use the system to create, for example, a portable visualization display, or coordinated multiple-view simula-tor, which can be set up and calibrated in very short or-der because of the camera-based solution to the geometric and photometric problems that removes the need for careful physical alignment. The required hardware does not involve anything other than PCs, graphics cards, a computer network and projectors. Clearly the projectors are the crucial high-dollar component, although we can operate with almost any model and can scale the system from a few to as many as is currently practical on a local area network (12-16). Note that a 16-projector system where each projector is capable of a pixel of display resolution leads to a 16 Mega-pixel display device, which is well beyond the foreseeable capability of the desktop monitor. The flexible calibration of the system allows the projectors to be arranged as desired so that a number of configurations can be used depending on the application.
Layering
The flexible positioning that our techniques support provides an interesting environment in which to experi-ment with multiple-layered and multiple-views visualization problems. The multi-layered system follows directly from the tiled-projector algorithms, and can be exploited to sup-port dedicated, high-resolution insets, real-time video
over-Figure 6: A “multi-views” visualization application has an advantage when more display real estate is readily available.
lays [22], and even polarized stereo graphics [3, 1]. For example, we have demonstrated a stereo system where one layer of the display maps the the right-eye framebuffer, and another layer maps to the left-eye framebuffer.
5
Conclusion
One of the primary purposes of building new display sys-tems must be to enable continued development of emerging visualization techniques. We have presented techniques for building scalable, flexible displays from component com-modity projectors that work toward removing constraints that hinder visualization. In particular, we address the ques-tion of how to support higher display resoluques-tion, flexible dis-play configuration, and multi-layered applications. These display characteristics can enable users to meaningfully ex-plore complex datasets, and encourage the development of visualization strategies that exploit high resolution, multi-ple data and user views, stereo cues, adaptive and non-homogeneous display resolutions, and rapid display recon-figurability.
We believe that this kind of enabling technology is crucial for systems to more readily match the functional capabilities of the end-display to the requirements of the data and to the visualization strategy that most naturally supports the kind of analysis the users desire.
References
[1] AGAVE (Access Grid Autostereo Virtual Environment). In
http://www.evl.uic.edu/cavern/agave/.
[2] Barco. In http://www.barco.com.
[3] Cyviz - A new dimension to 3D technology. In
http://www.cyviz.com.
[4] Distributed Multihead X. In http://dmx.sourceforge.net. [5] Fakespace Systems. In http://www.fakespacesystems.com. [6] TeraRecon Inc. In http://www.terarecon.com.
[7] The Chromium Software Project. In
http://chromium.sourceforge.net.
[8] VisionMax International Ltd. In
http://www.visionmaxint.com.
[9] Staffan Bjork. Hierarchical flip zooming: enabling parallel exploration of hierarchical visualizations. In Proceedings of
the Working Conference on Advanced Visual Interfaces, May
2000.
[10] M. Steele M. Brown C. Jaynes, S. Webb and B. Seales. Dy-namic Shadow Removal from Front-Projection Displays. In
IEEE Visualization, 2001.
[11] Jeffrey Abell Robert J. Schreiber Deidra L. Donald, Nick An-dreou. The new design: the changing role of industrial en-gineers in the design process through the use of simulation. In Proceedings of the 31st conference on Winter simulation, 1999.
[12] Tom van der Schaaf Desmond M.Germans, Hans.J.W.Spoelder and Henri E. Bal. Realizing a Stereo Tiled Display Using Commodity Components. In ASCI, 2003.
[13] Ren Ng Randall Frank Sean Ahern Peter D. Kirchner James T. Klosowski Greg Humphreys, Mike Houston. Chromium: A Stream-Processing Framework for Interactive Rendering on Clusters. In SIGGRAPH, 2002.
[14] Anoop Gupta Kai Li Thomas Funkhouser Han Chen, Grant Wallace and Perry Cook. Experiences with Scalability of Display Walls. In Seventh Annual Immersive Projection
Technology Symposium, March 2002.
[15] Aditi Majumder and Greg Welch. Computer Graphics Op-tique: Optical Superposition of Projected Computer Graph-ics. In Fifth Immersive Projection Technology Workshop, in
conjunction with the Seventh Eurographics Workshop on Vir-tual Environments, May 2001.
[16] W. Brent Seales Michael S. Brown. Incorporating Geomet-ric Registration with PC-Cluster Rendering for Flexible Tiled Display. In International Journal of Image and Graphics (To
appear), 2003.
[17] Carl Mueller. The sort-first rendering architecture for high-performance graphics. In Proceedings of the 1995 symposium
on Interactive 3D graphics, 1995.
[18] C. North and B. Shneiderman. A Taxonomy of Multiple Win-dow Coordinations. In Technical Report CS-TR-3854
Univer-sity of Meryland, Computer Science, 1997.
[19] R. Yang W. Chen H. Towles B. Seales R. Raskar, M. Brown and H. Fuchs. Multi projector displays using camera based registration. In Proceedings of IEEE Visualization, pages 161–168, 1999.
[20] Kai Li Rudrajit Samanta, Thomas Funkhouser. Sort-last par-allel rendering: Parpar-allel rendering with k-way replication. In
Proceedings of the IEEE 2001 symposium on parallel and large-data visualization and graphics, 2001.
[21] Kai Li Jaswinder Pal Singh Rudrajit Samanta, Thomas Funkhouser. Hybrid Sort-First and Sort-Last Parallel Rendering with a Cluster of PCs. In
SIG-GRAPH/Eurographics Workshop on Graphics Hardware,
August 2000.
[22] Brent Seales and Jesus Caban. Visualization Trends: Appli-cation in Laparoscopy. In Seminars in Laparoscopic Surgery
(to appear), 2003.
[23] Paul J. Croft Duanjun Lu Sean Ziegeler, Robert J. Moorhead. The MetVR Case Study: Meteorological Visualization in an Immersive Virtual Environment. In 12th IEEE Visualization
2001 Conference, 2001.
[24] David Gotz Justin Hensley Herman Towles Yang, Ruigang and Mike Brown. PixelFlex: A Reconfigurable Multi-Projector Display System. In IEEE Visualization 2001, Octo-ber 2001.