Detection of Unknown Cyber Attacks Using
Convolution Kernels Over Attributed Language
Models
Kumulative Dissertation
zur
Erlangung des Doktorgrades (Dr. rer. nat.)
der
Mathematisch-Naturwissenschaftlichen Fakultät
der
Rheinischen Friedrich-Wilhelms-Universität Bonn
von
Patrick Duessel
aus
Dieser Forschungsbericht wurde als Dissertation von der Mathematisch-Naturwissenschaftlichen Fakultät der Universität Bonn angenommen und ist auf dem Hochschulschriftenserver der ULB Bonn
http://hss.ulb.uni-bonn.de/diss_onlineelektronisch publiziert.
1. Gutachter: Prof. Dr. Michael Meier 2. Gutachter: Prof. Dr. Sven Dietrich Tag der Promotion: 2. Juli 2018
Acknowledgements
I would like to express my gratitude to my supervisor Prof. Dr. Michael Meier for continuous support and advise throughout my dissertation journey. I would also like to thank Prof. Dr. Sven Dietrich for providing direction to my thesis as co-referent. Furthermore, I would like to thank Prof. Dr. Klaus-Robert Mueller for his scientific inspiration and his support to foster my interest for research and development in the field of machine learning and network security during the first years of my studies.
I would also like to express my gratitude to all my colleagues at the Fraunhofer Institute, Berlin Institute of Technology as well as University of Bonn for fruitful discussions as well as an interactive and collaborative working atmosphere. I would like to thank my friends and colleagues Christian Gehl, Dr. Ulrich Flegel and Dr. Alexandra James for great moments shared and their personal support. Finally, I would like to express my love and gratitude to my family for their persistent moral support and for everything they have done for me.
Contents
1 Introduction 1
1.1 Known and unknown threats . . . 2
1.2 Machine learning to detect unknown threats . . . 4
1.3 Data representations for sequential data . . . 9
1.4 Measuring similarity in feature spaces . . . 13
1.5 Thesis outline . . . 17
Bibliography 19 2 Learning intrusion detection: supervised or unsupervised? 27 2.1 Introduction . . . 27
2.2 Publication . . . 27
2.3 Summary . . . 36
3 Cyber-Critical Infrastructure Protection Using Real-Time Payload-Based Anomaly Detection 37 3.1 Introduction . . . 37
3.2 Publication . . . 37
3.3 Summary . . . 50
4 Automatic feature selection for anomaly detection 51 4.1 Introduction . . . 51
4.2 Publication . . . 51
4.3 Summary . . . 58
5 Incorporation of Application Layer Protocol Syntax into Anomaly Detection 59 5.1 Introduction . . . 59
5.2 Publication . . . 59
5.3 Summary . . . 75
6 Detecting zero-day attacks using context-aware anomaly detection at the
7.3 Summary . . . 118 8 Conclusions 119 List of Figures 123 List of Tables 125 Acronyms 127 viii
C H A P T E R
1
Introduction
Information Technology (IT)plays a crucial role in modern society. Over the past decade the Internet has emerged as a key communication platform for businesses and private users demonstrated by an exponential increase not only of hosts connected to the Internet but also Internet users. While in 2007 561.6 Million hosts were advertised in theDomain Name System (DNS)1, the number of hosts has almost doubled to 1.062 Billion2over the past 10 years [1]. In addition, with the ongoing adoption ofInternet of Things (IoT)as key technology enabler for advanced infrastructure concepts such as smart cities, smart grids, virtual power plants, or intelligent transportation systems (e.g. connected cars), the number of hosts connected to the Internet is expected to increase exponentially to 30 Billion devices by 2020 [2]. With an increase of hosts on the Internet, the number of Internet users has also increased dramatically over the past decade. While in 2007 20% of the world’s population (1,319 Billion) utilized the Internet, the number of Internet users in 2017 has more than doubled to 3,885 Billion users (approx. 52% of the world’s population [3]).
Considering the pervasiveness of today’sITorganizations become increasingly exposed – predomin-antly driven by threat likelihood and vulnerability level of the organization. On the one hand, the number of reported security incidents world-wide has increased tremendously at a compound annual growth rate of approx. 60% between 2009 (3.4 Million incidents) and 2015 (59 Million incidents) [4]. One reason for the tremendous growth of computer and network attacks is an increase of attack automation and attack sophistication [5]. While in earlier days computer attacks had to be crafted manually and were aimed at specific targets, today complex malware tool kits are readily available to infiltrate a network, persistently deploy on target hosts, selectively propagate across the network and perform a wide range of actions ranging from sensitive data ex-filtration to distributed denial of service attacks [6]. A common concept to mount sophisticated and large-scale attacks areBotnetsin which hosts are infected by malware to receive commands from aCommand & Control (C2)server to execute malicious payload [7]. For example, the self-propagating wormMiraiinfected over 600.000IoTdevices (mostly cameras and routers). Infected devices were controlled by so called C2servers to mount the largest distributed denial of service attack on record with more than oneTerabits per second (Tbps)at its peak causing temporary but significant connectivity issues for Internet users.
Chapter 1 Introduction
combined with fast-paced software development life cycles can be considered major factors that drive an organization’s vulnerability level [9].
The following sections will provide an overview of challenges in the fields of computer and network security – specifically related to the detection of network-based computer attacks and host-based malware attacks – and furthermore introduce a machine learning-based approach to overcome these challenges.
1.1 Known and unknown threats
One of today’s key challenges is the detection of unknown threats. The majority of the state-of-the-art security controls deployed in organizations are reactive in nature and predominantly based on known attack signatures. Although those safeguards demonstrate high detection accuracy for known attack patterns, drawbacks include their inability to reliably detect not only unknown but also modified versions of known threats. For example, in the context of targeted attacks by adversaries with advanced capabilities (e.g. state-sponsored attackers), computer and network attacks have become increasingly sophisticated. Obfuscation techniques such as polymorphism, metamorphism, armoring or simply using "living-off -the-land" functionality (i.e. file-less malware) are specifically designed to thwart existing countermeasures and enable undetected delivery and execution of malicious code [e.g.10,11].
The problem of unknown threat detection is known in many different areas in computer and network security. Network attacks and malware are among the most common threat vectors [12] and thus, are focal point of this dissertation.
Network attacks. Extensive research has been conducted to develop methods and systems for the detection of computer and network attacks. A computer attack refers to an attempt to compromise confidentiality, availability or integrity of a computing resource. AnIntrusion Detection System (IDS) captures and analyzes streams of data in networks or on hosts to detect computer attacks. The conceptual design of intrusion detection systems goes back to the work of Denning [13] which serves as a foundation for numerous state-of-the-art intrusion detection systems nowadays [e.g.14,15]. An overview of existing intrusion detection approaches is provided by the work of McHugh [5]. Intrusion detection techniques can be broadly classified into misuse detection and anomaly detection [16]. While misuse detection methods are intended to recognize known attack patterns, anomaly detection techniques aim at identifying unusual structural or activity patterns in observed data. A well-known drawback of misuse detection systems is their inability to detect "unknown" attacks due to their reliance on pre-defined policies or attack signatures. Thus, significant research has been conducted on anomaly-based detection methods [e.g.
17–19]. However, the majority of these methods focuses on spotting computer and network attacks exploiting network protocol header vulnerabilities such asTeardrop,LandorPing of Death[20].
Nowadays, the vast majority of network attacks is carried out at the application layer exploiting vulnerabilities in applications or third party software components by leveraging standard network protocols to deliver malicious exploit payload. Driven by the growing automation of vulnerability research and exploit development tools and techniques [e.g.21,22], exploit development cycles become increasingly shorter, leading to faster production and proliferation of commercial-grade software exploits. Azero-dayvulnerability refers to a software or hardware flaw that is unknown to the security community and no fix or patch is available [23]. A zero-day attack refers to an attack exploiting a zero-day vulnerability whereas the time between discovery of the vulnerability and its exploitation is less than a day. For example, a recent attack launched against a major U.S. credit bureau showed how quickly a
zero-dayvulnerability can be exploited [24]. In that particular example, an exploit was developed and executed against a server containing an unfixed vulnerability (CVE-2017-5638 [25]) within less than 24
1.1 Known and unknown threats
hours. The example below shows a Hyper-Text Transfer Protocol (HTTP)[26] request carrying malicious payload to exploit the aforementioned vulnerability residing in the Jakarta-based file upload multi-part parser of theApache Struts 2web application framework [27] installed on one of the servers. In the vulnerable version (i.e. 2.3.2 or lower), incorrect exception handling and error message generation during file upload allow for arbitrary remote code execution via command injection in theContent-Typefield of theHTTPrequest. In the example below, the current directory of the server is read out (i.e.#cmd=´dir´)
and returned as output in theHTTPresponse. More sophisticated variants of that exploit have surfaced which include reconfiguration of security settings or utilization of persistency mechanisms [28].
GET / HTTP/1.1 Host: 192.168.126.128:80 User-Agent: Mozilla/5.0 Accept-Encoding: identity Content-Type: %{(#_=’multipart/form-data’).(#dm=@ognl. OgnlContext@DEFAULT_MEMBER_ACCESS).(#_memberAccess?(#_memberAccess=#dm):((# container=#context[’com.opensymphony.xwork2.ActionContext.container’]).(#ognlUtil =#container.getInstance(@com.opensymphony.xwork2.ognl.OgnlUtil@class)).(#ognlUtil. getExcludedPackageNames().clear()).(#ognlUtil.getExcludedClasses().clear()).(# context.setMemberAccess(#dm)))).(#cmd=’dir’).(#iswin=(@java.lang. System@getProperty(’os.name’).toLowerCase().contains(’win’))).(#cmds=(#iswin?{’cmd .exe’,’/c’,#cmd}:{’/bin/bash’,’-c’,#cmd})).(#p=new java.lang.ProcessBuilder(#cmds) ).(#p.redirectErrorStream(true)).(#process=#p.start()).(#ros=(@org.apache.struts2. ServletActionContext@getResponse().getOutputStream())).(@org.apache.commons.io. IOUtils@copy(#process.getInputStream(),#ros)).(#ros.flush())} Connection: close
Listing 1.1: MaliciousHTTPrequest exploiting vulnerability in the Apache Struts framework (CVE-2017-5638)
Although theHTTPrequest shows distinctive characteristics of malicious or at least suspicious payload (i.e. HTTP Content-Type parameter value), exploit authors can leverage various techniques (e.g. utilization of different character encodings, encryption etc.) to obfuscate the malicious payload, rendering traditional misuse detection ineffective to detect malicious payload delivered over application-level network protocols.
Advanced malware. The continuous proliferation of increasingly sophisticated malware poses a significant threat to organizations. Malware detection methods can be broadly categorized intostatic
anddynamicanalysis. While static analysis refers to the decompilation and analysis of structure, flow and data residing within the malicious binary at compile time [e.g.29–32], dynamic analysis aims at profiling activity of malware binaries at run time [e.g.33–37]. A major drawback of existing methods is its reliance on malware signatures resulting in limited ability to detect unknown malware or variants of known malware. This is reflected in detection accuracies between 18 to 70% – demonstrating a large variance between operating systems [38].
Chapter 1 Introduction
the victim’s machine (e.g. via phishing orDNShijacking) to establish persistency and consequently execute malicious payload obtained from aC2server. Obfuscation is another technique used by malware authors to hide malicious characteristics of malware. Techniques such asoligomorphism,polymorphism
or metamorphism aim at changing the representation (e.g. function call obfuscation, control flow obfuscation behavior) of malicious code while maintaining its functionality [e.g.40].
IoTis as an example for growing sophistication and complexity of malware. The number of malware-enabled attacks onIoT devices has significantly increased by approx. 600% in 2017 (6.000 attacks in 2016). The most commonIoT malware families observed in 2017 were Linux.Lightaidra, Tro-jan.Gen.NPEandLinux.Mirai[41]. For example, the self-propagating multi-stage malwareMiraiwas developed to execute denial-of-service attacks by compromising IoTand infrastructure devices and performing application-level (e.g.HTTP) or network-level flooding over Generic Routing Encapsulation (GRE),Transmission Control Protocol (TCP), orUser Datagram Protocol (UDP).Miraiworks by first installing a loader on the victim’s host which creates a multi-threaded server. Miraithen scans its environment for open telnet ports to propagate itself to hosts by brute-forcing telnet passwords based on a dictionary. Subsequently, the loader is executed which connects the host to aC2server to download and execute architecture specific payload. AlthoughMiraidoes not show persistency mechanisms, the malware provides basic defense functionality such as process termination. Basic obfuscation techniques are performed to cover malicious activity including deletion of downloaded binaries and process name obfuscation. Another example of more sophisticated utilization of obfuscation techniques is ransomware. The wide-spread distribution of malware instances (e.g. WannaCry, Petya, NotPetya, BadRabbit) in 2017 suggests an increased utilization of obfuscation techniques. While the number of new ransomware families has decreased by 63% from 98 families in 2016 to 28 families in 2017, the number of new ransomware variants have increased by 46% from 241.000 to 350.000 indicating a lack of new threat actor groups and less innovation on the one hand but mutation and customization of existing ransomware through obfuscation techniques on the other [41].
1.2 Machine learning to detect unknown threats
For organizations a multitude of technical safeguards is available to detect and prevent cyber threats. Concepts can be broadly categorized into misuse detection and anomaly detection. While misuse detection methods are intended to recognize known attack patterns described by rules, anomaly detection focuses on detecting unusual activity patterns in the observed data [e.g.17,18,42].
The majority of state-of-the-art methods can be classified as misuse detection due to their reliance on rule sets. Rule-based solutions can be further divided into blacklist- and whitelist-based approaches. Blacklist-based methods can be further refined into signature-based and heuristic-based approaches. While signature-based approaches allow to detect threats based on specific threat patterns (e.g. malicious byte sequences), heuristic methods allow for the detection of unknown threats based on an expert-based probabilistic rule sets that describe malicious indicators. Although heuristic approaches often complement signature-based solutions, a major drawback is their susceptibility to high false positive rates. Finally, white-list based approaches usually include policies which allow for the detection of threats based on the deviation from a pre-defined negative baseline configuration (e.g. IP whitelists). An overview of state-of-the art misuse and anomaly-based detection methods is provided by the work of Modi [43] and Mitchell [44].
To overcome challenges with existing approaches (i.e. limited ability to detect unknown threats by signature-based methods and lack of detection accuracy by behavior-based methods), interest has grown in the security community to utilize machine learning as an alternative and more accurate approach to
1.2 Machine learning to detect unknown threats
existing methods for the detection of unknown threats or variants of known threats [e.g.45–52]. Machine learning provides methods to automatically infer generalized data models based on patterns identified in data. Significant research has been conducted on theory and methods for machine learning over the past decades [e.g. 53–56]. An overview of learning techniques is provided by the work of Duda [57] and Hastie [58] whereas kernel-based learning is more specifically discussed by Mueller [59] and Smola [60].
Generally, machine learning is concerned with solving an optimization problem to find a function ˆfθwith parametersθthat minimizes the expected riskR(f) (test error):
ˆ
f =argmin
f∈H
R(f)+ Ω(f), (1.1)
whereas f : X 7→ Rrefers to a predictor that learns a real-value mapping of a set ofn-dimensional data points X = {x1,x2,xi, ...,xm| xi ∈ Rn} to an output variable ˆy ∈ R. The risk function R(f) = R
L(f(x), y)dP(x, y) is defined as the expectation of the loss functionL(f(x), y) that penalizes incorrect prediction of ˆy = f(x) based on the ground truth mappingy. The most common loss function for classification and anomaly detection is thesquared lossL(f(x), y)=(f(x)−y)2[59,61].
Unfortunately, the expected riskR(f) cannot be calculated as the underlying joint probability distribution
P(x, y) is unknown. However, as an approximation, the empirical risk Remp(f) = 1nPni=1L(f(xi), yi)
(training error) can be calculated as the average loss over a sample of training points for a function in function setH. Unfortunately, minimization of the empirical risk is not sufficient to obtain a function which accurately predicts on unseen data instances. Structural risk minimization, originally introduced by Vapnik [62], provides a framework that puts expected risk and empirical risk into a relationship. The framework provides an upper bound for the expected riskR(f)≤Remp(f)+C(f, ...) using the empirical riskRemp(f) and the capacity termCof the function class of the predictor f. Intuitively, the capacity term reflects model complexity. While predictors with linear decision surface have low capacity, non-linear functions demonstrate high capacity.
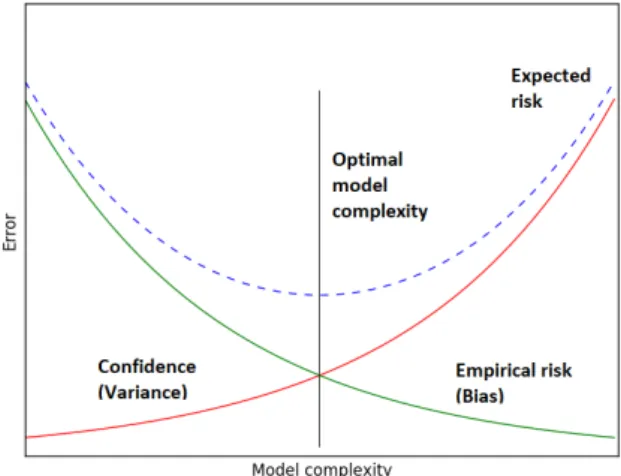
The accuracy of a predictor is largely determined by two types of errors: biasand variance. While the bias error takes into account the deviation of the expected prediction of a model to the true target values, the variance error takes into account the variability of the prediction based on training of a specific function over different training sets. While high capacity function (e.g. non-parametric or non-linear functions) have low bias but high variance (risk of overfitting), low capacity functions (e.g. parametric or linear functions) tend to have high bias but low variance (risk of underfitting). The overall objective is to learn a function with low bias and low variance, i.e. a function with low training error but also generalizes on unseen data. This relationship is commonly known in machine learning as thebias-variance dilemma. Mathematically, the total errorE(x) (i.e. expected risk) can be decomposed into bias error, variance error and irreducible error [58,62]:
Chapter 1 Introduction
Figure 1.1: Bias-variance trade-off
this end, the minimization problem is extended by a regularization termΩ(f)=CPni=0ξi to penalize
function complexity in favor for wrongful prediction for data pointsxithrough so called slack variablesξi
which allow misclassification for the benefit of learning function with lower complexity. The parameter
C controls the bias-variance trade-off, yieldingC = 0 for low bias and high variance. An increase ofC results in increasing bias and decreasing variance. A suitableC value can be obtained through cross-validation.
Given the overwhelming amount of machine learning methods available, the choice of the right method for the problem at hand depends on its properties. An introduction to various supervised and unsupervised machine learning methods is provided in Chapter2. Optimization and regularization are two major components for learning accurate data models. Optimization methods can be broadly categorized into iterative and non-iterative methods. In machine learning, gradient-based methods are commonly used for iterative optimization as for example implemented inMulti-layer Perceptron (MLP)networks [63]. Convex optimization is commonly used in non-iterative approaches and is based onlinearorquadratic programming. While iterative methods provide fast convergence, the solution may not converge towards the global minimum. On the other hand, convex optimization allows for convergence to a global minimum but requires objective functions to be convex. Support Vector Machines provide both global optimization as well as regularization [59]. Both properties are described in more detail for the One-class Support Vector Machine (OC-SVM)in Chapter6. The following paragraphs outline machine learning approaches relevant for the detection of known and unknown threats based on Support Vector Machines for supervised and unsupervised learning.
Supervised learning. In supervised learning a function is trained based on labeled training data whereas each instance of the training data is a tuple consisting of data point xi represented by its feature space representationφ(xi) alongside an output valueyi(e.g. class label). A supervised algorithm
constructs a separating hyperplane between two or more classes based on geometric relationships between data points considering their class labels. In this thesis aSupport Vector Machine (SVM)is used for classification tasks. In a binary classification scenario, theSVMdetermines an optimal hyperplane that separates data points from two different classes with maximal margin. Mathematically, this can be
1.2 Machine learning to detect unknown threats
formulated as a quadratic programming optimization problem in its primal form [60]: min w,b,ξ 1 2||w|| 2 +C n X i=1 ξi subject to: yi(hw, φ(xi)i+b)≤1−ξi, ξi ≥0. (1.3)
Sincewlies in the feature spaceF (which can have much higher dimensionality than the input space), it cannot be solved directly. By converting the primal form of the problem in1.3into its dual form, the optimization problem can be formulated in terms of inner products between data points mapped in the feature space [59].
A binary classification example is depicted in Fig1.2. In this example, a hyperplane is learned by a two-class SVMusing a linear kernel. The margin between data points of two classes is determined by two hyperplanes H1 :hw, φ(xi)i+b ≥ 1 for allyi =1 andH2 :hw, φ(xi)i+b≤ −1 for allyi =−1
respectively. An optimal hyperplane represented as the median between the two hyperplanesH1and
H2separates instances from two different classes (i.e. red and blue data points) such that the distance between the hyperplane and the nearest data points from both classes is maximal. Data points on the margin are called support vectors (circled data points) which specify the decision function. The termC
in the example denotes a regularization constant which controls the trade-offbetween margin width and permissible misclassifications in the case of non-separable problems. While large values ofCresult in smaller margin solutions with less misclassified data points allowed, smaller values ofCwill increase the margin and allow more misclassifications.
Chapter 1 Introduction
based on the assumption that the vast majority of training data is drawn from the same distribution. Outliers are detected as a deviation from a model of normality. In this thesis aOC-SVM[61] is used as a means of novelty detection. TheOC-SVMfits a minimal enclosing hypersphere to the data that is characterized by a centerθand a radius R. Mathematically, this can be formulated as a quadratic programming optimization problem:
min R∈R ξ∈Rn R2+C n X i=1 ξi subject to: ||φ(xi)−θ||2≤R2+ξi, ξi≥0. (1.4)
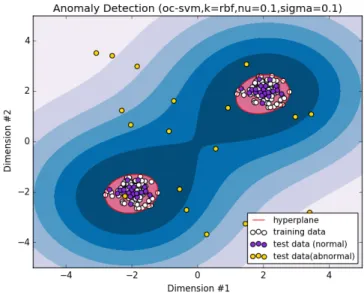
Given the constraint in Eq.(1.4), minimizingR2will minimize the volume of the hypersphere. A novelty detection example is depicted in Fig1.3. In this example, a hypersphere is learned that separates outliers from the majority population considered normal using aOC-SVMand aRadial Basis Function (RBF) kernel as similarity measure. In the example below, underlying data is bimodal and thus, has two centers of mass. By using a non-linear kernel function (e.g. RBF), the separating hypersphere is fitted to the shape of the underlying distribution without overfitting. The parameterσ(sigma) defines the width of theRBFand determines the influence of support vectors to the decision function. While a smallσresults in a sharp decision function, a largeσincreases smoothness of the decision function towards a linear decision surface. The parameterν(nu) in the example below represents a regularization to constant similar toC in Eq.1.4to balance the bias-variance trade-off[60]. While a largeνvalue implies low regularization allowing more samples to be outliers at the benefit of learning a lower complex decision function, a smallerνvalue results in strong regularization allowing less samples to be outliers.
Figure 1.3: Example of unsupervised learning (One-class Support Vector Machine)
1.3 Data representations for sequential data
Semi-supervised learning. Semi-supervised learning is a class of supervised learning techniques that can make use of unlabeled data for training [65]. The objective is to infer correct labels for unlabeled data points based on the assumption that data points close to each other (continuity assumption) and data points located in the same region in the feature space (cluster assumption) are more likely to share the same labels. Goernitz et al. [51] investigate semi-supervised learning in the context of unknown attack detection and further propose an active learning strategy to select unlabeled candidates for labeling to improve the detection accuracy of the predictor. While semi-supervised learning approaches provide benefits in terms of trade-off between improvement of accuracy by labeling a subset of data, these methods are not included in the scope of this dissertation.
1.3 Data representations for sequential data
Machine learning methods usually operate on vector data. However, in computer and network security, sequential data is oftentimes found. Feature engineering is concerned with the construction of features that describe key characteristics of the underlying data. By using a generic feature mapφ:X 7→RNdata points can be represented in aN-dimensional vector spaceRN
induced by a set of domain-descriptive features.
x7→φ(x)=(φ1(x), φ2(x), φ3(x), ..., φN(x)), 1≤ N≤ ∞. (1.5)
By utilizing data representations, sequential data can be embedded into a feature space in which a decision function is learned based on geometric relationships between data representations of individual sequences. Good data representations comprise non-redundant features which are discriminative to the problem at hand. Oftentimes, the complexity of the data domain causes the volume of the feature space to increase exponentially resulting in sparsely populated regions in the feature space [66]. High dimensionality of input feature vectors exacerbates the learning process, particularly if discriminative information resides in manifolds of the feature space (i.e. if the true function only depends on a small number of features) which may result in high variance of the predictor. Thus, a good data representation allows for efficient storage and processing of features. The following paragraphs provide an overview of data representations that can be used for classification and anomaly detection in the field of computer and network security.
Sequential data representation. A substantial amount of work has been done in developing efficient data structures for the comparison of sequential data such as suffix tries, suffix trees or suffix array [e.g.
67–69]. Suffix tries are space-efficient and allow for comparison of sequences in linear time. However, due to the explicit representation of common path inner nodes in the suffix trie, the practical utilization of this type of data structure is limited to comparably small sequences. A suffix tree is a compressed trie containing all the suffixes of the given text as their keys and positions in the text as their values by merging common paths to a single node. A suffix tree can be constructed in linear time and also allows for linear time comparison of sequences [e.g.69]. Due to the implicit representation of common paths, suffix tree are more suitable to store and process large sequences - as typically found in network packet
Chapter 1 Introduction v0 v7 v4 v6 v5 abc$ c$ v1 v3 v2 abc$ c$ ab b c$
Figure 1.4: Suffix tree to represent byte sequences ("ababc$")
More formally, consider an alphabet to be a finite set of symbolsΣ. In network and computer security the alphabetΣ = {0, ...,255}usually correspondes to byte values. LetΣ∗denote the set of all possible concatenation ofΣand the set of all possible concatenation of lengthkto beΣk. Thek-spectrum of a symbol sequence refers to the set of of all contiguous unique subseqencesuof lengthkgenerated by an alphabetΣ. Hence, a mapping functionφcan be define which maps fixed length substringsucontained in stringsinto a feature spaceF:
φ:s7−→(φu(s))u∈Σk ∈ F. (1.6)
The mapping functionφu(s) allows to map a subsequenceucontained insto a binary, count or relative
frequency value. A binary mapping function sets the value of a mapped subsequenceuto one ifuis contained at least once ins. A count mapping function sets the value of the mapped subsequenceu
tomifuis containedmtimes ins. Finally, a frequency mapping function sets the value of a mapped subsequenceuto n−mk+1 whereasmdenotes the number of timesuis contained insandnrefers to the length of strings.
It is noteworthy, that by traversing a suffix tree, other types of features can be extracted as well, such as
bag-of-wordsorall-subsequencesfeatures [67].
Syntactic data representation. Network protocol messaging follows a defined context-free grammar. As attacks are commonly delivered at the application-layer, network protocol syntax may carry useful information. By deploying network protocol analysis, syntactic information can be extracted from byte-level sequences. The syntax tree data representation can be used to represent the structure of a sequence generated by a context-free grammars [e.g.70–72].
A tree T=(V,E) is a directed acyclic graph in which any two verticesv1, v2∈V are connected by at most one pathe1, ...ei, ...en∀ei ∈E. Aleaf orterminalnode refers to a node without children. Aninternal
node is a node with at least one child. Apre-terminalnode refers to an internal node with only leaf node children attached.
Arooted treeis called a tree in which a special labeled node is singled out as the root node. Alabeled treeis a tree in which each internal node is associated with a label. Astructured treeis one in which the children of any node are given a fixed ordering. Asyntax treerepresent a specific type of a labeled structured tree.
Anattributed treeis a labeled, structured tree in which each nodevis associated with a finite sequence
s= s1...s|s| of symbols drawn from an alphabet of unique symbolsΣ, including the empty sequence. By applying a specified grammar, network protocol analyzers can be used to extract protocol structure from byte sequences with attributes associated to individual protocol elements.
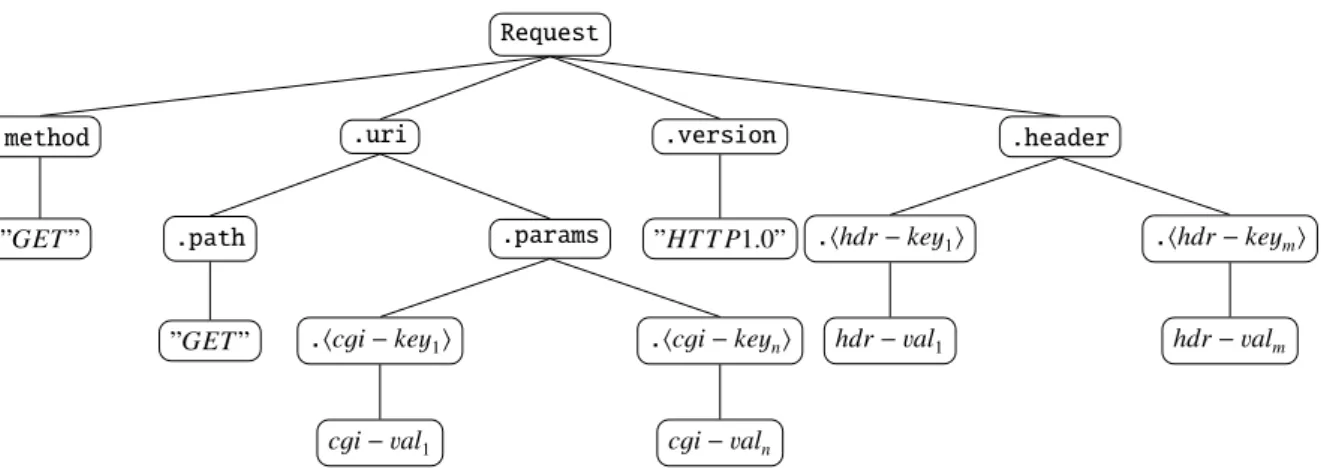
Fig.1.5shows an example of a syntax tree for a HTTPrequest. In this example, theHTTPrequest is parsed and substrings are associated with network protocol elements.
1.3 Data representations for sequential data Request .method ”GET” .uri .path ”GET” .params .hcgi−key1i cgi−val1 .hcgi−keyni cgi−valn .version ”HT T P1.0” .header .hhdr−key1i hdr−val1 .hhdr−keymi hdr−valm
Figure 1.5: Syntax tree to represent syntax structure of byte sequences
The syntax tree data representation can be used to compare structural similarity between sequences [e.g.
71]. In order to compare syntax trees, a corresponding feature map must be defined. A commonly used feature mapφ(T) involves the mapping of all subtrees of a treeT to a feature spaceF:
φ:T 7−→(φS)S∈I ∈ F, (1.7) whereasIdenotes the set of all possible subtrees. The mapping function returns 1 if a subtreeS is a subtree ofT and 0 otherwise.
φS(T)= (
1 if S is a subtree of T
0 otherwise. (1.8)
An alternative feature mapping is based on the idea ofk-grams. To this end, consider an alphabet to be a finite set of syntactic tokensΣ. A mapping functionφcan be defined which maps sequences of syntactic tokensuof lengthkinto a feature spaceF:
φ:Ts7−→(φu(Ts))u∈Σk ∈ F. (1.9)
The mapping functionφu(Ts) allows to map a token subsequenceucontained in treeTs(i.e. syntactic representation of sequences) to a binary, count or relative frequency value. The resulting feature set can be referred to as token grams. Fork = 1, the feature set corresponds to a bag-of-tokens data representations. By increasing k the sensitivity for structural differences between two syntax trees increases as well.
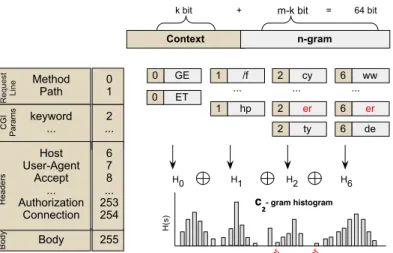
Syntax-sequential data representation. The syntax-sequential data representation (ck-grams) can be considered an extension of the sequential data representation as outlined in Section1.3. Ask-grams
Chapter 1 Introduction Method Path keyword ... Host User-Agent Accept ... Authorization Connection Body Context n-gram 0 GE 0 ET 1 /f ... 1 hp 2 cy 2 er 2 ty 6 ww 6 er 6 de H0 H1 H2 H6 H (s) c₂- gram histogram er er H ea de rs CGI Pa ra ms R eq ue st Line Bo dy 0 1 2 ... 6 7 8 ... 253 254 255 ... ...
k bit + m-k bit = 64 bit
Figure 1.6: Contextual grams (c2-grams) of an HTTPrequest
Graph-based data representation. Graphs can be used to represent semantic relationships extracted from sequential data. Graph representations can be used to learn behavior models based on observed user or system activity (i.e. a subject performs specific activities on a specific object).
LetE =(e1, ...,ei, ...,em) be a list of chronologically ordered eventsei ∈Σ. A sessionS =(e1, ...,en)⊆ E
can be considered as an ordered set of activities represented by events ei ∈ Σ. An activity model
G =(Σ,Q,qˆ,T,F) can be defined as a directed graph whereΣrefers to the universal set of events, Q
denotes the set of states of a session (represented as nodes), with ˆqbeing the current state,T :Q×Σ→Q
being the state transition function used to specify permissible state changes based on the observed events andFbeing the set of final states. The example in Fig.1.7shows a graph which represents a user who performs a series of web requests within a session.
q0
start q1 q2 q3
url1 url2
url3 url4
Figure 1.7: Graph representing user activity
In order to compare graphs, a corresponding feature map must be defined. A commonly used feature mapφ(T) involves the mapping of all paths of a graphGto a feature spaceF:
φ:G7−→(φw)w∈W ∈ F, (1.10)
whereasWdenotes the set of all possible walks (i.e. paths) induced by the set of vertices. The mapping function returns 1 if a pathwis contained inGand 0 otherwise.
φp(G)= (
1 if w is a path contained in G
0 otherwise. (1.11)
1.4 Measuring similarity in feature spaces
1.4 Measuring similarity in feature spaces
Machine learning methods are based on data models which represent geometric relationships between data points based on defined similarity measures in a geometric space. Similarity measures can be broadly categorized intodistances,coefficientsandkernels. Table1.1outlines commonly used similarity measures [e.g.73,74].
Distance Coefficient Kernel
Name d(x,y) Name s(x,y) Name k(x,y)
Minkowski P i| φi(x)−φi(y)|k1k Czekanowski 2a 2a+b+c Linear P i φi(x)φi(y) Mahalanobis r P i (φi(x)−φi(y)) 2 σ2i Kulczynski 12 a+ab+ a+ac Gaussian e kφ(x)−φ(y)k2 σ2 Chebychev max i |φi(x)−φi(y)| Jaccard a a+b+c Polynomial P i φi(x)φi(y)+c d Canberra P i |φi(x)−φi(y)| |φi(x)|+|φi(y)| Sokal-Sneath a a+2(b+c) Cosine P i φi(x)φi(y) rP i φi(x)2rP i φi(y)2 Sorenson-Dice b+ac
Table 1.1: Similarity measures
Distances. A distanced :X×X 7→Ris a a real-valued function over a set of data pointsXwhich satisfies the following conditions for any data pointx, y,z∈X:non-negativity(i.e. d(x, y)≥0),identity of indiscernibles(i.e.d(x, y)=0 ⇐⇒ x=y),symmetry(i.e.d(x, y)=d(y,x)), andsub-additivity(i.e.
d(x,z)≤d(x, y)+d(y,z)).
Commonly used distances for approximate string matching includeHammingdistance [75] and Leven-shteindistance [76,77]. However, both distances show limited usability for the application in the network and host security domain. For example, the Hamming distance requires equal length binary strings as input while the Levenshtein distance employs non-linear runtime. By casting sequences into their vector space representations, other distance functions can be used such asMinkowski,CanberraorMahalanobis.
Similarity coefficients. A similarity coefficients:X×X7→Ris a a real-valued function over a set of data pointsXwhich reflects similarity between two data points based on four aggregation variables a,b,c, andd. Thereby, the variableadefines the number of positive matching components in both data points,bdenotes the number of left mismatches,cthe number of right mismatches, anddrepresents the number of negative matches (i.e. zero-value variables in both data points). Similarity coefficients do not necessarily satisfy all distance properties. For example, theSorenson-Dicecoefficient does not meet the
Chapter 1 Introduction
separable(i.e. for allh∈ F and >0 there exists a countable set of elementsh1, ...,hi, ...hnofF such that|hi−h|< ).
The output of kernel functions can largely differ. For example, a Gaussian kernel is bounded and returns values in the range between 0 and 1. On the other hand, a tree kernel can return much larger values [e.g.
78]. In order to address scale diversity and facilitate learning, kernel normalization can be employed which allows for the projection of kernel values to the same interval. Kernel functions are normalized as defined below:
ˆ
k(x, y)= p k(x, y)
k(x,x)·k(y, y). (1.12)
Convolution kernelshave been first introduced by Haussler [79] and describe a class of kernel functions that can be used to calculate similarity between structured data objects. Consider a composite data object x = (x1,x2, ...,xD) consisting of Dparts. LetR(~x,x) = R(x1,x2, ...,xD;x) be a relation that is true if componentsx1,x2, ...,xDconstitute the data objectx. Similarity between two structured data objectsx andycan be calculated using the R-convolution kernel as introduced by Haussler [79]:
k(x,y)=[k1×k2×...×kD](x,y)= X ~x∈R(x), ~y∈R(y) D Y d=1 kp(xd, yd). (1.13) The overall simiarity between two composite data objects can hence be assessed by measuring similarity across all possible decompositions ofxandy. For the remainder of this section, various kernels are outlined that allow to measure similarity between structured data objects which have been shown to be instances of R-convolution kernels [78–80].
String kernel. String kernels allow for the pairwise comparison of sequential data based on common substrings. Based on the set of features extracted using a feature mapφ, a linear kernel functionk(x, y) between two sequencesx, y∈Xcan be defined as follows to measure similarity:
k(x, y)=hφ(x), φ(y)i=X
u∈L
φu(x)φu(y), (1.14)
whereL refers to the underlying language of generated sequences. The language L ⊆ Σn includes
k-grams - the set of unique substrings of lengthkgenerated by the alphabetΣ(c.f.1.3). The kernel function overk-grams is commonly referred to asSpectrumkernel [64,81]. Complexity of the Spectrum kernelk(x, y) isO(k|x||y|) using dynamic programming. However, using suffix trees the complexity can be reduced toO(|x|+|y|) by pairwise comparison of two sequencesxandythrough parallel traversal of the corresponding suffix treesT(x) andT(y) along suffix links.
It is noteworthy, that other classes of string kernels exist such asall-subsequence kernel,fixed length-subsequence kernel, or gap-weighted subsequence kernel and mismatch string kernel [64, 82, 83]. However, due to their marginal gain compared to an increased runtime complexity, these classes of string kernels are excluded from further consideration.
Tree kernel. A huge amount of data in the network security domain is entangled with specific formats for storage on hosts or exchange of data across a network using network protocols. In network security, for example, data is often transferred using application-level network protocols such asHTTP[26],File Transfer Protocol (FTP)[84], orSimple Mail Transfer Protocol (SMTP)[85] which provides fruitful
1.4 Measuring similarity in feature spaces
information to detect threats.
Tree kernels allow for the pairwise structural comparison of data points based on their tree representations. Two treesTxandTyare identical if there exists a bidrectional mapping between their nodes that maintains node labels, parent-child relations as well as ordering of siblings of each internal node. A kernel can be defined by explicitly embedding all finite trees to a vector spaceF. Theco-rooted subtree kernel[64,
78] is a commonly used kernel function for structural comparison of trees. Based on the feature map in Eq.1.7the following kernel can be defined as follows:
k(Tx,Ty)=hφ(Tx), φ(Ty)i =X S∈T φ(Tx)φ(Ty) = d+Yr(Tx) i=1 φrSi(τ(chi(r(Tx))))φ r Si(τ(chi(r(Tx)))) = d+Yr(Tx) i=1 (k(τ(chi(r(Tx))), τ(chi(r(Tx))))+1) (1.15)
whereasT0denotes the set of all trees,τ(v) refers to a subtree of a treeT rooted at nodev,r(T) denotes the root of treeT,chi(v) denotes thei-th child of a nodevandd+(v) specify the out-degree of nodev. The complexity of the calculation is at mostO(min(|Tx|,|Ty|)).
It is noteworthy, that there are also other, more complex tree kernel functions such asall-subtree kernel. However, calculation of these types of kernels is computationally expensive and they are therefore not further considered.
Attributed tree kernel. Structured data is oftentimes annotated with attributes (e.g. Extensible Markup Language (XML)[86]) which may contain information that allow to discriminate between two structurally identical data objects. To this end, this paragraph defines similarity measures that take into account both structural as well as sequential information usingattributed trees.
Based on a modification of theco-rooted tree kernel, anattributed tree kernelcan be defined to compare similarity between two attributed treesTxandTy:
k(Tx,Ty)=hφ(Tx), φ(Ty)i =X S∈T φ(Tx)φ(Ty) = d+Yr(Tx) i=1 φrS i(τ(chi(r(Tx))))φ r Si(τ(chi(r(Tx)))) = d+Yr(Tx) i=1 (k(τ(chi(r(Tx))), τ(chi(r(Tx))))+kˆ(attr(r(Tx)),attr(r(Ty)))), (1.16)
Chapter 1 Introduction
labeled tree nodes have to be compared individually using sequential kernel functions.
However, in the field of network security, complexity of calculation can be reduced as internal nodes of an attributed tree are not associated with attributes. Therefore, calculation of similarity between two parse trees can be limited to pairwise comparison of their pre-terminal nodes associated with corresponding attributes extracted from the network protocol analysis. To this end, theattributed tree kernelcan be reduced to anattributed token kernel[71].
Theck-gram data representation (c.f. Section1.3) containsk-grams extracted from parsed attributes annot-ated by their corresponding protocol token. Thus, the data representation allows for similarity comparison between sequences based on the similarity of substrings with matching syntactical context [72].
Graph kernel. Graph kernels are useful to model behavior (e.g. user or system behavior) or complex data structures, e.g. as typically found in computational chemistry.
Consider a digraphG=(V,E⊆V×V, vstart, vend) consisting of a set of verticesVand a set of directed
edgesEwhereas each edgeei =(v1, v2)∈Econnects two adjacent verticesv1andv2inG. A digraph is called labeled if each vertex is assigned to a unique label to distinguish it from other vertices. Graph kernels are a specfic type of convolution kernels on pairs of graphs to calculate similarity between graphs which is known to be a difficult problem. It has been shown that calculating a strictly positive definite graph kernel is at least as hard as solving the NP-hard graph isomorphism problem [87].
Alternative approaches include the enumeration ofrandom walksby counting the number of common walks in two input graphsGxandGywhereas a walk (i.e. path) denotes a sequences of nodes in a graph (with possible repetitions). Conventionally, the walks of lengthkcan be calculated by looking at thek-th power of the adjacency matrixAof each graph as defined below:
k(Gx,Gy)= |V| X i,j=1 hX∞ k=0 λkAki i,j. (1.17)
Drawbacks of this approach are however exponential runtime behavior, halting or tottering due to repetitive node walks. Various alternative kernels have been proposed (e.g. shortest-path kernel, optimal assignment kernel, weighted decomposition kernel, edit-distance kernel, cyclic pattern kernel, graphlet kernel) to calculate graph similarity [64]. However, these approaches are either computationally expensive or do not satisfy the positive semi-definiteness property.
A computational less expensive alternative involves the utilization of theck-gram data structure (c.f. Section1.3) by de-composing the graph into its set of unique fixed-length walks and mapping the graph in the feature space using a feature map as outlined in Eq.1.10. The similarity between two graphsGx
andGycan then be determined by calculating the inner product over the set of all possible walksPof lengthkcommon in both graphs:
k(Gx,Gy)=hφ(Gx), φ(Gy)i
= X
w∈W
φw(Gx)φw(Gy). (1.18)
However, this approach has one limitation that the calculation of similarity does not account for cycles in a graph as theck-gram data structure hashes unique walks only. Therefore, repetitive walks are not considered.
1.5 Thesis outline
1.5 Thesis outline
This dissertation addresses a major challenge in cyber security research – namely the reliable detection of unknown cyber attacks. The main focal point of this dissertation is the development of machine learning methods to detect unknown attacks in computer networks at the application-layer and furthermore derive useful information to pinpoint unknown vulnerabilities in applications based on the analysis of network packet payloads. To this end, six representative studies are introduced and organized in individual chapters. While the first five contributions focus on network security, the last study demonstrates usability of the proposed methods in other areas of computer and network security such as malware detection. Each of the presented studies addresses a specific research question related to the main focus of this dissertation:
• To what extent is unsupervised machine learning an alternative to supervised approaches for the detection of network attacks using network packet header features?– Numerous machine learning methods can be used to detect network attacks. Generally, methods can be distinguished between supervised and unsupervised learning. While supervised learning requires label information to train models, unsupervised learning allows to detect attacks as outliers in terms of deviation from a model or normality. Chapter 2 provides a comparative analysis of various supervised and unsupervised methods on the well-known KDD Cup 1999 dataset [88] over network packet header features to investigate strengths and limitations in terms of capabilities to detect known and unknown attacks in the presence and absence of label information.
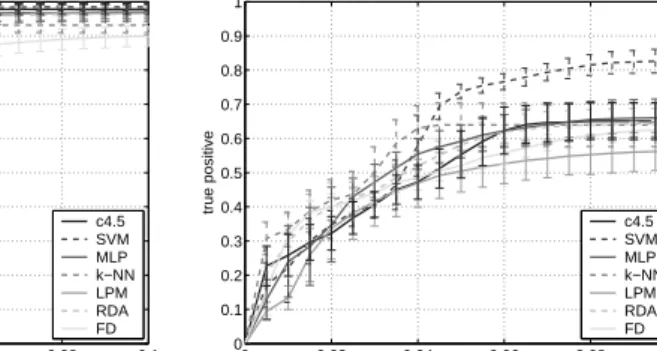
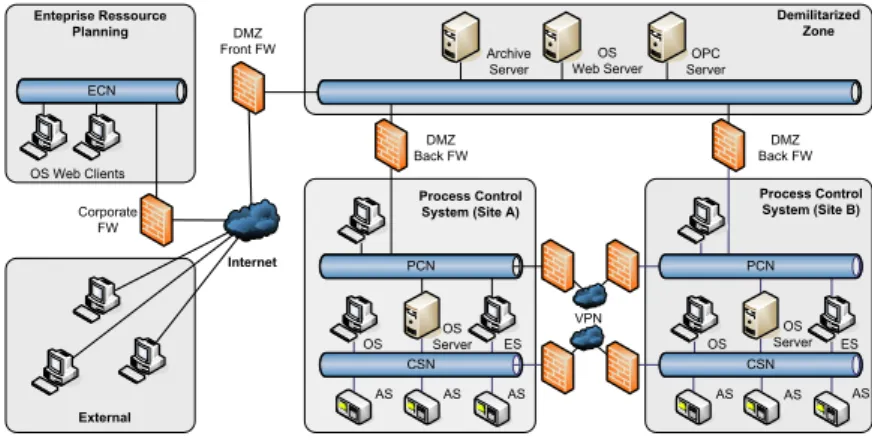
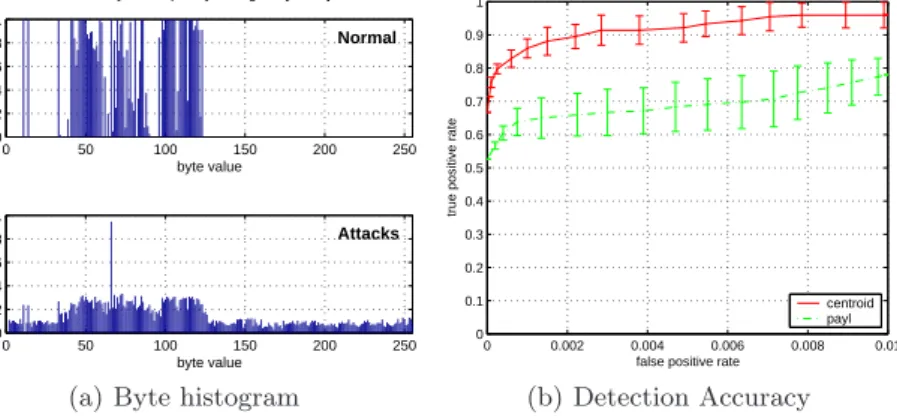
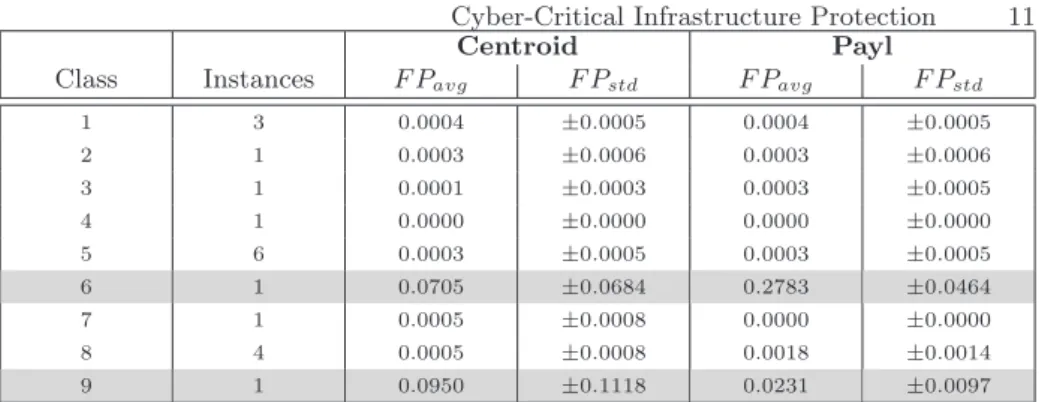
• To what extent does unsupervised machine learning allow for the detection of unknown network attacks in network packet payloads? – One of the limitations of the KDD Cup 1999 dataset used in the experimental evaluation in Chapter2is its focus on network packet header information. The study presented in Chapter3extends the work described in Chapter2and provides an experimental evaluation of anomaly detection using String kernel measures over language models extracted from both plain-text and binary network packet payloads commonly seen inSupervisory and Data Acquisition (SCADA)network traffic of industrial automation facilities [89].
• What are the features that maximize accuracy of network attack detection?– Good features contain discriminative information to learn accurate data models. Oftentimes, the selection of the right set of features is a problem given the extensive amount of features available. For example, while Chapter2focuses on network packet header features, experiments in Chapter3are based on content byte stream features and experiments in Chapter5elaborate on the usefulness of structural features to detect network attacks. In order to investigate which features are most effective for anomaly detection in network security, Chapter4introduces a method for automatic feature selection and provides an experimental evaluation to identify features to maximize accuracy of anomaly-based attack detection in network traffic.
Chapter 1 Introduction
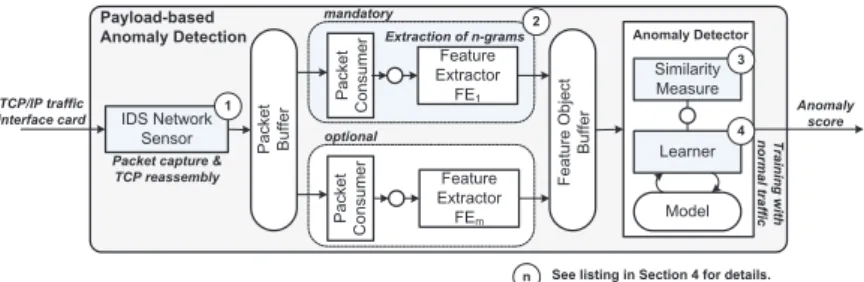
• To what extent does combination of syntax and sequential features improve the detection of application-layer attacks and increase explainability?– Fast similarity calculation is crucial for the practical use of machine learning in computer and network security. Unfortunately, similarity calculation over composite data structures can be complex due to kernel normalization across components. One way of reducing complexity and increasing speed is to disable normalization. However, this may lead to inaccurate data models due to under-representation of important features or over-representation of unimportant features. Chapter6introduces a novel, efficient feature extraction method that allows to store syntactical information along with associated byte-level features and this bridges the gap between network protocol analysis and anomaly detection. The novel data representation can be used by regular kernel measures without additional kernel normalization and furthermore can be used by security analysts to pinpoint unknown vulnerabilities in network protocols and applications.
While the previous five studies focus on network security, the following study is presented in order to demonstrate general applicability of the proposed methods in the field of computer security. Specifically, the contribution addresses the question of how to detect unknown malware instances based on malware behavior. To this end, Chapter7investigates the usability ofSVM-based classification over features extracted from malware behavior reports to detect novel malware families.
Bibliography
[1] I. S. Consortium.ISC Internet Domain Survey. 2017.
url:https://www.isc.org/network/survey(visited on 22/12/2017) (cit. on p.1).
[2] A. Nordrum.Popular Internet of Things Forecast of 50 Billion Devices by 2020 Is Outdated. 2016. url:
https://spectrum.ieee.org/tech-talk/telecom/internet/popular-internet-of-things-forecast-of-50-billion-devices-by-2020-is-outdated(visited on 22/12/2017) (cit. on p.1).
[3] E. de Argaez.Internet World Stats. 2017.
url:http://www.internetworldstats.com(visited on 22/12/2017) (cit. on p.1). [4] Statista.Global number of cyber security incidents from 2009 to 2015 (in millions). 2015.
url:
https://www.statista.com/statistics/387857/number-cyber-security-incidents-worldwide(visited on 22/12/2017) (cit. on p.1).
[5] J. Mchugh. “Intrusion and Intrusion Detection”. In:Int. J. Inf. Secur.1.1 (Aug. 2001), pp. 14–35. issn: 1615-5262 (cit. on pp.1,2).
[6] J. Mirkovic et al.Internet Denial of Service: Attack and Defense Mechanisms (Radia Perlman Computer Networking and Security). Upper Saddle River, NJ, USA: Prentice Hall PTR, 2004. isbn: 0131475738 (cit. on p.1).
[7] T. Holz. “A Short Visit to the Bot Zoo”. In:IEEE Security and Privacy3.3 (May 2005), pp. 76–79. issn: 1540-7993 (cit. on p.1).
[8] NIST.NIST Information Technology Laboratory - National Vulnerability Database. 2017. url:https://nvd.nist.gov(visited on 22/10/2017) (cit. on p.1).
[9] G. Wurster and P. C. van Oorschot. “The Developer is the Enemy”.
In:Proceedings of the 2008 New Security Paradigms Workshop. NSPW ’08.
Lake Tahoe, California, USA: ACM, 2008, pp. 89–97.isbn: 978-1-60558-341-9 (cit. on p.2). [10] Symantec.ISTR - Living offthe land and fileless attack techniques. 2017.url:
https://www.symantec.com/content/dam/symantec/docs/security-center/white-papers/istr-living-off-the-land-and-fileless-attack-techniques-en.pdf
(visited on 22/10/2017) (cit. on p.2). [11] B. Bashari R., M. Masrom and S. Ibrahim.
Bibliography
[14] M. Roesch. “Snort - Lightweight Intrusion Detection for Networks”.
In:Proceedings of the 13th USENIX Conference on System Administration. LISA ’99. Seattle, Washington: USENIX Association, 1999, pp. 229–238 (cit. on p.2).
[15] V. Paxson. “Bro: A System for Detecting Network Intruders in Real-time”.
In:Comput. Netw.31.23-24 (Dec. 1999), pp. 2435–2463.issn: 1389-1286 (cit. on p.2). [16] R. Bace and P. Mell. “NIST Special Publication on Intrusion Detection Systems”. In: (2001)
(cit. on p.2).
[17] L. Portnoy, E. Eskin and S. Stolfo. “Intrusion detection with unlabeled data using clustering”. In:In Proceedings of ACM CSS Workshop on Data Mining Applied to Security (DMSA-2001. 2001, pp. 5–8 (cit. on pp.2,4).
[18] E. Eskin et al. “A Geometric Framework for Unsupervised Anomaly Detection”. In:
Applications of Data Mining in Computer Security. Ed. by D. Barbará and S. Jajodia. Boston, MA: Springer US, 2002, pp. 77–101 (cit. on pp.2,4).
[19] M. V. Mahoney and P. K. Chan.
“PHAD: Packet Header Anomaly Detection for Identifying Hostile Network Traffic”. In: 2001 (cit. on p.2).
[20] S. Hansman and R. Hunt. “A Taxonomy of Network and Computer Attacks”. In:Comput. Secur.24.1 (Feb. 2005), pp. 31–43.issn: 0167-4048 (cit. on p.2). [21] Rapid7.The Metasploit Framework. 2017.
url:https://www.rapid7.com/products/metasploit(visited on 22/10/2017) (cit. on p.2).
[22] Gallopsled.CTF Framework and Exploit Development Framework. 2016.
url:https://github.com/Gallopsled/pwntools(visited on 22/10/2017) (cit. on p.2). [23] W. A. Arbaugh, W. L. Fithen and J. McHugh.
“Windows of Vulnerability: A Case Study Analysis”. In:Computer33.12 (Dec. 2000), pp. 52–59. issn: 0018-9162.doi:10.1109/2.889093.url:http://dx.doi.org/10.1109/2.889093 (cit. on p.2).
[24] I. X.-F. Research.CTF Framework and Exploit Development Framework. 2017.url:
https://securityintelligence.com/apache-struts-2-a-zero-day-quick-draw
(visited on 22/10/2017) (cit. on p.2).
[25] CVE-2017-5638.Available from MITRE, CVE-ID CVE-2017-5638. 2017.
url:http://cve.mitre.org/cgi-bin/cvename.cgi?name=CVE-2017-5638(visited on 01/04/2018) (cit. on p.2).
[26] R. Fielding et al.RFC 2616, Hypertext Transfer Protocol – HTTP/1.1. 1999.
url:https://tools.ietf.org/html/rfc2616(visited on 08/04/2018) (cit. on pp.3,14). [27] T. A. S. Foundation.Apache Struts. 2018.
url:http://struts.apache.org/(visited on 05/04/2018) (cit. on p.3). [28] Talos.Content-Type: Malicious - New Apache Struts2 0-day Under Attack. 2017.
url:http://blog.talosintelligence.com/2017/03/apache-0-day-exploited.html (visited on 05/04/2018) (cit. on p.3).
[29] M. Christodorescu and S. Jha. “Static Analysis of Executables to Detect Malicious Patterns”. In:Proceedings of the 12th Conference on USENIX Security Symposium - Volume 12. SSYM’03. Washington, DC: USENIX Association, 2003, pp. 12–12 (cit. on p.3).
Bibliography
[30] C. Kruegel, W. Robertson and G. Vigna.
“Detecting Kernel-Level Rootkits Through Binary Analysis”.
In:Proceedings of the 20th Annual Computer Security Applications Conference. ACSAC ’04. Washington, DC, USA: IEEE Computer Society, 2004, pp. 91–100.isbn: 0-7695-2252-1 (cit. on p.3).
[31] E. Kirda et al. “Behavior-based Spyware Detection”.
In:Proceedings of the 15th Conference on USENIX Security Symposium - Volume 15. USENIX-SS’06. Vancouver, B.C., Canada: USENIX Association, 2006 (cit. on p.3). [32] M. Sharif et al. “Eureka: A Framework for Enabling Static Malware Analysis”.
In:Computer Security - ESORICS 2008. Ed. by S. Jajodia and J. Lopez.
Berlin, Heidelberg: Springer Berlin Heidelberg, 2008, pp. 481–500 (cit. on p.3). [33] U. Bayer et al. “Dynamic Analysis of Malicious Code”.
In:Journal in Computer Virology2.1 (2006), pp. 67–77 (cit. on p.3). [34] U. Bayer et al. “Dynamic Analysis of Malicious Code”.
In:Journal in Computer Virology2.1 (2006), pp. 67–77 (cit. on p.3). [35] C. Willems, T. Holz and F. Freiling.
“Toward Automated Dynamic Malware Analysis Using CWSandbox”.
In:IEEE Security and Privacy5.2 (Mar. 2007), pp. 32–39.issn: 1540-7993 (cit. on pp.3,97). [36] B. Anderson et al. “Graph-based Malware Detection Using Dynamic Analysis”.
In:J. Comput. Virol.7.4 (Nov. 2011), pp. 247–258.issn: 1772-9890 (cit. on p.3).
[37] M. Egele et al. “A Survey on Automated Dynamic Malware-analysis Techniques and Tools”. In:ACM Comput. Surv.44.2 (Mar. 2008), 6:1–6:42.issn: 0360-0300 (cit. on p.3).
[38] AV-Test.Security Report 2016/17. 2017.
url:
https://www.av-test.org/fileadmin/pdf/security_report/AV-TEST_Security_Report_2016-2017.pdf(visited on 22/10/2017) (cit. on p.3). [39] T. Holz et al.
“Measurements and Mitigation of Peer-to-peer-based Botnets: A Case Study on Storm Worm”. In:Proceedings of the 1st Usenix Workshop on Large-Scale Exploits and Emergent Threats. LEET’08. San Francisco, California: USENIX Association, 2008, 9:1–9:9 (cit. on p.3). [40] I. You and K. Yim. “Malware Obfuscation Techniques: A Brief Survey”. In:2010 International
Conference on Broadband, Wireless Computing, Communication and Applications. 2010, pp. 297–300 (cit. on p.4).
[41] Symantec.Internet Security Threat Report 2018. 2018.
url:
https://www.symantec.com/content/dam/symantec/docs/reports/istr-23-2018-en.pdf(visited on 05/04/2017) (cit. on p.4). [42] K. Leung and C. Leckie.
Bibliography
[44] R. Mitchell and I.-R. Chen.
“A Survey of Intrusion Detection Techniques for Cyber-physical Systems”. In:ACM Comput. Surv.46.4 (Mar. 2014), 55:1–55:29 (cit. on p.4).
[45] C. Kruegel and G. Vigna. “Anomaly Detection of Web-based Attacks”.
In:Proceedings of the 10th ACM Conference on Computer and Communications Security. CCS ’03. Washington D.C., USA: ACM, 2003, pp. 251–261.isbn: 1-58113-738-9.
doi:10.1145/948109.948144.url:http://doi.acm.org/10.1145/948109.948144 (cit. on pp.5,59).
[46] K. Wang and S. J. Stolfo. “Anomalous Payload-Based Network Intrusion Detection”. In:RAID. 2004 (cit. on pp.5,37,77).
[47] K. Wang, J. J. Parekh and S. J. Stolfo.
“Anagram: A Content Anomaly Detector Resistant to Mimicry Attack”.
In:Proceedings of the 9th International Conference on Recent Advances in Intrusion Detection. RAID’06. Hamburg, Germany: Springer-Verlag, 2006, pp. 226–248 (cit. on pp.5,77).
[48] P. Laskov et al.Learning Intrusion Detection: Supervised or Unsupervised?
Ed. by F. Roli and S. Vitulano. Berlin, Heidelberg: Springer Berlin Heidelberg, 2005, pp. 50–57. isbn: 978-3-540-31866-8.doi:10.1007/11553595_6.
url:https://doi.org/10.1007/11553595_6(cit. on p.5). [49] K. Rieck et al. “Learning and Classification of Malware Behavior”.
In: DIMVA ’08 (2008), pp. 108–125 (cit. on p.5). [50] R. Sommer and V. Paxson.
“Outside the Closed World: On Using Machine Learning for Network Intrusion Detection”. In:2010 IEEE Symposium on Security and Privacy. 2010, pp. 305–316 (cit. on p.5). [51] N. Görnitz et al. “Toward Supervised Anomaly Detection”.
In:J. Artif. Int. Res.46.1 (Jan. 2013), pp. 235–262.issn: 1076-9757 (cit. on pp.5,9).
[52] A. L. Buczak and E. Guven. “A Survey of Data Mining and Machine Learning Methods for Cyber Security Intrusion Detection”.
In:IEEE Communications Surveys Tutorials18.2 (2016), pp. 1153–1176 (cit. on p.5). [53] R. A. Fisher. “The Use of Multiple Measurements in Taxonomic Problems”.
In:Annals of Eugenics7.7 (1936), pp. 179–188 (cit. on p.5).
[54] M. Rosenblatt. “Remarks on Some Nonparametric Estimates of a Density Function”. In:The Annals of Mathematical Statistics27.3 (1956), pp. 832–837 (cit. on p.5). [55] V. N. Vapnik and A. Y. Chervonenkis.
“On the Uniform Convergence of Relative Frequencies of Events to Their Probabilities”. In:Theory of Probability and its Applications16.2 (1971), pp. 264–280 (cit. on p.5). [56] Y. Lecun et al.
“Learning Algorithms For Classification: A Comparison On Handwritten Digit Recognition”. In:Neural Networks: The Statistical Mechanics Perspective. World Scientific, 1995, pp. 261–276 (cit. on p.5).
[57] R. O. Duda, P. E. Hart and D. G. Stork.Pattern Classification (2Nd Edition). Wiley-Interscience, 2000 (cit. on p.5).
[58] T. Hastie, R. Tibshirani and J. Friedman.The Elements of Statistical Learning.
Springer Series in Statistics. New York, NY, USA: Springer New York Inc., 2001 (cit. on p.5).
Bibliography
[59] K.-R. Mueller et al. “An Introduction to Kernel-Based learning Algorithms”.
In:IEEE Transactions on Neural Networks12.2 (2001), pp. 181–202 (cit. on pp.5–7). [60] B. Schoelkopf and A. J. Smola.
Learning with Kernels: Support Vector Machines, Regularization, Optimization, and Beyond. Cambridge, MA, USA: MIT Press, 2001 (cit. on pp.5,7,8).
[61] D. Tax and R. Duin. “Data domain description by Support Vectors”. In:Proc. ESANN. Ed. by M. Verleysen. Brussels: D. Facto Press, 1999, pp. 251–256 (cit. on pp.5,8).
[62] V. N. Vapnik.The Nature of Statistical Learning Theory. Springer-Verlag New York, Inc., 1995 (cit. on p.5).
[63] Y. Lecun et al. “Gradient-based learning applied to document recognition”. In:Proceedings of the IEEE86.11 (1998), pp. 2278–2324 (cit. on p.6). [64] J. Shawe-Taylor and N. Cristianini.Kernel Methods for Pattern Analysis.
New York, NY, USA: Cambridge University Press, 2004.isbn: 0521813972 (cit. on pp.7,14–16). [65] O. Chapelle, B. Schlkopf and A. Zien.Semi-Supervised Learning. 1st. The MIT Press, 2010
(cit. on p.9).
[66] R. E. Bellman.Adaptive Control Processes: A Guided Tour. Ed. by R. E. Bellman. MIT Press, 1961.isbn: 9780691079011 (cit. on p.9).
[67] K. Rieck and P. Laskov. “Language models for detection of unknown attacks in network traffic”. In:Journal in Computer Virology2.4 (2007), pp. 243–256 (cit. on pp.9,10).
[68] K. Rieck et al.Method and apparatus for automatic comparison of data sequences using local and global relationships. US Patent 8,271,403. 2012 (cit. on p.9).
[69] E. Ukkonen. “On-line Construction of Suffix Trees”.
In:Algorithmica14.3 (Sept. 1995), pp. 249–260.issn: 0178-4617 (cit. on p.9).
[70] C. Bockermann, M. Apel and M. Meier. “Learning SQL for Database Intrusion Detection Using Context-Sensitive Modelling (Extended Abstract)”. In:Proceedings of the 6th International Conference on Detection of Intrusions and Malware, and Vulnerability Assessment. DIMVA ’09. Como, Italy: Springer-Verlag, 2009, pp. 196–205.isbn: 978-3-642-02917-2 (cit. on p.10). [71] P. Duessel et al. “Incorporation of Application Layer Protocol Syntax into Anomaly Detection”.
In:Information Systems Security. Ed. by R. Sekar and A. K. Pujari.
Berlin, Heidelberg: Springer Berlin Heidelberg, 2008, pp. 188–202 (cit. on pp.10,11,16,77). [72] P. Duessel et al.
“Detecting Zero-day Attacks Using Context-aware Anomaly Detection at the Application-layer”. In:Int. J. Inf. Secur.16.5 (Oct. 2017), pp. 475–490.issn: 1615-5262 (cit. on pp.10,16).
[73] K. Rieck and P. Laskov. “Linear-Time Computation of Similarity Measures for Sequential Data”. In:J. Mach. Learn. Res.9 (June 2008), pp. 23–48.issn: 1532-4435 (cit. on p.13).
Bibliography
[77] L. Yujian and L. Bo. “A Normalized Levenshtein Distance Metric”. In:IEEE Transactions on Pattern Analysis and Machine Intelligence29.6 (June 2007), pp. 1091–1095 (cit. on p.13). [78] M. Collins and N. Duffy. “Convolution Kernels for Natural Language”. In:Advances in Neural
Information Processing Systems 14 — Proceedings of the 2001 Neural Information Processing Systems Conference (NIPS 2001), December 3-8, 2001, Vancouver, British Columbia, Canada. Ed. by T. G. Dietterich, S. Becker and Z. Ghahramani. 2002, pp. 625–632 (cit. on pp.14,15). [79] D. Haussler.Convolution Kernels on Discrete Structures. Technical Report UCS-CRL-99-10.
University of California at Santa Cruz, 1999.
url:http://citeseer.ist.psu.edu/haussler99convolution.html(cit. on p.14). [80] S. V. N. Vishwanathan et al. “Graph Kernels”.
In:J. Mach. Learn. Res.11 (Aug. 2010), pp. 1201–1242.issn: 1532-4435.
url:http://dl.acm.org/citation.cfm?id=1756006.1859891(cit. on p.14). [81] C. Leslie, E. Eskin and W. S. Noble.
“The spectrum kernel: A string kernel for SVM protein classification”.
In:Proceedings of the Pacific Symposium on Biocomputing. Vol. 7. 2002, pp. 566–575 (cit. on p.14).
[82] H. Lodhi et al. “Text Classification Using String Kernels”.
In:Journal of Machine Learning Research2 (Mar. 2002), pp. 419–444 (cit. on p.14). [83] C. Leslie et al. “Mismatch String Kernels for SVM Protein Classification”.
In:Proceedings of the 15th International Conference on Neural Information Processing Systems. NIPS’02. Cambridge, MA, USA: MIT Press, 2002, pp. 1441–1448 (cit. on p.14).
[84] J. Postel and J. Reynolds.RFC 959, FILE TRANSFER PROTOCOL (FTP). 1985. url:https://tools.ietf.org/html/rfc959(visited on 08/04/2018) (cit. on p.14). [85] J. Postel.RFC 821, SIMPLE MAIL TRANSFER PROTOCOL. 1982.
url:https://tools.ietf.org/html/rfc821(visited on 08/04/2018) (cit. on p.14). [86] W3C.Extensible Markup Language (XML) 1.0 (Fifth Edition). 2008.
url:http://www.w3.org/TR/xml(visited on 08/04/2018) (cit. on p.15). [87] T. Gärtner, P. Flach and S. Wrobel.
“On Graph Kernels: Hardness Results and Efficient Alternatives”. In:
Learning Theory and Kernel Machines: 16th Annual Conference on Learning Theory and 7th Kernel Workshop, COLT/Kernel 2003, Washington, DC, USA, August 24-27, 2003. Proceedings. Ed. by B. Schölkopf and M. K. Warmuth. Springer Berlin Heidelberg, 2003, pp. 129–143 (cit. on p.16).
[88] M. L. Labs.1998 DARPA Intrusion Detection Evaluation. 1998.url:http:
//www.ll.mit.edu/mission/communications/ist/corpora/ideval/index.html
(visited on 22/10/2017) (cit. on pp.17,27).
[89] B. Galloway and G. P. Hancke. “Introduction to Industrial Control Networks”. In:IEEE Communications Surveys Tutorials15.2 (2013), pp. 860–880 (cit. on p.17).
[90] F. Fleuret and I. Guyon. “Fast Binary Feature Selection with Conditional Mutual Information”. In:Journal of Machine Learning Research5 (2004), pp. 1531–1555 (cit. on p.51).
Bibliography
[91] K. Wang, G. Cretu and S. J. Stolfo.
“Anomalous Payload-based Worm Detection and Signature Generation”.
In:Proceedings of the 8th International Conference on Recent Advances in Intrusion Detection. RAID’05. Seattle, WA: Springer-Verlag, 2006, pp. 227–246 (cit. on p.77).
[92] P. Baecher et al. “The Nepenthes Platform: An Efficient Approach to Collect Malware”. Englisch. In:Recent advances in intrusion detection : 9th International Symposium, RAID 2006, Hamburg, Germany, September 20 - 22, 2006; proceedings. Vol. 4219. Springer, 2006, pp. 165–184 (cit. on p.97).
[93] Avira.AntiVir PersonalEdition Classic. 2007.
url:http://www.avira.de/en/products/personal.html(visited on 22/10/2017) (cit. on p.97).
C H A P T E R
2
Learning intrusion detection: supervised or
unsupervised?
2.1 Introduction
Machine learning techniques have been gaining increasing attention in the intrusion detection community to address well-known limitations of state-of-the-art misuse-based attack detection methods. Main goal of this work is to investigate the trade-offs between different machine learning techniques in their application to network intrusion detection as an alternative to misuse-based attack detection. Motivated by the fact that label information is difficult to obtain, particularly for novel attack types, this contribution provides an experimental evaluation of supervised and unsupervised techniques to compare detection performance and investigates to what extent label information is required to obtain higher detection accuracy. In order to fairly compare methods, this contribution casts experiments into a unified experimental setup that allows to apply model selection for both supervised and unsupervised learning. Experiments are carried out on the well-known KDD Cup 1999 data set [88] in which data instances are mostly characterized by network packet header features at the Transmission Control Protocol/Internet Protocol (TCP/IP) layer. Evaluation of the algorithms is carried out under two different scenarios. Under the first scenario, training data and test data are drawn from the same distribution (i.e. training and test samples share attack instances) to baseline detection of known attacks. Under the second scenario, attack data is drawn from a distribution that is different from the training data to evaluate the capabilities of the methods to detect unknown attacks.
Learning intrusion detection:
supervised or unsupervised?
Pavel Laskov, Patrick D¨ussel, Christin Sch¨afer and Konrad Rieck
Fraunhofer-FIRST.IDA, Kekul´estr. 7, 12489 Berlin, Germany
{laskov,duessel,christin,rieck}@first.fhg.de
Abstract. Application and development of specialized machine learn-ing techniques is gainlearn-ing increaslearn-ing attention in the intrusion detection community. A variety of learning techniques proposed for different in-trusion detection problems can be roughly classified into two broad cat-egories: supervi