A c o m p u t e r-a i d e d d i a g n o si s
s y s t e m fo r glio m a g r a d i n g u si n g
t h r e e d i m e n si o n al t e x t u r e
a n a ly si s a n d m a c hi n e l e a r n i n g i n
M RI b r a i n t u m o u r
Al-Z u rfi, AN, M e zi a n e , F a n d As pi n , R
h t t p :// dx. d oi.o r g / 1 0 . 1 1 0 9 /BIO S MART.2 0 1 9 . 8 7 3 4 2 0 7
T i t l e
A c o m p u t e r-a i d e d d i a g n o si s s y s t e m fo r glio m a g r a d i n g
u si n g t h r e e d i m e n si o n al t e x t u r e a n aly si s a n d m a c h i n e
l e a r n i n g in M RI b r a i n t u m o u r
A u t h o r s
Al-Z u rfi, AN, M e zi a n e , F a n d As pi n, R
Typ e
C o nf e r e n c e o r Wo r k s h o p I t e m
U RL
T hi s v e r si o n is a v ail a bl e a t :
h t t p :// u sir. s alfo r d . a c . u k /i d/ e p ri n t/ 5 1 2 9 1 /
P u b l i s h e d D a t e
2 0 1 9
U S IR is a d i gi t al c oll e c ti o n of t h e r e s e a r c h o u t p u t of t h e U n iv e r si ty of S alfo r d .
W h e r e c o p y ri g h t p e r m i t s , f ull t e x t m a t e r i al h el d i n t h e r e p o si t o r y is m a d e
f r e ely a v ail a bl e o nli n e a n d c a n b e r e a d , d o w nl o a d e d a n d c o pi e d fo r n o
n-c o m m e r n-ci al p r iv a t e s t u d y o r r e s e a r n-c h p u r p o s e s . Pl e a s e n-c h e n-c k t h e m a n u s n-c ri p t
fo r a n y f u r t h e r c o p y ri g h t r e s t r i c ti o n s .
F o r m o r e i nfo r m a t io n , in cl u di n g o u r p olicy a n d s u b m i s sio n p r o c e d u r e , p l e a s e
c o n t a c t t h e R e p o si t o r y Te a m a t :
u si r @ s alfo r d . a c. u k
.
A Computer-aided Diagnosis System for Glioma
Grading using Three Dimensional Texture Analysis
and Machine Learning in MRI Brain Tumour
1,2Ahmed Naser Al-Zurfi, 1Farid Meziane and 1Rob Aspin 1School of Computing, Science and Engineering, University of Salford, UK
2 Department of Communication Engineering, Faculty of Engineering, University of Kufa, IRAQ
[email protected], [email protected], [email protected]
Abstract— Glioma grading is vital for therapeutic planning where the higher level of glioma is associated with high mortality. It is a challenging task as different glioma grades have mixed morphological characteristics of brain tumour. A computer-aided diagnosis (CAD) system based on three-dimensional textural grey level co-occurrence matrix (GLCM) and machine learning is proposed for glioma grading. The purpose of this paper is to assess the usefulness of the 3D textural analysis in establishing a malignancy prediction model for glioma grades. Furthermore, this paper aims to find the best classification model based on textural analysis for glioma grading. The classification system was evaluated using leave-one-out cross-validation technique. The experimental design includes feature extraction, feature selection, and finally the classification that includes single and ensemble classification models in a comparative study. Experimental results illustrate that single and ensemble classification models, can achieve efficient prediction performance based on 3D textural analysis and the classification accuracy result has significantly improved after using feature selection methods. In this paper, we compare the proficiency of applying different angles of 3D textural analysis and different classification models to determine the malignant level of glioma. The obtained sensitivity, accuracy and specificity are 100%, 96.6%, 90% respectively. The prediction system presents an effective approach to assess the malignancy level of glioma with a non-invasive, reproducible and accurate CAD system for glioma grading.
Keywords: Glioma Grading, Grey level co-occurrence matrix; Single and ensemble classification system; Machine Learning algorithm.
I. INTRODUCTION
Brain cancer is life-threatening and is associated with a high mortality with glioma being the most common type of primary brain tumours [1]. According to the World Health Organization (WHO) classification of brain tumour, gliomas can be subclassified based on the malignancy level from grade I to grade IV. The malignant brain tumours can be subdivided into low-grade tumours (grades I and II) and high-grade tumours (grades III and IV) according to the biological behaviour of the brain lesion. Low-grade gliomas, which include grade I and grade II, grow very slowly with a remarkably better prognosis [2]. The high-grade gliomas, which include grade III and grade IV, are managed with an essential resection and chemotherapy and radiotherapy [3]. Therefore, it is crucial to differentiate low-grade gliomas from high-grade ones preoperatively, as this effectively influences the prognosis and treatment of a patient’s health [4, 5]. This motivates the development of a non-invasive and CAD system to predict the malignant grade of glioma.
The rapid development of machine learning algorithms has played a significant role in the prediction of brain cancer, specifically in many applications of brain tumours. The ability of medical imaging techniques to create visual images for internal organs and tissues of the human body is used to support clinicians for faster and more robust diagnosis and for informing treatment planning. Specifically, the diagnosis of brain tumours is determined by the aid of medical imaging techniques [6]. Computer-aided diagnosis and detection system using the image features extracted from brain tumours have been presented as a complementary approach to improve upon radiological diagnosis and detection performance [7].
Recent research work established glioma grading using the combination of conventional and advanced MR imaging modalities [8, 9]. However, the advanced MRI techniques as opposed to the conventional MRI techniques requires more experience, expensive tool and has limited availability in MRI clinic centers. Accordingly, our study was constrained on only conventional MRI modality, that is, T2-weighted MRI, which is a non-invasive imaging technique and the tumour is hyperintense compared to the other brain tissue using this molality.
Texture analysis has been proven to be an efficient and objective approach to assess tumour heterogeneity [10]. Furthermore, image texture analysis has been conducted widely for the recognition and identification of morphological characteristics of brain tumours [11, 12]. Grey level co-occurrence matrices (GLCM) was commonly used to evaluate the textural feature in different applications [13, 14]. Specifically, it has shown notable results for the evaluation of malignancy level of brain tumour [15-17].
MRI offers information about the characterization of the brain tumour and grade, creating a differential diagnosis, and providing sufficient anatomic information for surgical planning [18]. Furthermore, MRI provides information about biological tissues such as determining the spatial extension, and location of tumours [19]. However, although it presents promising potentials, the clinical practice routine requires the assessment of MRI images individually, which has complexity and considered to be time-consuming task, prone to human errors, and needs specific knowledge [20]. Consequently, along these lines, an objective and more efficacious data processing are still required. Rather than using numerous features for classification of brain cancers, this study proposes extracting 3D GLCM of T2-MR images of brain cancer and incorporated machine-learning algorithm to strength the discrimination ability of CAD system to determine the malignant grades of glioma.
The contribution of this paper is summarized as follows: Although two-dimensional textural analysis using GLCM is recommended by many research works and shown remarkable results in the evaluation of the malignancy level of brain tumours, other studies suggest that three dimensional-analyses based on GLCM can lead to better classification results [21, 22]. However, there is, so far, no conclusive answer as to which one of these texture analyses has the best impact on the classification of glioma grades. Notably, extracting advantageous features is still a challenging issue and the existing literature shows a dearth in developing a comprehensive analysis of the MRI-based 3D textural features that can achieve an optimized diagnosis of the accurate level of the malignancy growth of glioma grades. This creates the incitement to investigate the three-dimensional textural feature analysis based on GLCM, which could be an effective approach for the classification of glioma grades. Accordingly, this leads to the contribution of this study, which is investigating a 3D textural analysis, based on GLCM incorporating different machine-learning algorithms for the classification of glioma grades in MR images. The 3DGLCM matrix is mapped over all slices for each patient along the Z-dimension as well as the classic X- and Y-Z-dimensions. A comparison of the classification performance between 3D and 2D texture analysis was conducted in terms of different evaluation matrices including classification accuracy, sensitivity, and specificity.
II. MATERIAL AND METHODS
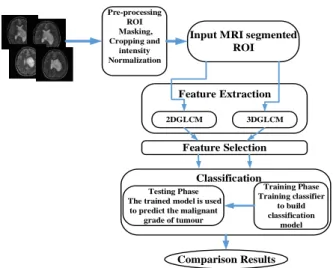
This research aims to investigate the use of image texture features integrated with machine learning algorithm for determining the correct malignant grade of glioma based on MR brain images. The overall diagram of the proposed algorithm is illustrated in Figure 1. It starts with preprocessing the MR image dataset, which is followed by features extraction and selection methods. Then classifiers are trained and tested to evaluate the features in discriminating between low-grade glioma (I, II) and high grade (III, IV).
The dataset used in this work to evaluate the proposed system for the classification of glioma grades is BRATS2013, which is publicly available and has a confirmation of histopathological diagnosis. This dataset is provided with standard segmented MR images [23]. It contains thirty patients, with low and high-grade histopathological diagnosed gliomas. The group of low-grades gliomas which has grades (I and II) includes ten patients while the second group of high-grade gliomas (III and IV) contain twenty patients.
Feature Extraction Pre-processing ROI Masking, Cropping and intensity Normalization
Input MRI segmented ROI
Feature Selection
Classification
2DGLCM 3DGLCM
Testing Phase The trained model is used
to predict the malignant grade of tumour Training Phase Training classifier to build classification model Comparison Results
III. IMAGE ANALYSIS AND PREPROCESSING
The first step in this work is the preparation of T2-MR images that includes the automatic masking, cropping and normalization for the region of interest (ROI) of brain tumour images. The masking process was used to bring in only ROI of brain tumours. The normalization is performed in the range of grey scale between (0-255). This process is necessary since these MR images were acquired from different sources of MRI scanner and different hospitals and have various acquisition setting. The normalization process of the image stretches the original intensity to cover all the grey scale levels in the image. Subsequently, the standardized image has higher contrast than the original one because the normalization technique delivers an intensity transformation and enhances image contrast. This approach has provided better classification of pathological tissues than can be achieved using the original image [24].
IV. GREY LEVEL CO-OCCURRENCE MATRIX
After the MR images with the segmented ROI normalized and cropped, the texture features were extracted based on grey level co-occurrence matrix based on four angles (θ = 0o, 45o,
90o, 135o) for 2D GLCM analysis and thirteen angles that
includes the previous four angles and another nine angles including (0o, 45o), (0o, 0o), (0o, -45o), (45o, 0o), (-45o, 0o), (45o,
45o), (-45o, -45o), (45o, -45o) and (-45o, 45o), and distance equal
to one. Eighteen textural statistics were extracted as follows: autocorrelation, correlation, cluster prominence, contrast, cluster shade, dissimilarity, energy, entropy, maximum probability, homogeneity, sum of squares, sum average, sum variance, sum entropy, information measure of correlation 1, information measure of correlation 2, inverse difference normalized, inverse difference moment normalized [25]. Consequently, four directions with 18 predictors resulting in each patient are presented by 72 textural features for 2DGLCM, while 13 angles with 18 predictors resulting in each patient is represented by 234 textural features. These features will be utilized and incorporated with different machine learning algorithms.
V. FEATURE SELECTION
Eliminating the redundant features can lead to an improvement in the classification performance. It also leads to reducing computational complexity by transforming high-dimensional data into a meaningful representation of a reduced one. The feature selection methods aim to select a small subset of features that maximize feature relevancy and minimize redundancy [26]. In this work, ANOVA technique is utilized to determine the significance of the features and eliminate the redundancy in the features set [27].
VI. CLASSIFICATION
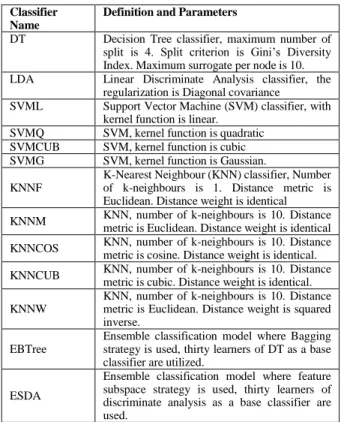
Features classification is a key step in the automation of the diagnostic system. Classification in this work has been developed based on single and ensemble prediction models. The single classifiers are based on four main classification models (DT, LDA, SVM, KNN) with a variety of parameters to produce eleven single classification models [28]. While for the ensemble systems [29], two common classifiers were adopted in the classification stage for glioma grading these are EBTree, and ESDA (Table 1). Leave-one-out cross-validation technique was applied to validate and generalize the classification performance of the proposed prediction model.
Table 1 the parameters settings for the classifiers undertaken in this work.
Classifier Name
Definition and Parameters
DT Decision Tree classifier, maximum number of split is 4. Split criterion is Gini’s Diversity Index. Maximum surrogate per node is 10. LDA Linear Discriminate Analysis classifier, the
regularization is Diagonal covariance
SVML Support Vector Machine (SVM) classifier, with kernel function is linear.
SVMQ SVM, kernel function is quadratic SVMCUB SVM, kernel function is cubic SVMG SVM, kernel function is Gaussian. KNNF
K-Nearest Neighbour (KNN) classifier, Number of k-neighbours is 1. Distance metric is Euclidean. Distance weight is identical KNNM KNN, number of k-neighbours is 10. Distance
metric is Euclidean. Distance weight is identical KNNCOS KNN, number of k-neighbours is 10. Distance
metric is cosine. Distance weight is identical. KNNCUB KNN, number of k-neighbours is 10. Distance
metric is cubic. Distance weight is identical. KNNW
KNN, number of k-neighbours is 10. Distance metric is Euclidean. Distance weight is squared inverse.
EBTree
Ensemble classification model where Bagging strategy is used, thirty learners of DT as a base classifier are utilized.
ESDA
Ensemble classification model where feature subspace strategy is used, thirty learners of discriminate analysis as a base classifier are used.
VII. EXPERIMENTALRESULTSANDDISCUSSION Different classification results have been obtained using different prediction models based on 2D and 3D analysis of textural features. A comparison between the full set of textural features associated with 3D GLCM and the features selected by ANOVA technique through using different classification models was studied. ANOVA technique was applied to enhance the feature set by selecting the relevant features and discard others. The results showed that ANOVA enables many classifiers to improve the classification accuracies for example DT, KNNCOS, and KNNCUB classifiers. The highest classification accuracy was achieved by SVML classifier where both the full set of features and the select features by ANOVA showed the same classification accuracy at 93.3% (Figure 2). Although the same level of classification accuracy was obtained after ANOVA, an enhancement was achieved by reducing the number of features from 234 to 166 textural features by using ANOVA technique, which is advantageous by decreasing the complexity by using a lower number of features.
Further investigation was conducted by examining the classification performance of each textural angle of 2D analysis of GLCM. This test covered wide range of single and ensemble classifiers to investigate the best prediction model for glioma grading. The results indicated that both SVML and DT classifier have achieved the highest classification accuracy at 93.3% in terms of the textural-angle 45o and 135o
respectively (Figure 3). The maximum classification accuracy was achieved by DT classifier at 96.6% by the textural-angle (0o, 45o) (Figure 4), and the confusion matrix results are as
follows: True Positive is 20 samples, True Negative is nine samples, False Positive is 1 sample, and False Negative is zero. The results illustrated that the full sensitivity of high glioma grades has been obtained at 100% by both DT and ESDA
classifiers at the same textural-angle at (0o, 45o) (Figure 5 and
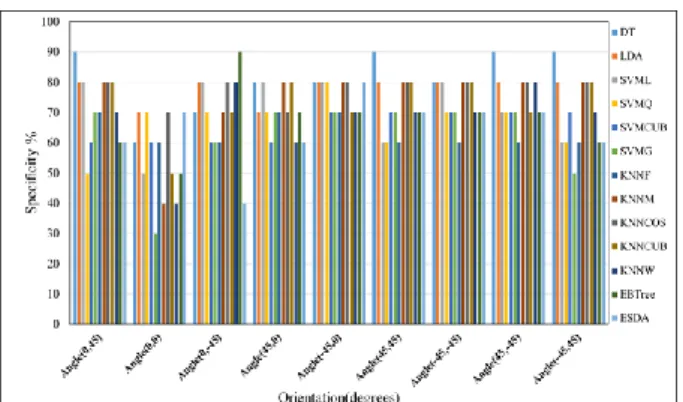
Figure 6). The full specificity associated with low grades glioma was achieved at 100% by KNNM, KNNCOS, and KNNCUB classifier at the angle (90o) (Figure 7 and Figure 8).
Different textural angles of 3D GLCM integrated with different machine learning algorithm provides variable classification performance in terms of classification accuracy, sensitivity, and specificity where it is possible to select and optimize the prediction model that reveal the desired and best classification performance of glioma grades.
Notably, developing and selecting the best prediction model that can show the highest classification accuracy is a challenging problem. To tackle this challenge many different classification models including common single and ensemble classifiers have been investigated and evaluated. The evaluation process was determined by measuring the output results based on different evaluation matrices and conducting a comprehensive comparison with ground truth of the diagnosed glioma grades. Furthermore, to ensure the validity and generalization of the classification performance of the developed models, leave-one-out cross-validation technique was applied with all classifiers and the results were compared. To sum up, the results showed that the best prediction model was based on DT classifier at the angle (0o, 45o) of
GLCM, which achieved 96.6% of classification accuracy and full sensitivity of high grades of glioma at 100% to discriminate high grade against low glioma grades. The textural analysis of different angles individually incorporated with different machine learning models can lead to finding the best prediction model that can show the highest classification accuracy for glioma grades rather than using the full set of textural features and without the need to apply the additional method for relevancy analysis such as ANOVA technique.
Figure 3. The behaviour of the four orientations of 2DGLCM application investigated with different classifiers in term of
classification accuracy.
Figure 2. Overall comparative results for the application of two cases, the first case is the use of the full set of three-dimension textural features, and the second case is the use of ANOVA. All cases are integrated with the
VIII. CONCLUSION
We developed a CAD system to classify WHO glioma grades into low grades (I, II) and high-grade (III, IV). This classification system was accomplished based on three dimensions textural features associated with GLCM. In the classification stage, we demonstrated eleven prediction models of the single classification system individually and two common ensemble systems. The aim of this investigation was to find the best prediction model that can determine the malignant grades of glioma correctly of T2-MR images of brain tumours. We also compared the capabilities and efficacies between 2D and 3D analysis of GLCM to determine the accurate grade of glioma. The analysis covered all the textural angles of GLCM with four angles for 2D analysis and thirteen angles for the 3D GLCM. The results were evaluated using the classification accuracy, sensitivity, and specificity. We compared the classification accuracy of individual classification models based on two cases: the first case is based on the use of the full set of 3D analysis of textural features, and the second case is based on the selected features by ANOVA technique. We applied ANOVA technique on the full set of features to select the significant features and remove redundancy. The results showed that ANOVA enables different classifier to show better classification results. It is found in this experimental work that the full angles of 3D GLCM incorporated with different classifiers showed lower classification accuracy compared to investigating the angles of GLCM individually. This work proved that individual investigation of different 3D angles of GLCM incorporates with different machine learning algorithms is an effective approach for glioma grading and can lead to better results compared to the use of the full set of 3D GLCM features. However, the developed method is computationally complex and the large memory requirements represent the main limitation. As a future trend, there is a possibility to improve the classification performance for glioma grading by enhancing and optimizing the features extraction and selection methods to achieve better classification results for glioma grades.
REFERENCES
[1] S. Bauer, R. Wiest, L. P. Nolte, and M. Reyes, "A survey of MRI-based medical image analysis for brain tumor studies," Physics in
Medicine and Biology, vol. 58, no. 13, pp. R97-R128, 2013.
[2] M. Weller, "Novel diagnostic and therapeutic approaches to malignant glioma," Swiss Medical Weekly, vol. 141, no. 1, p. w13210, 2011.
[3] R. Stupp, J.-C. Tonn, M. Brada, G. Pentheroudakis, and O. b. o. t. E. G. W. Group, "High-grade malignant glioma: ESMO Clinical Figure 4. The behaviour of the nine angles of the third dimension of
3DGLCM application investigated with different classifiers in term of classification accuracy.
Figure 5. The behaviour of the four orientations of 2DGLCM application investigated with different classifiers in term of sensitivity
of high-grades glioma.
Figure 6. The behaviour of the nine angles of the third dimension of 3DGLCM application investigated with different classifiers in term of
sensitivity of high-grades glioma.
Figure 7. The behaviour of the four orientations of 2DGLCM application investigated with different classifiers in term of specificity
(sensitivity of low-grades glioma).
Figure 8. Thebehaviour of the nine angles of the third dimension of 3DGLCM application investigated with different classifiers in term
Practice Guidelines for diagnosis, treatment and follow-up,"
Annals of Oncology, vol. 21, no. suppl_5, pp. v190-v193,
2010.
[4] B. J. Theeler and M. D. Groves, "High-Grade Gliomas,"
Current Treatment Options in Neurology, vol. 13, no. 4, pp.
386-399, 2011.
[5] M. L. Siker, A. Chakravarti, and M. P. Mehta, "Should concomitant and adjuvant treatment with temozolomide be used as standard therapy in patients with anaplastic glioma?,"
Critical Reviews in Oncology/Hematology, vol. 60, no. 2, pp.
99-111, 2006.
[6] N. M. Saad, S. A. R. S. A. Bakar, A. S. Muda, and M. M. Mokji, "Review of brain lesion detection and classification using neuroimaging analysis techniques," Jurnal Teknologi, vol. 74, no. 6, pp. 73-85, 2015.
[7] E.-S. A. El-Dahshan, H. M. Mohsen, K. Revett, and A.-B. M. Salem, "Computer-aided diagnosis of human brain tumor through MRI: A survey and a new algorithm," Expert Systems
with Applications, vol. 41, no. 11, pp. 5526-5545, 2014.
[8] E. I. Zacharaki et al., "Classification of brain tumor type and grade using MRI texture and shape in a machine learning scheme," Magnetic Resonance in Medicine, vol. 62, no. 6, pp. 1609-1618, 2009.
[9] X. Zhang et al., "Optimizing a machine learning based glioma grading system using multi-parametric MRI histogram and texture features," Oncotarget, vol. 8, no. 29, pp. 47816-47830, 2017.
[10] Y. J. Ryu, S. H. Choi, S. J. Park, T. J. Yun, J.-H. Kim, and C.-H. Sohn, "Glioma: Application of Whole-Tumor Texture Analysis of Diffusion-Weighted Imaging for the Evaluation of Tumor Heterogeneity," PLoS ONE, vol. 9, no. 9, p. e108335. , 2014.
[11] K. K. Holli et al., "Texture analysis of MR images of patients with mild traumatic brain injury," BMC Medical Imaging, vol. 10, no. 1, p. 1, 2010.
[12] S. Roy, S. Nag, I. K. Maitra, and S. K. Bandyopadhyay, "A Review on Automated Brain Tumor Detection and Segmentation from MRI of Brain," arXiv preprint arXiv:1312.6150,
[13] M. Yazdi, Z. Adelpour, B. Bahraini, and Y. K. Jahromi, "Novel ridge orientation based approach for fingerprint identification using co-occurrence matrix," World Academy of Science, Engineering and Technology, International Journal of Computer, Electrical, Automation, Control and Information
Engineering, vol. 1, no. 11, pp. 3414-3418, 2007.
[14] H. Ahmed, S. Mashohor, and M. I. Saripan, "A texture-based approach for content based image retrieval system for plant leaves images," in 2011 IEEE 7th International Colloquium on
Signal Processing and its Applications, Penang, Malaysia,
2011, pp. 11-14.
[15] A. Larroza, V. Bodí, and D. Moratal, "Texture Analysis in Magnetic Resonance Imaging: Review and Considerations for Future Applications," in Assessment of Cellular and Organ Function and Dysfunction using Direct and Derived MRI
Methodologies, C. Constantinides, Ed.: InTech, 2016, pp.
75-106.
[16] V. Kovalev and F. Kruggel, "Texture Anisotropy of the Brain's White Matter as Revealed by Anatomical MRI," IEEE
Transactions on Medical Imaging, vol. 26, no. 5, pp. 678-685,
2007.
[17] A. AlZurfi, F. Meziane, and R. Aspin, "Automated glioma grading based on an efficient ensemble design of a multiple classifier system using deep iteration neural networks matrix,"
in Proceedings of the 24th International Conference on
Automation and Computing (ICAC'2018), Newcastle
University, Newcastle upon Tyne, UK, 2018: IEEE. [18] L. Mechtler, "Neuroimaging in Neuro-Oncology," Neurologic
Clinics, vol. 27, no. 1, pp. 171-201, 2009.
[19] J. Luts et al., "Effect of feature extraction for brain tumor classification based on short echo time 1H MR spectra,"
Magnetic Resonance in Medicine, vol. 60, no. 2, pp. 288-298,
2008.
[20] A. M. Hasan, F. Meziane, and H. A. Jalab, "Performance of grey level statistic features versus Gabor wavelet for screening MRI brain tumors: A comparative study," in Information Communication and Management (ICICM), International
Conference on, Hatfield, UK, 2016, pp. 136-140: IEEE.
[21] W. Chen, M. L. Giger, H. Li, U. Bick, and G. M. Newstead, "Volumetric texture analysis of breast lesions on contrast‐ enhanced magnetic resonance images," Magnetic Resonance
in Medicine, vol. 58, no. 3, pp. 562-571, 2007.
[22] W.-S. Chen, R.-H. Huang, and L. Hsieh, "Iris Recognition Using 3D Co-occurrence Matrix," in Advances in Biometrics: Third International Conference, ICB 2009, Alghero, Italy,
June 2-5, 2009. Proceedings, M. Tistarelli and M. S. Nixon,
Eds. Berlin, Heidelberg: Springer Berlin Heidelberg, 2009, pp. 1122-1131.
[23] B. H. Menze et al., "The Multimodal Brain Tumor Image Segmentation Benchmark (BRATS)," IEEE Transactions on
Medical Imaging, vol. 34, no. 10, pp. 1993-2024, 2015.
[24] S. Tantisatirapong, "Texture analysis of multimodal magnetic resonance images in support of diagnostic classification of childhood brain tumours," PhD, School of Electronic, Electrical and Computer Engineering, University of Birmingham,UK, 2015.
[25] W. Gómez, W. Pereira, and A. F. C. Infantosi, "Analysis of co-occurrence texture statistics as a function of gray-level quantization for classifying breast ultrasound," IEEE
Transactions on Medical Imaging, vol. 31, no. 10, pp.
1889-1899, 2012.
[26] J. Tang, S. Alelyani, and H. Liu, "Feature selection for classification: A review," in Data classification: algorithms
and applications, 2014, p. 37.
[27] A. M. Hasan and F. Meziane, "Automated screening of MRI brain scanning using grey level statistics," Computers &
Electrical Engineering, vol. 53, no. 1, pp. 276-291, 2016.
[28] S. B. Kotsiantis, I. Zaharakis, and P. Pintelas, "Supervised machine learning: A review of classification techniques," in Emerging Artificial Intelligence Applications in Computer Engineering: Real Word AI Systems with Applications in EHealth, HCI, Information Retrieval and Pervasive
Technologie. Vol 160, 3-24, vol. 160Netherlands: IOS press,
2007, pp. 3-24.
[29] L. Kuncheva, Combining Pattern Classifiers Methods and
Algorithms. Hoboken, New Jersey, USA: John Wiley & Sons,
2014.