Singapore Management University
Institutional Knowledge at Singapore Management University
Research Collection School Of Information Systems
School of Information Systems
9-2017
Combining machine-based and econometrics
methods for policy analytics insights
Robert J. KAUFFMAN
Singapore Management University
, [email protected]
Kwansoo KIM
Izmir University of Economics
Sang-Yong Tom LEE
Hanyang University
Ai Phuong HOANG
Singapore Management University
, [email protected]
Jing REN
Singapore Management University
, [email protected]
DOI:
https://doi.org/10.1016/j.elerap.2017.04.004
Follow this and additional works at:
https://ink.library.smu.edu.sg/sis_research
Part of the
Databases and Information Systems Commons
, and the
E-Commerce Commons
This Journal Article is brought to you for free and open access by the School of Information Systems at Institutional Knowledge at Singapore Management University. It has been accepted for inclusion in Research Collection School Of Information Systems by an authorized administrator of Institutional Knowledge at Singapore Management University. For more information, please [email protected].
Citation
KAUFFMAN, Robert J.; KIM, Kwansoo; LEE, Sang-Yong Tom; HOANG, Ai Phuong; and REN, Jing. Combining machine-based and
econometrics methods for policy analytics insights. (2017).
Electronic Commerce Research and Applications
. 25, 115-140. Research
Collection School Of Information Systems.
Combining machine-based and econometrics methods for policy
analytics insights
Robert J. Kauffman
a,⇑, Kwansoo Kim
b, Sang-Yong Tom Lee
c, Ai-Phuong Hoang
a, Jing Ren
aa
Singapore Management University, Singapore
b
Izmir University of Economics, Turkey
c
Hanyang University, Republic of Korea
a r t i c l e i n f o
Article history: Received 19 March 2017 Accepted 17 April 2017 Available online xxxx Keywords: CausalityComputational Social Science Data analytics Econometrics E-commerce Empirical research Fintech Fusion analytics Music popularity Stock trading Policy analytics TV viewing Video-on-demand (VoD)
a b s t r a c t
Computational Social Science(CSS) has become a mainstream approach in the empirical study ofpolicy analytics issuesin various domains of e-commerce research. This article is intended to represent recent advances that have been made for the discovery of new policy-related insights in business, consumer and social settings. The approach discussed isfusion analytics, which combines machine-based methods from Computer Science (CS) and explanatory empiricism involving advanced Econometrics and Statistics. It explores several efforts to conduct research inquiry in different functional areas of Electronic Commerce and Information Systems (IS), with applications that represent different functional areas of business, as well as individual consumer, social and public issues. Recent developments and shifts in the scientific study of technology-related phenomena and Social Science issues in the presence of historically-large datasets prompt new forms of research inquiry. They include blended approaches to research methodology, and more interest in the production of research results that have direct tion to industry contexts. This article showcases the methods shifts and several contemporary applica-tions. They discuss: (1) feedback effects in mobile phone-based stock trading; (2) sustainability of top-rank chart popularity of music tracks; (3) household TV viewing patterns; and (4) household sampling and purchases of video-on-demand (VoD) services. The range of applicability of the ideas goes beyond the scope of these illustrations, to include issues in public services, healthcare, product and service deployment, public opinion and elections, electronic auctions, and travel and tourism services. In fact, the coverage is as broad as for-profit and for-non-profit, private and public, and governmental and non-governmental institutions.
Ó2017 Published by Elsevier B.V.
1. Introduction
IT innovations, specifically high-powered computing and ubiq-uitous networking, have affected people’s lives, and private and public organizational activities, and will continue to change our society in dramatic ways. As technology advances, increasingly abundant digital data from online music social networks, Internet-of-things (IoT)-based sensors, set-top box and handset technologies in cable TV, and mobile phones can be more thor-oughly studied with the help of various data analytics methods
(IDC, 2009), including Computer Science (CS), Machine Learning (ML), Statistics, and Economics.1These lead to new ways to under-stand people as individuals and in groups, organizations and their partnerships, and firms, industries and society as a whole (Carley, 2002; Anderson, 2008; Manyika et al., 2011; Agarwal and Dhar, 2014). The research inquiry approach that is discussed –fusion ana-lytics– is a term that was coined in this and related research, to offer additional new ideas related toComputational Social Science(CSS). It builds on earlier data analytics research (IBM, 2012; Chang et al., 2014; Athey, 2015), and our past philosophy of science work related
http://dx.doi.org/10.1016/j.elerap.2017.04.004 1567-4223/Ó2017 Published by Elsevier B.V.
⇑ Corresponding author.
E-mail addresses:[email protected](R.J. Kauffman),[email protected](K. Kim),[email protected](S.Y.T. Lee),[email protected]. sg(A.P. Hoang),[email protected](J. Ren).
1
Machine learninginvolves ‘‘data analysis that automates analytical model building, [by using] algorithms that iteratively learn from data,” allowing ‘‘computers to find hidden insights without being explicitly programmed where to look” (SAS, 2017).Econometricsis the ‘‘application of statistical and mathematical theories in economics for the purpose of testing hypotheses and forecasting future trends. It tests economic models ‘‘through statistical trials and then compare and contrast the results against real-life. In contrast,
Statistics‘‘is a form of mathematical analysis that uses quantified models, representations and synopses for a given set of experimental data or real-life studies,” and uses methodologies to gather, review, analyze and draw conclusions from data” (Investopedia, 2017).
Electronic Commerce Research and Applications xxx (2017) xxx–xxx
Contents lists available atScienceDirect
Electronic Commerce Research and Applications
j o u r n a l h o m e p a g e : w w w . e l s e v i e r . c o m / l o c a t e / e c r aPlease cite this article in press as: Kauffman, R.J., et al. Combining machine-based and econometrics methods for policy analytics insights. Electron. Comm.
Published in Electronic Commerce Research and Applications, 2017 April, Pages 1-26 https://doi.org/10.1016/j.elerap.2017.04.004
to the new approaches to big data research (Kauffman and Wood, 2007).
The contexts with big data that are explored are characterized by new opportunities for creating insights with declining costs and increasing technical leverage to accomplish the work. New ways of doing data analytics open up possibilities for innovative thinking and novel contributions to scientific discovery in interdis-ciplinary contexts (Davenport, 2006), where it is possible to bring different bodies of knowledge and different research approaches to bear in order to reveal interesting insights.Interdisciplinarityis critical in this context.2By exploring cross-disciplinary issues, ask-ing new questions, implementask-ing new data collection approaches, and instantiating models that would not have been possible before, a policy analyst is able to come closer toempirical truthsin applied settings that support large-scale data collection. This leads to increased relevance of the research and higher impacts. And yet, accomplishing such work in many organization settings is fraught with challenges, roadblocks, legal restrictions on data sharing, and very short delivery timelines when organizations are involved.
Although researchers in the past have tried to combine Computer Science, Psychology, Sociology, Regional Economics, Biostatistics, and other bodies of theory and methods knowledge to assert interdisciplinary solutions to leading problems, the per-spectives they emphasized rarely were interdisciplinary.3This arti-cle attempts to bring some of these knowledge bases together to addressconsumer, business and social issues. These are defined and discussed inTable 1, as a way to communicate to the reader that this is not astrict taxonomy, but instead away of thinkingabout the kinds of research inquiries that can be undertaken.
Big data enable new levels of sophistication for the study of settings in which technology meets consumer, business and social policy issues, facilitates social and civic empowerment, and enhances stakeholder participation in planning (Brabham, 2009). Data analytics can uncover business and social value from data, by permitting modeling, experimentation, simulation, and other scientific approaches to discover new knowledge. But it is also nec-essary to identify what kinds of analytics methods can be used from different disciplines, what new knowledge can be discovered regarding the issues at hand, as well as where the data will come from and how it can be collected. Some applied contexts that are appropriate can be identified based on the popular press, and gov-ernment agency calls for research.4
Organizations have been implementing big data projects and deploying new ways of discovering market, product and consumer
knowledge. They also have reported new opportunities to obtain informational advantages for the conduct of their businesses, com-pared to their prior reliance on traditional marketing research methods (Granados et al., 2012; Wang et al., 2016; Li et al., 2017). According toIBM (2012), every field is being changed by the large amount of data available.5 And increasingly, there has been a desire to find consistency in the methods and inquiry approaches that are used in organizations to achieve high quality, policy-relevant information (Kenett and Shmueli, 2017).
Current technologies and others that are emerging hold out the promise to offer astonishingly rich details concerning human and social activities, contextual patterns of behavior, and the attitudes, preferences, and sentiment of different individuals and groups (Gondecha and Lieu, 2012). The related research examined how peo-ple use big data to derive valuable results. Data analytics support finding repetitive patterns and adjusting predictive models to understand how likely it is to observe various behaviors. And yet, asShmueli (2010)has pointed out, it is important to distinguish between data analytics intended to deliver explanatory information versus predictive information. A recent trend is to usestatistical Machine Learning, which complements traditional Econometrics (Athey, 2015). When Machine Learning is combined with Economet-rics, authors often construct dependent and independent variables with the help of machine-based analytics routines and algorithms, and this sets up the use of modeling structures and error term spec-ification. Researchers working on electronic commerce have also begun to use this approach (Lee et al., 2016; Shi et al., 2016).
This article is intended to encourage researchers, analysts and doctoral students to apply interdisciplinary fusion analytics research approaches to achieve useful new results. For example, they include pattern recognition for data and other modes of machine-based discovery to create large datasets, with explanatory analysis that yields insights into the marginal impacts of different policies through the variables that represent them. This also makes it possible to docounterfactual impact analysis(Mohr, 1995; Lewis, 2001; Larkey, 2015; Science and Knowledge Service, 2016). Coun-terfactual analysis is about simulating what the marginal effects of policy interventions may be by considering what may happen in its presence versus its absence, based on the data analytics tech-niques available to discover this.6This allows analytics to produce more managerial insights, and build powerful evidence to understand business, consumer and social policies. This also is often a matter of what researchers bring to research designs that they implement.
Section2discusses the interdisciplinary roots of the fusion ana-lytics research approach, and presents a new framework to capture the essential elements of the different research approaches that have been identified. Section3 provides additional background on the importance of data analytics, and the rise of techniques that evaluate the digital traces of human behavior in different contexts and provide various means of network analysis and information visualization. Sections 4–7 then illustrate the fusion analytics approach with applications involving large datasets that are analyzed with machine-based methods, statistics, and economet-rics. Finally, Section8offers a concluding discussion that evaluates what has been learned in this research, and the various tactics that are required for achieving analytics success with big data and Com-putational Social Science research designs.
2
It is important to point out that doing machine-based analytics with explanatory methods may yield interesting observations on patterns in the data, and relationships that have not been recognized. Adding explanatory statistics or econometrics, along with a research design for the analytics to support the discovery of causality takes the analysis to a potentially more powerful level of effectiveness and deeper insight, so it is possible for the analyst to obtain knowledge about the dataset that goes beyond correlation. Similarly, conducting statistical and econometric analysis of a big data store may fail to identify empirical regularities that are model-free, as opposed to being bound by the empirical model’s design. This can be a shortcoming, and it is especially important in academic research, where the purpose is to seek theory-based causal effects explanations.
3
Wellman (1995)has pointed out the benefits associated with using Computer Science and Artificial Intelligence (AI) to explain important relationships in Social Science, especially with agent-based approaches to artificial economies. Only in the last decade has Computer Science moved to a position of high innovation in interdisciplinary studies. Social network analysis has been especially central to all of the new scientific approaches and data analytics perspectives that we have seen (Hassan, 2009; Mayer-Schönberger and Cukier, 2013).
4
A good starting point for identifying appropriate contexts is new research inquiry. Some of the issues that are covered include: influence of friends in social media and randomized experimental designs (Aral and Walker, 2011; Bapna and Umyarov, 2015); movie sales affected by social network interactions (Moretti, 2011); ad position auctions with consumer search (Athey and Ellison, 2011); and ranking of hotels on travel search engines by mining user-generated and crowd-sourced content (Ghose et al., 2012).
5
For example, information about online users is necessary to optimize credit card reward programs and business partnerships and achieve high business value in customer relationships (McKinsey, 2011; Geng and Kauffman, 2017).
6
Examples of counterfactual research questions related to our work in the first empirical research illustration in this article are: What if TV program bundling had been customized to individual households instead of just broader segments? How would cable TV services average revenue per unit (ARPU) have changed? No customization was done in the marketplace at the time.
2. A fusion analytics research framework
Now the discussion turns to the technology infrastructure that supports big data analytics, as well as the use of explanatory meth-ods from Statistics and Econometrics. The section ends with the contribution of a new framework to help others understand what are the main things considered related to the development of fusion analytics research in this area of inquiry – whether the research is conducted by industry practitioners to discover how to improve their policies, or academic researchers who are inter-ested to deliver longer-standing theoretical and empirical truths about various problem and issue contexts.
2.1. How technology enables big data-related research inquiry
IBM (2017a)has long defined large-scale data in termsof four V’s:
volume, velocity,variety, andveracity.The fusion analytics paradigm takes advantage of technological capabilities to develop research designs that address these dimensions.Varietyimplies that many tools and approaches are needed to process data in its different
forms (e.g., large cross-sections, lengthy panels). Data also exhibit
velocity, for example, the rate of transactions at an urban ATM, the calls that arrive at a government services help center, or the number of vehicles that flow through different routes at rush hour in a crowded city – all the way up to the more rapidly streaming data from high-frequency trading (HFT) in the stock markets, and digital data on image, music and video broadcasts. They exhibit great vari-etytoo, such as funds transfer transactions, user sentiment in social media, and moment-to-moment geopositional updates for the cars in a large taxi fleet. Still other data represent facts, while some may relate to opinions and estimates, so data may vary in the extent of the truth, orveracity, in the content it delivers. Putting data together from websites, user-generated content, and sensors in automobiles and smartphones allows researchers to explain and predict individ-ual behavior and detect trends in context also.
As a result, to make machine-based data analytics effective, big data researchers and analysts must be able to leveragedata infras-tructures. Managing a platform of services with streaming data, and trying to build useful metrics for its performance is a challenging problem. There have been efforts to model, analyze, and optimize Table 1
Orientation to Business, Consumer and Social Insights Data Analytics Settings.
Insights area Definition Representative data analytics contexts
Business Data analytics can create a deeper understanding of the issues, situations, and contexts that offer potential of benefits.
Bybusiness insights, analytics are involved in settings that are for-profit / not-for-profit, public / private, governmental and non-governmental, in operational, logistical, financial, human resources, strategy and industry settings.
Insights can redirect mgmt’s thinking, guiding future decisions for better product / service design and quality, operational performance and productivity, risk mgmt and security, and market share, profitability and performance.
Applicable across business disciplines, work groups, product lines, support services, strategic business units, organizations, firms, sectors and economy; can also include transactions, processes, economic exchange, business activities, managerial issues, and the dynamics of competition.
- Stock market trade analytics - Churn rate analytics for telcos - Internet fraud detection - New product launch analytics - Resource allocation, planning - Inventory management - Faster payment and settlement - Banking product line design - Govt regulation change effects - Hotel room utilization - Emergency room services - Taxi fleet passenger pick-ups - Airline landing rights bidding
Consumer Data analytics can also reveal a deeper understanding of consumers, customers, users, medical patients, and decision-makers.Byconsumer insights, analytics are involved in settings with individuals, and the behaviors that they demonstrate. This area of analytics enhances the understanding of the analyst through close examination of people and their interactions with products, services, businesses, cities, and government and non-business organizations, including healthcare, legal and family services.
Emphasizes consumption, consumer utility, consumer informedness and satisfaction; customer and patient centricity, individual wellness; auction bidding and group-buying behavior; decisions to buy, sell, participate; everything under the general umbrella of individual welfare; and not limited to or intended to be circumscribed by consumer behavior in retailing.
- Fast-moving product turn-over - Movie box office performance - Product price change impacts - Consumer coupon redemption - Customer product returns - Customer channel management - Online, offline retail shopping - Credit card spending patterns - Personal loan defaults - Individual criminal recidivism - Home mortgage demand - Household waste recycling - Sharing-economy services Social Big data analytics are concerned with peer-to-peer, social network and
non-network relationships, social activities and events; urban and regional programs and policies; legal, law enforcement and political issues; elections and issues referenda, community and regional planning. Bysocial insights, the connection is to analytics that produce deep knowledge into activities that are of a more aggregate nature than those that typically occur in business or consumer activities. In lieu of business value, the focus may shift to outcome measures such as environmental sustainability, water quality, community wellness, growth in regional real estate value, and social value of community programs.
These issues can be studied well when the promulgation of a new program, policy, law or initiative creates a natural quasi-experiment treatment for those who are affected, and a control for those who are unaffected, with randomized instead of biased participation. Examine interactions related to and social issues among people in different segments (younger / older, or race / ethnicity / income), as well as among people of different educational and social status levels, with the aim of understanding and maximizing social welfare.
Data come in various sources and forms, including social network, social media, blogging, human wellness, opinions, ratings and sentiment data.
- Public social sentiment effects on candidates and elections - Social media influences in public election settings
- Patterns of responses in situations of crisis involving publicly-available data
- Notifications of weather events and problems to emergency services via social messaging
- Online ratings and opinion analysis on consumer engagement for brands and healthcare services
- Social opinions on sustainable development, linking economy, society and environment
- Effects of social informedness on community recycling - Blogpost and tweet analytics to analyze public services
quality
benefits and service levels for technology infrastructures (Demirkan et al., 2008; Bardhan et al., 2010), and to determine the conditions for ideal value creation to ensue (Benaroch et al., 2010; Ma and Kauffman, 2014). Deploying adequate technology infrastructure for big data analytics in the organization is critical to support the creation of value and meaningful social insights.7
Other new directions that have appeared include the embed-ding of data analytics capabilities in cloud computing infrastruc-ture (Cloud Standards Customer Council, 2014), as well as the rise of cognitive computing, which involves the embedding of human thought processes and decision-making logic into systems that can be used in practice to drive higher value (Lopez, 2016; Davenport and Krishna, 2017). Some of these capabilities for ana-lytics have come together with new infrastructure approaches. An example is IBM’s Watson cognitive computing and AI approach, and the software and services that are now available on its BlueMix cloud computing platform (IBM, 2017b).
Moreover, important opportunities exist for interdisciplinary collaboration on big data fusion analytics. Information sciences research groups in university, business, healthcare, and government settings offer bright prospects as pioneers for interdisciplinary col-laboration. This is true in e-commerce and digital marketing espe-cially, for example. Interdisciplinarity to support more effective fusion analytics should also extend to non-business and social prob-lems, which go beyond the typical spectrum of most business school research. Big data analytics have pushed the boundaries of a number of disciplines outward based on forces that have been developing in this new environment. In industry settings, it is typical that organi-zations face challenges to learn about the benefits and constraints though. So it makes sense to leverage computing power that has become available through new statistics software, so new data sources contribute more useful information for improving data-driven business and organizational performance.
Data specialists today are working within an entirely new data-driven science of analytics in comparison to ten years ago. Comput-ing power allows the creation and testComput-ing of hundreds of hypothe-ses, models, and simulations more quickly than ever before, and at lower cost. Algorithm use is an essential element of large-scale analytics. Machines can learn from data, and analysts can leverage the intersection of Machine Learning, Artificial Intelligence, and data processing methods that offer new ways to build datasets and study them. This will allow them to understand problems that were hidden in the presence of prior analysis methodologies (Dietterich, 2003). What is critical is whether the discovery of new Social Science knowledge, the efficacy of new theories, and more effective explanations and predictions can be achieved.
2.2. The role of explanatory econometrics building on machine-based data analytics
Traditional statistics and econometric methods generally have been undertaken separately from Computer Science methods involving machine-based data analytics. Analysts and researchers need to be aware of the role of econometric and statistical analysis that builds on the machine-based methods though. For example, the former has assumed that data observations generally are inde-pendent or grouped, as in panel data with group-wise stratifica-tion, or are linked by time (Wooldridge, 2010). Econometric
modeling has been used to uncover what are the key relationships, influences, and marginal effects of the relevant variables based on carefully structured and cleaned data. Today, individuals in a social network may be interconnected in complex ways, creating new statistical challenges for determining causal relationships. The point of econometric modeling has been to uncover what are the key relationships influences and marginal effects of the relevant variables. Recent research in social networks, widely viewed as
complex adaptive systems (Lymperopoulos and Lekakos, 2013), has sought to discover the kinds ofnode-and-link dependence struc-tures that are present in social media and Internet advertising, peer-to-peer (P2P) lending and social crowdsourcing, and other online networks (Lazer et al., 2009). Developing methods suited to these and other network settings in e-commerce has been an ongoing challenge for statisticians8and econometricians as a result (Imbens et al., 2011).
Similar empirical modeling issues arise in almost every setting that is explored, and as a result, there is an ongoing need for advances in the methods that support causal explanations. The new methods that involve increasing sophistication in the study of business, consumer and social insights are a challenge for both researchers and practitioners. Nevertheless, blending Computer Science methods with econometrics has become attractive, due to the spate of recent work on statistical Machine Learning tech-niques that are tied ever closer to the causal relationship discovery process, and the experimental design approaches that Statistics and Econometrics offer. And, though new methods are increasingly used, knowledge about them still has not diffused very widely.
Moreover, the efficacy of explanatory methods must be built on their application in public and private organizations that have highly knowledgeable staff, who know where to acquire and how to work with big datasets. There are a growing number of such datasets in healthcare (Fagella, 2016), education (IBM, 2017c), pub-lic transportation (Nemschoff, 2014), and the government domain (Data.gov), among others. Industry practitioners and government researchers in these areas need access to readily implemented technical, behavioral, managerial and economic approaches, as well as scalable data analytics systems and infrastructures (Hu et al., 2014). They also must understand the power of diverse data sources, but often lack the technical capabilities for powerful machine-based, econometrics and statistical analytics, to take advantage of big data in their environments (Ernst and Young, 2014).
The art of conducting empirical research involving decision-making and policy issues is to recognize that understanding the
context is key to obtaining meaningful results. In the 1990s, Market-ing issues were the object of intense interdisciplinary research work, but did not include Computer Science as a front-end methodology to the explanatory statistical and econometric analy-sis methods that were used. In the 2000s and more recently though, the Marketing discipline has been moving more rapidly to embrace the new machine-based methods for its research and data analytics contexts.
Marketing researchers now more routinely rely on classification and recommendation algorithms from CS, such as the latent Dirichlet allocation(LDA) topic model, and blend their use with advanced statistical and econometric analysis (cf.Tirunallai and Tellis, 2014). From channel choices to price-setting and recommen-dations, music bundling and online reviews, and social networks, interdisciplinary researchers have conducted highly impactful data
7
The technical issues related to data capture, streaming, archiving, and parallel computing are central to CS methods. For example, the Hadoop family of technologies and services were developed for the handling of data-at-scale in Google, cloud computing, and other technical environments. Data scientists have been trying to detect patterns in data as a way of advancing knowledge. This paradigm includes new algorithmic, computational, and pattern recognition tools to produce value from available data (Bell et al., 2009; Hey et al., 2009).
8
This is based on personal discussion with Professor Steven Fienberg of Carnegie Mellon University (now deceased), when he was Co-Director of the SMU-CMU Living Analytics Research Centre (LARC) (2011 to 2016). His ideas and research have had a salient influence on the perspectives, methods, projects, and research inquiries that were undertook in sponsored projects.
analytics research that offers specific findings that are relevant for practitioners, as well as more lasting results that have become a part of academic knowledge and interdisciplinary theory (Elberse, 2010; Chellappa et al., 2011).9Researchers are continuing to become even more proficient in the use of innovative research designs, Machine Learning techniques, and econometric methods, as new opportunities with big data open up.
2.3. A framework for computational social science fusion analytics
Various machine-based methods, such asdata mining,natural language processing,machine learningandstatistical learning, have been applied in different research inquiries to identify patterns and hidden aspects of large datasets. They are limited in their abil-ities to help an analyst or a researcher draw causal inferences. This affects theout-of-sample prediction powerthat can be obtained with them. For example, the application of data mining to social network posts and tweets supports learning about topics that others are interested in. The public may be tracking a variety of issues at one time; yet knowing what– without knowing how, why and
what’s next– may not produce useful or meaningful insights. The usage of machine-based methods from CS for the collection and analysis of data in our fusion analytics methods process deserves additional discussion. What commonalities do these methods share that have been leveraged in the research studies that are used as illustrations in this article? They allow learning to occur in the data collection and data refinement process so that morevalue-focusedand insight-creating research questionscan be evaluated with advanced statistical and econometric models. Researchers employ different methods to extract appropriate data that allow them to address causality, whether through quasi-experiment designs or deep and advanced econometric modelling. The data outputs from these machine-based methods are rich, structured and tailor-made to support explanatory empiricism for causal inference. This is an iterative process, with a strong foun-dation of contextual knowledge, and various theoretical perspec-tives, when the methods are used for producing knowledge from academic research. Fig. 1 depicts the analytics fusion research approach.
The elements that characterize the fusion analytics research approach offered in this article include: (1) thepurposeof the data analytics work; (2) themachine-based methodsthat are used; (3) the output obtained by the researcher or analyst obtains (either harvesting and construction of a dataset, or different kinds of pat-terns, recommendations, and learning model information); (4)the statistical and econometric explanatory methodsthat are to be used; and (5) thepolicy insightsthat emerge to address issues in the pub-lic and private domains, related to aggregated or disaggregated data, with many different kinds of outcomes and value produced. Through this approach, it is possible to extract valuable business, consumer and social insights that are useful for policy-makers for the contexts of interest.10
3. Policy analysis
3.1. Data analytics background
Business intelligencebecame a popular term in the business and IT communities in the 1990s. By the late 2000s though, the term
data analyticsreplaced it (Davenport, 2006). More recently,big data analyticshas become popular, with datasets and analytical tech-niques for large and complex applications, from location sensors to social media data (Chen et al., 2012). Data analytics rely on new ways of accomplishing data extraction, and contemporary analysis methods (Chaudhuri et al., 2011; Watson and Wixom, 2007).
An important issue is whether the economic benefits of organi-zational and societal decisions are realized. What is needed is methodology for how large-scale data can be used to understand the impacts of different policies, and what the economic consequences of the related decisions are. So it is important to identify performance variables (asimpact factors), their coefficients (asmarginal contributions), and derive normative implications the data permit an analyst to craft effective policies – whether the con-text is public or private, or involves disaggregate or aggregate activities.
In addition to the underlying data processing technologies and analytical techniques, data analytics include process-centric prac-tices and methods that can be applied to high-impact applications, such as e-commerce, market intelligence, e-government, health-care, and security (Cohen et al., 2009). Performance management often uses scorecards and dashboards that are helpful to analyze a variety of relevant metrics. In addition to established reporting functions, data mining and statistical analysis support associa-tional analysis, data segmentation, clustering, classification, and anomaly detection.
3.2. The policy analytics perspective
Policy analyticsevaluates and legitimizes strategies and tactics for public and private organizations – small and large firms, cities, states, regions and even countries. Its findings are often based on agreed-upon outcomes to measure, such as equity, economic efficiency, social acceptability, legality, and the proxies that support their evaluation. They enable an analyst to establish recommendations or assessments by processing information from relevant data using appropriate tools to make important infer-ences and discover useful insights. In this kind of process for problem formulation, evaluation and selection of policies, it is necessary to consider the interests and preferences, the applicable priorities, and the values of a diverse set of stakeholders (Brickland, 2001).11AsDe Marchi et al. (2016)have stated, the ana-lytics themselves are most useful forevidence-based policy-making, which ‘‘helps people make well informed decisions about policies, programs and projects by putting the best available evidence from research at the heart of policy development and implementation” (Davies, 1999). And yet, the decisions that can arise out of such pro-cesses are complicated with stakeholder differences of opinion, bureaucratic requirements, tight deadlines for completion, and sometimes overwhelming political considerations. And for research-ers, organizational access, cooperation, relationship sustainability, and completion can be hard too.
9
Many different sources of data have been used, and there have been substantive advances in the collection and analysis of web data since the earliest efforts were made to write down the requirements for the persistent operation of data-collecting software agents in the present of possible system aborts and telecom disruptions (cf. Kauffman et al., 2000).
10 There are many approaches that have been developed to the collection of
data-at-scale to support asking new research questions about patterns, issues, observations and relationships. Researchers can choose any method to collect, extract, structure, refine and apply machine-based analysis to the relevant data, as readers will see from the research presented in this article. The objective is to create a relevant and integrated dataset, and to identify different kinds of empirical facts, such as patterns, classifications, valences on sentiments and opinions, and other kinds of useful information. Then, a researcher can apply statistics and econometrics to discover new ways to explain what has been observed, on the basis of variables that aid in explanation.
11
Decision theorywas developed to support managerial understanding regarding a rational individual’s consistency and effectiveness in making choices under uncer-tainty, mostly through the use ofexpected value analysis.Policy analysisfor firm decision-making is different. It often needs modifications, flexibilities and different theoretical thinking to deal with problems of group consensus, ill-defined objectives, and disparate information sources (Bunn, 1977).
Forecasting methods need to be integrated into decision-analytic frameworks, if they are to provide useful evidence for decisions. This is to ensure that there is recognition of how to answer the importantprospective questionof ‘‘What should be done going forward?” versus theretrospective questionof ‘‘What should have been done in the past?” A consequence of adopting a decision-theoretic approach to forecasting is the need to develop ways of synthesizing the results of a set of available prediction methods. Such an approach to support forecasting is different from conventional selection methods. In the policy analysis process, whose values should be invoked? Are the interests of certain groups more important than those of others? How can the prefer-ences of different stakeholders be effectively gauged? Big data and related methods in the area of social sentiment analysis have the potential to be useful for answering these kinds of questions. This is true for consumer preferences and organizational planning as well – whether they are related to books, movies, or luxury prod-ucts, and products to redesign, services to revamp, and policies to adjust.
To understand how to gauge the importance of uncertainty, pol-icy analysts need to create appropriate analytic contexts around the data they use and the issues they wish to study. One way to achieve this is throughdata integration, the technological process of combining different sources of data using technical infrastruc-ture for big data operations to create more useful information for different policy context (Delen and Demirkan, 2013). This has tra-ditionally been true with methods such as Delphi sessions, but today it is more applicable to settings in which there are social comments appended to geospatial location data, such as in Twitter and FourSquare, and a myriad of law enforcement-related data analytics applications that pertain to terrorism and crime predic-tion (Stroud, 2014). They include: the U.S. Department of Home-land Security’s Future Attribute Screening Technology Project (FAST), a potential terrorist diagnosis application; and Rutgers University’s Risk Terrain Modeling Diagnostics (RTM Dx). The latter is an application deployed to police agencies in different states of the U.S. that:
‘‘. . .uses geolocation and crime data to measure the spatial corre-lation between where the crimes have occurred in recorre-lation to differ-ent features of the environmdiffer-ent such as nightclubs or bars. With that, officers can measure correlations between various sites and crime rates and then decide which. . .correlations are worth mon-itoring and pursuing.” (Mor, 2014)
3.3. The rise of digital traces, and the business and social value of data analytics
A valuable insight must be unique and suggestive of actions that can be taken to improve decisions about all kinds of individ-ual, organizational, healthcare and societal activities.12 As con-sumers become more involved in activities in the digital economy and e-commerce, and are subject to many forms of social sensing, they leave manydigital traces of their behavior, from TV viewing habits, to opinions on products and services, to mobile phone use and texting behavior, as well as their ATM, PC and phone banking transactions. These are among the most powerful sources of data for insight creation, and are driving changes and transformation in marketing, logistics and information security research.
Other techniques that take advantage of the digital traces of people, phones, automobiles, tourist and shoppers have grown popular as well.Information visualization(Aigner et al., 2008) and
network analysis(Lazer et al., 2009) have a long history in the nat-ural sciences. However, their impact has increased, as they have overlapped with the emergence of big data in producingbusiness value and social valuefor public and private sector organizations.13
Fig. 1.A fusion analytics research process for computational social science research.
12
Understanding the guilt that consumers feel when they eat something they like, and then combining it with the brand experience of a product, can lead to insights about ‘‘pleasure that justifies the guilt,” and makes the consumer willing to pay more. Such insights are critical, and can be handed over to a firm’s creative team to supplant the guesswork that has dominated (Sen, 2003).
13Social media analytics involve a three-stage process of (1)capturing underlying
patterns, (2)understanding what they represent and may mean, and then (3)presenting them to others, so it is possibleto identify policy actions.
These techniques go beyond text analytics to include opinion min-ing, sentiment analysis, topic modelmin-ing, social network analysis, trend analysis, and visual analytics. They can be used in businesses to realize value in all phases of a product or service life cycle, for changing market tastes, advertising campaign effectiveness, responding to operational problems or crises, and creating new ways to get competitive intelligence. And they often are used in public organizations to gauge how well informed citizens are about issues, the perceived effectiveness of government policies and emergency services, and how environmental issues are being managed.
In social issue-related applications, Del Guidice et al. (2015)
studied emerging economies. They covered practices and tools for emerging markets, social media, statistics, peer opinions, buzz and viral marketing, and word-of-mouth.Harrysson et al. (2014)
outlined opportunities related to consumer behavior in social media, which blends social and consumer insights research inquiry. They suggested ways to: create dispersed networks to achieve a deep understanding of the business; equip employees to browse blogs to create followers and match their interests to in-store retail offerings; and use insights for marketing, sales, pro-duct design and customer support. Again, it must be stressed that such research may span multiple areas of the business, consumer and social insights spectrum, as opposed to matching just one of them.
3.4. Value creation, the data analytics skills shortage, and organizational alignment
Data analytics have improved over the past few years, giving public and private organizations of different types greater value and more meaningful insights. Today, massive databases require a mix of automated analysis techniques and human effort to give users cost-effective and deep insights about the activity on their websites – in the law enforcement context, for example, as well as about the characteristics of a country’s tourists and visitors, in the context of national-level hospitality and tourism services plan-ning. In addition, with millions of click-streaming records gener-ated every day, aggreggener-ated to transaction record summaries for credit card users, public transportation users, drivers on toll roads, and financial market traders, there is a need for automated tech-niques to find meaningful patterns in the data, and translate them into relevant knowledge. To make decisions based on the large datasets that are collected, data analysts must be savvy in the use of high-tech applications for extracting information that blend data analysis with task, context, and time-specific knowledge.
And yet most modern economies do not have enough skilled people to populate the kinds of job roles and deliver the necessary skills that are in such high demand. For example, the U.S. is fore-casted to have a gap of 50% to 60% between lower supply and higher demand for data analytics skills in 2018, according to a 2011 report by McKinsey (Manyika et al., 2011). Organizations are investing more in new data analytics technologies, and glean-ing insights through data collection and analytics methods that require knowledgeable professionals to drive their planning, implementation and ongoing management.Farris (2010)pointed out the contrast between traditional metrics, such as market share, sales force performance, rebates, market reach, and revenue pro-duction. He also noted the importance of digital economy metrics – for web campaigns, e-commerce opportunities, and leading indi-cators of digital financial performance.
By broadening the uses of analytics in organizational processes, the solutions can enrich and go beyond customer, patient and citizen-centric applications to support sales and marketing, supply chain visibility, pricing and access, workforce management, and healthcare and public services better than before. Finally, value-maximizing analytics solutions have to produce results that are
actionable, with ways to measure the effects of the changes that occur. The challenges of big datasets continue to involve their col-lection, validation, integrity, and security. Such issues will continue to arise with increased use of big data for policy-making in the information society (Mayer-Schönberger and Cukier, 2013).
In Sections 4–7, overviews and methods commentaries are offered on research projects that illustrate Computational Social Science fusion analytics methods from the framework in Section2. They leverage Computer Science and Machine Learning methods to help collect, extract, integrate, structure and classify the data, and then combine this work with explanatory Econometrics and Statis-tics methods to extract new business, consumer and social insights. (For a summary of the studies according to the set of dimensions that are considered, see Appendix A,Table A1.)
4. Mobile phone-based stock trading
Next, an illustration of machine-based analysis of social senti-ment for mobile phone users who trade stock is presented. Text analytics for social sentiment analysis were combined with econo-metric methods, includingfeasible generalized least squares(FGLS), Granger causality based onpanel vector autoregression(PVAR), and
kernel regularized least squares(KRLS) building on other traditional estimation methods. They helped to validate ageneral conjecture
(an assertion that some phenomena have a basis in theory, but where none is specified yet) regarding whether mobile phone-based stock-trading is subject tosocial sentiment effectsthat cause unusual feedback trading.(See Appendix A,Table A1; it offers an overview of this study in terms of the fusion analytics research framework, that will guide the reader.)
4.1. Context, data acquisition, and machine-based data analytics 4.1.1. Context and data
Social media sentiment affects market trading volume for equi-ties, which may be biased in systematic ways, in the mobile phone channel.14Using data from Korea, evidence was obtained that sug-gested there were different patterns of trading – especially positive and negative feedback trading. They appeared in the short run, but disappeared over time as mobile traders became more informed (Kim et al., 2016). The results support alternative conclusions about the trading of securities via mobile phones: either as asmart channel
for beneficial exchange, or possibly as anoisy channelwith low infor-mation and few benefits for investors.
Most financial markets should have basic similarities when it comes to trading, irrespective of the trading channel. Korean mar-ket stock trade volumes were collected from data previously culled from a mobile stock-trading platform. Social sentiment postings, such as on Twitter and via blogs, also were obtained for May to September 2012. The data cover about 251 firms that were dis-cussed in Korean social media. Two groups of equities were listed on the Korean Exchange (KRX) at that time: the 125 largest firms, and another 126 firms of somewhat smaller size.15The companies
14
In Finance, the technical term used when the trader does not know much about what is going on in the market, or about a specific equity issue that is being bought or sold, is anuninformed noise trader. According toDe Long et al., 1990, stock investors also can beinformed value traders, rationally anticipating asset value. Uninformed traders react to changing sentiment in the market though, and this may cause persistent mispricing of stock-related bids and offers. Traders who use mobile phones for stock transactions may view social signals as relevant information but it makes sense to view them as being relatively uninformed. After all, sentiment is thenoise of the market-at-large.
15
This classification helped to discover more nuanced results for the impacts of social sentiment on observed trading volumes.
were divided intoIT and non-IT firms, and intoindex categoriesof the
Korea Composite Stock Price Index(KOSPI), as well as according to def-initions from the Korean Securities Dealers Automated Quotations
(KOSDAQ).
4.1.2. Lexicon and learning-based algorithms for text mining
Progress has been made in social sentiment tracking techniques that extract indicators of sentiment from social media content, par-ticularly from large-scale Twitter and blog posts.Social metrics ana-lyticsfrom DaumSoft (www.daum-soft.com) were employed in this research for text message mining, reflecting the language, senti-ment, and opinions of social media users.16Its social metrics imple-mentcontextual social analysis.The text mining algorithms not only extract and enumerate the data that are processed, they also show where each piece of sentiment data originated, and why it was pre-sented to the analyst.17,18
Two types of algorithms are implemented in DaumSoft’s soft-ware: lexicon-based and learning-based algorithms. The lexicon-based algorithm uses a dictionary of words to perform entity-level sentiment analysis. Its words are tagged with their semantic polarity and used to calculate an overall text document polarity score. This gives high precision but low recall. Lexicon-based tech-niques with large dictionaries enable good results, but require using a lexicon, which may not be available for a language or domain.
In contrast, a learning-based algorithm creates a model by training the classifier with a labeled training dataset. Thus, it was necessary to first gather a dataset with examples for posi-tive, negaposi-tive, and neutral classes in the stock-trading domain. Next was to extract the features and words from the examples, and then train the algorithm based on them. This approach deliv-ers good results, but requires obtaining appropriate large-scale datasets and then making sure the algorithm learns to analyze sentiment from social media content, such as tweets and status updates. On a procedural level, the algorithm takes a string of words, and returns a positive, negative, or neutral sentiment rating: asentiment valence score useful for recognizing the social mood of the public. To do this, it identifies themeaning of words
in their social context, different from social network analysis monitoring, as other algorithms do. The learning-based algorithm also provides a compound reading on overall sentiment for a set of strings.
Positive or negativemood wordswere identified for the stock-trading domain in terms of their frequency of occurrence. To sup-port the reader’s intuition,positive sentimentwas represented by the values of variables that showed a positive response toward a firm or its stock. For example, sentiment related to profit, improve-ments, innovativeness, new concepts, and about 200 other words were related to business progress.Negative sentimentwas classified through variables that showed a negative response or opposition to
something in a firm’s business, operations or strategy. Examples include sentiment on the likelihood of a recession, faulty products, or lagging profitability, and 184 other words associated with busi-ness impediments.Table 2shows the descriptive statistics for the panel dataset.19
4.2. Empirical modeling
The empirical modeling and estimation process that was used involves a number of steps. First,feasible generalized least squares
(FGLS), used to resolve error term issues that characterize this and other similar settings (Amemiya, 1985; Kmenta, 1986), was applied to estimate stock-trading volume. Second, panel vector autoregression(PVAR) was used for capturing the impact of exoge-nous changes in endogeexoge-nous variables on the other variables in a PVAR system of equations. In this applied setting, an endogenous relationship between stock trading volumes and social sentiment was hypothesized to exist. This led to the use of a Granger causality test for the estimation of the PVAR system (Abrigo and Love, 2015). The estimates derived from PVAR are seldom interpreted in isola-tion (Canova and Ciccarelli, 2013).
Third,kernel regularized least squares(KRLS) was used in place of
generalized least squares(GLS), a method which imposes stringent assumptions that sometimes are not accurate for data in real-world settings. One such assumption is that the marginal effects of the explanatory variables are constant (Sekhon, 2009). GLS fur-ther assumes that observations with similar values of their vari-ables should have similar marginal impacts on the dependent variable of a model on average. This reduces misspecification, and avoids the need for users to guess the functional form to be used (Amemiya, 1985).
KRLS, in contrast, is a recent advance with respect to GLS’s han-dling of functional form issues. KRLS uses regularization, which emphasizes a prior preference for the estimation of a smoother functional form over a more erratic functional form for the model (Hainmueller and Hazlett, 2013). As a result, KRLS is able to mini-mize over-fitting the model by reducing the variance and fragility of the estimates, and diminishing the influence of inappropriate points. Similar to GLS, it also is suitable when the functional form of the model is unknown.
The following mathematical model was specified to account for unobserved fixed effects related to each firmiinvolved and the period of timet.
Table 2
Descriptive statistics.
Variable Mean Std. Dev. Min. Max.
Frequency 198.75 778.70 0 31,224
Positive 52.73 182.57 0 4,623
Negative 18.95 171.70 0 18,928
Note:There are 17,068 observation in this dataset, for each of the descriptive variables,Frequency,PositiveandNegative.
16
DaumSoft is an Internet portal that analyzes data on social media and issues. It is known for mining user interest-related words for marketing strategy in various business settings.
17
For example, the social metrics are able to analyze the text of stories in social media for the word ‘‘iPhone,” what related topics are being talked about (e.g., new products, performance, or problems, and what topics they represent. This yields a
topic flow diagramfor the word ‘‘iPhone” rather than the number of messages or tweets about it.
18
For additional information on opinion mining for the stock-trading context, the interested reader should seeDas and Chen (2007), which covers: web data scrapers and helper applications for message parsing and data handling; data pre-processing and classification algorithms, multiple data-related sources (stock data, data dictionary and word lexicon, and grammar information), as well as classified messages and statistical summation.
19
The blog posts and tweets were not separated; instead, they were combined all together. The statistical estimates suggest that there was a good fit for the data based on standard model selection criteria. This was done via thev2
distribution, and a check for multicollinearity withvariance inflation factors(VIF) andcondition indices
(CI) due to use of multi-period panel dataset rather than a one-period cross-sectional dataset for this. These diagnostics suggested the data were appropriate for our analysis.
StockTradingVolumeit¼b0þbIndustryLevelðDummy variables: Sizet; Industryt; MarkettÞ þbIndustryLevelðNormal returns: MarketTradingVolumetÞ þbFirmLevelðCommon factors: Frequencyit; Cumulati
v
eitÞ þbFirmLevelðSocial sentiment: Posit; Negit; CumulitÞ þuiðUnobserved fixed effects for firmiÞþ
l
tðUnobserved fixed effects for timetÞþ
e
itðErrorsÞwithe
it¼qe
i;t1þ/itand/itNð0;r
2Þ4.3. Explanatory empirical results
First obtained were results on the impact of social media senti-ment on stock-trading volume based on the FGLS model, as shown in Fig. 2. The results suggest that traders who transacted with mobile phones seemed to have been more easily swayed by social media sentiment. In contrast, the influence of social sentiment at the market level probably affected stock-trading in the traditional channel more.
The results that were obtained show the direction of causality based on a PVAR-based Granger causality test, as shown inTable 3. Social sentiment appears to have been a driver of causality, as one may expect. Social sentiment played a role in driving the observed stock-buying behavior of mobile phone-based traders, but there was less of an effect from social sentiment with respect to stock-selling behavior.20Next obtained were the KRLS data regu-larities results, as shown inFig. 3.
The graphical presentation of the coefficient estimates shows that mobile phone-channel traders did more negative feedback trading in response to daily social sentiment for buying (b= 2.47,
p< 0.01), though this effect was not significant for selling stocks (b=2.16,p> 0.10). They tended to buy stocks when negative sen-timent increased, and appear to have sold stocks when positive sentiment increased. This behavior of mobile-phone channel tra-ders seems to go against the typical positive feedback trading strat-egy that has been often observed. The effects of sentiment trends that develop over time – one week of accumulated sentiment in this research – did not produce results with coefficient values that were very positive or negative though.
What makes this fusion analytics work relevant in the policy analytics context is that the results describe unusual feedback trading due to the inappropriate processing of social sentiment and opinions on the value of stocks and companies. This may be problematic from a regulatory point of view. The common wisdom is that no specific channel – whether making trades through a human broker by phone or in person, or via an e-trading software system on a home computer near to the market or distant from it – should be disadvantaged in the completion of fair trades for the investors who initiate them. Yet if buying and selling stock in the mobile phone-based channel leads to over-reacting investors due to the rapid dissemination of social sentiment, such uninformed Fig. 2.Stock trade volume estimation results.
Table 3
Granger causality for panel data vector autoregression results.
Variables Traditional channelstock trade volume Mobile channeltrade volume(buying) Mobile channeltrade volume(selling)
Volume All 15.18* 36.06*** 34.18*** Frequency Volume 28.01*** 5.62 27.13*** Positive Volume 27.79*** 4.76 21.12*** Negative Volume 9.26** 0.74 15.50***
Note:251 firms. Variables represent % changes. Signif.:*
=p< 0.1;**
=p< 0.05;***
=p< 0.01.
20
Our utilization of measures for buying and selling behavior separately is related to individual trader actions, and how individuals may be differently influenced by social sentiment, depending on what they want to do. Market volume, in contrast, measures trades made in the entire market, so that for every bid that is made for stock, there must also be an offer to sell the stock. And so there is this tie-in between them.
trading behavior and the systematic losses that occur may become the subject of regulatory and governmental scrutiny.
5. Music semantics and the duration of music track popularity
Achieving a deeper understanding of how music popularity works in social environment has been of significant interest in industry and academia over the years. The research described in this section combines Machine Learning methods for analyzing music semantics, including an LDA topic model (Blei et al., 2003), with classification and prediction. Music semantics, Machine Learning methods, and explanatory empirics enable a new way to model, understand and interpret the top-chart ranking popular-ity of music tracks, compared to prior research. (Appendix A,
Table A1, again, summarizes the fusion analytics research frame-work dimensions, and it will support the reader’s understanding of why this research is a representative illustration.)
5.1. Context, data acquisition and observations on the dependent variables
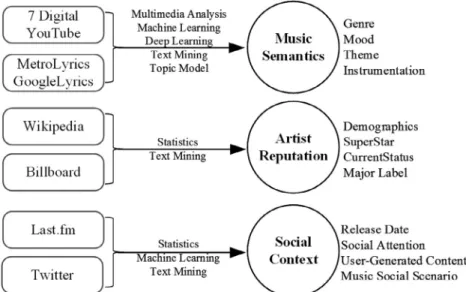
Social networks, as a new medium for music distribution, have changed listener behavior dramatically by easing communication and music sharing among listeners. Music is adurable information goodthat can bring value and utility to the music industry and lis-teners, and social media to enhance the effects. Even one hit song can lead to the rise of a new music superstar. And classic songs can prompt people to remember singers years after their hit songs were released. This has led to more business value in the music industry, in spite of the impacts of artist-led music production, easier availability of online tracks and videos, and the transforma-tion of the industry’s value chain (Bockstedt et al., 2005). As a result, large and small music labels have paid increasing attention to how music can be promoted by social networks. Beyond CD sales, they now have partnerships with YouTube and Baidu, for example, to boost their digital sales through enhanced promotion (IFPI, 2012, 2013, 2015). By emphasizing precursors of high popu-larity, it is possible to discover digital traces of how a song became popular, and predict music superstars. Data were collected using extensive machine-base methods to make this possible, as shown inFig. 4.
Multiple CS studies have examined how to gauge the impor-tance of music acoustics and the content of the lyrics (Dhanaraj and Logan, 2005; Ni et al., 2011; Lee and Lee, 2015). Social Science, in contrast, has paid more attention to artist and album popularity,
and non-musical factors, including Artist Reputation and super-stardom, major label association, date of track release, P2P sharing activities, and social media buzz (Hamlen, 1991; Bhattacharjee et al., 2007; Grace et al., 2008; Strobl and Tucker, 2000). The pre-sent research supplements these factors with more fine-grained music semantics factors to provide fuller information about the drivers of the duration of music popularity in Last.fm.
Music in social networks often has considerable staying power when it achieves popularity over time and appeals to audience tastes. Assessment of the sustainability of music popularity online can be accomplished by modeling thenumber of weeks duration
that a music track stays on thetop-chart ranking listbefore drop-ping off. It is also possible to analyze variables and higher-level constructs that determine the popularity of music online.21 The empirical modeling approach views the duration of a track’s popu-larity on Last.fm in terms of three events:track release;rise to top-rank chart listing; and thenchart drop-off. The last two measures in this process reflect the performance of a specific music track. Dura-tionis the time that ensues from when the track reaches top-rank until it drops off. AndTime2TopRank is the time from release to the track’s first ranking among top-ranked songs. These measures represent how quickly and how long a track appeals to audience tastes.
For the empirical analysis of track popularity-related top-rank chart duration, 421 left-censored and 108 right-censored tracks were removed. Overall, 3,881 tracks by 477 music artists were used in the analysis.Fig. 5depicts the empirical regularities. The bottom right shows a log distribution of music track top-rank chart list duration. Compared with the whole dataset, when censored data were removed, a smoother Gaussian distribution emerged, with a skewness of 0.42, and a kurtosis of 2.45.
The music social network under investigation, Last.fm, made it possible to collect many variables for higher-level constructs that include possible determinants of music popularity. For example, controls were included to capture differences in the music market-place and the developing sophistication of Last.fm as a music social network. Beyond the duration popularity analysis, this research
Note. The word Effectunder the four pairs of bars indicates the effects of positive or negative sentiment.
Fig. 3.KRLS results for social sentiment in the mobile phone-based channel.
21
This was possible through the collection of data from Last.fm’s Weekly Listening Chart, where social network members report what they listen to. This longitudinal study employs data from February 2005 to May 2015 on the top-150 music tracks and week-by-week rankings on the chart. The data cover 532 weeks and 12+ million music tracks. Few music tracks made it the top-150 chart though: just 4,410 tracks or 0.04% of the total: again, an instance of a ‘‘data needle in a haystack” (Chang et al., 2014).
also considered popularity patterns based on Duration and
Time2TopRank.
5.2. Machine-based methods for data collection and extraction
Data collected from multiple sources were extracted and structured into three high-level constructs:Music Semantics,Artist ReputationandSocial Context, as shown inTable 4.
5.2.1. Music Semantics
Representing the perceptual fundamentals of music tracks that attract listeners is a challenge. There are two parts to consider:
acoustic contentand thelyrics. People characterize music content through the use of well-known music semantic topics: Mood,
Genre,Theme, andInstrumentation. The measures associated with these semantic concepts reflect how listeners perceive a music track’s content. To learn the semantics of music tracks, Machine Fig. 4.Machine-based data collection/extraction methods for the Last.fm project.
Note. The top row shows music track popularity Durationand Time2TopRank for tracks in weeks. The left
for the entire dataset (obs.= 4,410), and the right illustrates the similarity of the distributions after censored data were removed (obs.= 3,881). This is a robustness check that ensures data appropriateness.
Fig. 5.Raw and logarithmic distributions of popularity duration in weeks for music tracks.
Table 4
Music semantic topics and variables acquired with machine-based analytics.
Semantic topics Variables acquired
Genre(18) Rock, Alternative, Indie, Pop, HipHop, Rap, Electronic, Metal, Folk, Soul, Blues, Country, R&B, Punk, Classic, Jazz, Experimental, Reggae Instrumentation(12) Cello, Guitar, Drumkit, Violin, Piano, Tuba, Flute, Clarinet, Saxophone, Trombone, Trumpet, Snare
Mood(5) Passionate, Lively, Brooding, Humorous, Intense
Theme(5) Life, Dance, Passion (We, like, dance, young, live, good, sweet, dream)
In Love, Relationships(You, love, like, baby, wanna, need, girl, feel)
Soul (Eyes, heart, soul, fall, cold, dark, blue, blood, left)
Sad Life, Love (Back, alone, long, over, wrong, lost, leave, remember)
Anger, Hostility (Like, fuck, shit, rock, bitch, fucking, hit, damn)