D. Bustard, W. Liu, and R. Sterritt (Eds.): Soft-Ware 2002, LNCS 2311, pp. 60–73, 2002. © Springer-Verlag Berlin Heidelberg 2002
Web Sites
Jianhan Zhu, Jun Hong, and John G. Hughes
School of Information and Software Engineering, University of Ulster at Jordanstown Newtownabbey, Co. Antrim, BT37 0QB, UK
{jh.zhu, j.hong, jg.hughes}@ulst.ac.uk
Abstract. The large number of Web pages on many Web sites has raised
navigational problems. Markov chains have recently been used to model user navigational behavior on the World Wide Web (WWW). In this paper, we propose a method for constructing a Markov model of a Web site based on past visitor behavior. We use the Markov model to make link predictions that assist new users to navigate the Web site. An algorithm for transition probability matrix compression has been used to cluster Web pages with similar transition behaviors and compress the transition matrix to an optimal size for efficient probability calculation in link prediction. A maximal forward path method is used to further improve the efficiency of link prediction. Link prediction has been implemented in an online system called ONE (Online Navigation Explorer) to assist users’ navigation in the adaptive Web site.
1 Introduction
In a Web site with a large number of Web pages, users often have navigational questions, such as, Where am I? Where have I been? and Where can I go? [10]. Web browsers, such as Internet Explorer, are quite helpful. The user can check the URI address field to find where they are. Web pages on some Web sites also have a hierarchical navigation bar, which shows the current Web location. Some Web sites show the user’s current position on a sitemap. In IE 5.5, the user can check the history list by date, site, or most visited to find where he/she has been. The history can also be searched by keywords. The user can backtrack where he/she has been by clicking the “Back” button or selecting from the history list attached to the “Back” button. Hyperlinks are shown in a different color if they point to previously visited pages.
We can see that the answers to the first two questions are satisfactory. To answer the third question, what the user can do is to look at the links in the current Web page. On the other hand, useful information about Web users, such as their interests indicated by the pages they have visited, could be used to make predictions on the pages that might interest them. This type of information has not been fully utilized to provide a satisfactory answer to the third question. A good Web site should be able to help its users to find answers to all three questions. The major goal of this paper is to provide an adaptive Web site [11] that changes its presentation and organization on the basis of link prediction to help users find the answer to the third question.
In this paper, by viewing the Web user’s navigation in a Web site as a Markov chain, we can build a Markov model for link prediction based on past users’ visit behavior recorded in the Web log file. We assume that the pages to be visited by a user in the future are determined by his/her current position and/or visiting history in the Web site. We construct a link graph from the Web log file, which consists of nodes representing Web pages, links representing hyperlinks, and weights on the links representing the numbers of traversals on the hyperlinks. By viewing the weights on the links as past users’ implicit feedback of their preferences in the hyperlinks, we can use the link graph to calculate a transition probability matrix containing one-step transition probabilities in the Markov model.
The Markov model is further used for link prediction by calculating the conditional probabilities of visiting other pages in the future given the user’s current position and/or previously visited pages. An algorithm for transition probability matrix compression is used to cluster Web pages with similar transition behaviors together to get a compact transition matrix. The compressed transition matrix makes link prediction more efficient. We further use a method called Maximal Forward Path to improve the efficiency of link prediction by taking into account only a sequence of maximally connected pages in a user’s visit [3] in the probability calculation. Finally, link prediction is integrated with a prototype called ONE (Online Navigation Explorer) to assist Web users’ navigation in the adaptive Web site.
In Section 2, we describe a method for building a Markov model for link prediction from the Web log file. In Section 3, we discuss an algorithm for transition matrix compression to cluster Web pages with similar transition behaviors for efficient link prediction. In Section 4, link prediction based on the Markov model is presented to assist users’ navigation in a prototype called ONE (Online Navigation Explorer). Experimental results are presented in Section 5. Related work is discussed in Section 6. In Section 7, we conclude the paper and discuss future work.
2 Building Markov Models from Web Log Files
We first construct a link structure that represents pages, hyperlinks, and users’ traversals on the hyperlinks of the Web site. The link structure is then used to build a Markov model of the Web site. A traditional method for constructing the link structure is Web crawling, in which a Web indexing program is used to build an index by following hyperlinks continuously from Web page to Web page. Weights are then assigned to the links based on users’ traversals [14]. This method has two drawbacks. One is that some irrelevant pages and links, such as pages outside the current Web site and links never traversed by users, are inevitably included in the link structure, and need to be filtered out. Another is that the Webmaster can set up the Web site to exclude the crawler from crawling into some parts of the Web site for various reasons. We propose to use the link information contained in an ECLF (Extended Common Log File) [5] format log file to construct a link structure, called a link graph. Our approach has two advantages over crawling-based methods. Only relevant pages and links are used for link graph construction, and all the pages relevant to users’ visits are included in the link graph.
2.1 Link Graphs
A Web log file contains rich records of users’ requests for documents on a Web site. ECLF format log files are used in our approach, since the URIs of both the requested documents and the referrers indicating where the requests came from are available. An ECLF log file is represented as a set of records corresponding to the page requests, WL={(
e e
1,
2,...,
e
m)}, wheree e
1,
2,...,
e
m are the fields in each record. A record in an ECLF log file might look like as shown in Figure 1:Fig. 1. ECLF Log File
The records of embedded objects in the Web pages, including graphical, video, and audio files, are treated as redundant requests and removed, since every request of a Web page will initiate a series of requests of all the embedded objects in it automatically. The records of unsuccessful requests are also discarded as erroneous records, since there may be bad links, missing or temporarily inaccessible documents, or unauthorized requests etc. In our approach, only the URIs of the requested Web page and the corresponding referrer are used for link graph construction. We therefore have a simplified set WL ={(r
r u
,
)}, where r and u are the URIs of the referrer andthe requested page respectively. Since various users may have followed the same links in their visits, the traversals of these links are aggregated to get a set
s
WL ={(
r u w
, ,
)}, where w is the number of traversals from r to u . In most cases alink is the hyperlink from r to u . When “-“ is in the referrer field, we assume there is
a virtual link from “-“ to the requested page. We call each element (
r u w
, ,
) in the set a link pair. Two link pairs l =( ,i r u w ) and i i, i l =(jr u w
j,
j,
j) are said to be connected if and only if r =ir
j, r =iu
j, u =ir
j, or u =iu
j. A link pair set LS ={( ,m r u w )} isi i, i said to connect to another link pair set LS ={(nr u w
j,
j,
j)} if and only if for every link pair lj∈
LS , there exists a link pair n li∈
LS , so that m l and i l are connected.jDefinition 2.1 (Maximally connected Link pair Set) Given a link pair set s
WL ={(
r u w
j,
j,
j)}, and a link pair set LS ={( ,m r u w )}i i, i⊂
WL , we saysn
LS ={( ,r u w )}l l, l
⊂
WL is the Maximally connected Link pair Set (MLS) of s LSmon WL if and only if s LS connects to m LS , and for every link pair n lj
∈
(WL -s LS ),n{l } and j LS are not connected.m
For a Web site with only one major entrance, the homepage, people can come to it in various ways. They might come from a page on another Web site pointing to the homepage, follow a search result returned by a search engine pointing to the
177.21.3.4 - - [04/Apr/1999:00:01:11 +0100] "GET /studaffairs/ccampus.html HTTP/1.1" 200 5327 "http://www.ulst.ac.uk/studaffairs/accomm.html" "Mozilla/4.0 (compatible; MSIE 4.01; Windows 95)"
homepage. “-” in the referrer field of a page request record indicates that the user has typed in the URI of the homepage directly into the address field of the browser, selected the homepage from his/her bookmark, or clicked on a shortcut to this homepage. In all these cases the referrer information is not available. We select a set of link pairs LS ={(0 r u w )}, where i, 0, i r is “-“, the URI of a page on another Webi
site, or the URI of a search result returned by a search engine, u is the URI of the0
homepage, and
w
i is the weight on the link, as the entrance to the hierarchy. We then look for the Maximally connected Link pair Set (MLS) LS of 1 LS in 0 WL -s LS to0form the second level of the hierarchy. We look for LS of 2 LS in 1 WL -s LS -0 LS .1
This process continues until we get LS , so that k WL -s
0 k i i LS =
∑
={} or LSk+1={}. For a Web site with a single entrance, we will commonly finish the link graph construction with (WL -s 0 k i i LS =∑
)={}, which means that every link pair has been put onto a certain level in the hierarchy. The levels in the hierarchy are from LS to 0 LS .kFor a Web site with several entrances, commonly found in multi-functional Web sites, the construction will end with LSk+1={} while (WL -s
0 k i i LS =
∑
)≠
{}. We can then select a link pair set forming another entrance from (WL -s0 k i i LS =
∑
) to construct a separate link graph.Definition 2.2 (Link Graph) The link graph of WL , a directed weighted graph, is as
hierarchy consisting of multiple levels, LS ,…,0 LS ,…,i LS , wherek
0 LS ={(r u w )}, 0, 0, 0 LS is the MLS of i LSi−1 in WL -s 1 0 i j j LS − =
∑
, and WL -s 0 k j j LS =∑
={} or LSk+1={}.We add the “Start” node to the link graph as the starting point for the user’s visit to the Web site and the “Exit” node as the ending point of the user’s visit. In order to ensure that there is a directed path between any two nodes in the link graph, we add a link from the “Exit” node to the “Start” node. Due to the influence of caching, the amount of weights on all incoming links of a page might not be the same as the amount of weights on all outgoing links. To solve this problem, we can either assign extra incoming weights to the link to the start/exit node or distribute extra outgoing weights to the incoming links.
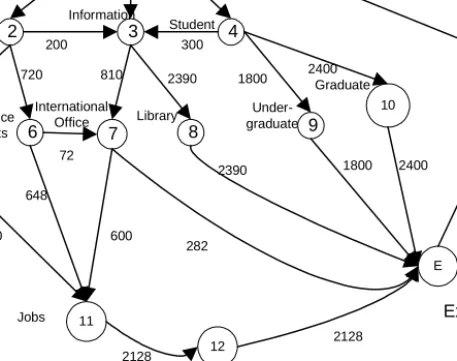
Figure 2 shows a link graph we have constructed using a Web log file at the University of Ulster Web site, in which the title of each page is shown beside the node representing the page.
Fig. 2. A Link Graph Constructed from a Web Log File on University of Ulster Web Site
2.2 Markov Models
Each node in the link graph can be viewed as a state in a finite discrete Markov model, which can be defined by a tuple <
S
, Q ,L
>, whereS
is the state space containing all the nodes in the link graph, Q is the probability transition matrix containing one-step transition probabilities between the nodes, andL
is the initial probability distribution on the states inS
. The user’s navigation in the Web site can be seen as a stochastic process {X }, which has nS
as the state space. If the conditional probability of visiting pagej
in the next step,P
i j,(m), is dependent only on the last m pages visited by the user, {X } is called a m -order Markov chain [8].nGiven that the user is currently at page
i
and has visited pages in−1, ...,i0,P
i j,(m) is only dependant on pagesi
, in−1, ...,in m− +1. ( ) , m i jP
=P X( n+1= j X| n =i X, n−1 =in−1, ...,X0 =i0) = 1 1 1 1 1 ( n | n , n n , ..., n m n m ) P X + = j X =i X − =i− X − + =i− + (1) 1 2 3 4 5 6 7 8 9 10 11 9000 1800 2700 4500 810 880 720 880 648 600 2128 282 2390 1800 2400 1800 2390 2400 72 University of Ulster Department Information Student CS Science &Arts International Office Library Under-graduate Graduate Jobs 200 300 S E 9000 Start Exit 12 2128 Registerwhere the conditional probability of Xn+1 given the states of all the past events is equal to the conditional probability of Xn+1 given the states of the past m events.
When m =1, Xn+1 is dependent only on the current state X . n
P
i j, =P
i j,(1) = P X( n+1= j X| n =i) is an one-order Markov chain, whereP
i j, is the probability that a transition is made from statei
to statej
in one step.We can calculate the one-step transition probability from page
i
to pagej
using a link graph as follows, by considering the similarity between a link graph and a circuit chain discussed in [7]. The one-step transition probability from pagei
to pagej
,, i j
P
, can be viewed as the fraction of traversals fromi
toj
over the total number of traversals fromi
to other pages and the “Exit” node., i j
P
= P X( n+1= j X| n =i X, n−1 =in−1, ...,X0 =i0)= P X( n+1= j X| n =i)= , , i j i k k w w∑
(2)where
w
i j, is the weight on the link fromi
toj
, andw
i k, is the weight on a link fromi
tok
. Now a probability transition matrix, which represents the one-step transition probability between any two pages, can be formed. In a probability transition matrix, rowi
contains one-step transition probabilities formi
to all states. Rowi
sums up to 1.0. Columni
contains one-step transition probabilities from all states toi
. The transition matrix calculated from the link graph in Figure 2 is shown in Figure 3. 1 2 3 4 5 6 7 8 9 10 11 12 1 0.2 0.3 0.5 2 0.111 0.489 0.4 3 0.253 0.747 4 0.067 0.4 0.533 5 1.0 6 0.1 0.9 7 0.68 0.32 8 1.0 9 1.0 10 1.0 11 1.0 12 1.0 1.0 1.0 \PagePage Exit Start
Exit Start
3 Transition Matrix Compression
An algorithm, that can be used to compress a sparse probability transition matrix, is presented in [15] while the transition behaviors of the Markov model are preserved. States with similar transition behaviors are aggregated together to form new states. In link prediction, we need to raise the transition matrix Q to the n th power. For a large
Q this is computationally expensive. Spears’ algorithm can be used to compress the
original matrix Q to a much smaller matrix Q without significant errors since thec
accuracy experiments on large matrices have shown that
Q
cn and(
Q
n)
c are very close to each other. Since the computational complexity of Q is n O N( 3), by dramatically reducingN
, the time taken by compression can be compensated by all subsequent probability computations for link prediction [15]. We have used Spear’s algorithm in our approach. The similarity metric of every pair of states is formed to ensure those pairs of states that are more similar should yield less error when they are compressed [15]. Based on the similarity metric in [15], the transition similarity of two pagesi
andj
is a product of their in-link and out-link similarities. Their in-link similarity is the weighted sum of distance between columni
and columnj
at each row. Their out-link similarity is the sum of distance between rowi
and rowj
at each column., ,
(
)
,(
)
i j i j i j
Sim
=
Sim
out
−
link
×
Sim
in link
−
,
(
)
,( )
i j y i j
Sim
out
−
link
=
∑
α
y
,
(
)
,( )
i j x i jSim
in link
−
=
∑
β
x
,( )
i jy
α
=
|
P
i y,−
P
j y,|
,( )
i jx
β
= i x j, j x i, i jm
P
m
P
m
m
×
−
×
+
, i l l im
=
∑
P
, j l j, lm
=
∑
P
(3)where m and i
m
j are the sums of the probabilities on the in-links of pagei
andj
respectively,Sim
i j,(
out
−
link
)
is the sum of the out-link probability difference betweeni
andj
,Sim
i j,(
in link
−
)
is the sum of in-link probability difference betweeni
andj
.For the transition matrix in Figure 3, the calculated transition similarity matrix is shown in Figure 4.
If the similarity is close to zero, the error resulted from compression is close to zero [15]. We can set a threshold
ε
, and letSim
i j, <ε
to look for candidate pages for merging.1 2 3 4 5 6 7 8 9 10 11 12 1 0.00 2 0.58 0.00 3 1.29 0.21 0.00 4 1.24 0.00 0.36 0.00 5 1.31 0.57 0.74 0.99 0.00 6 1.14 0.53 0.60 0.89 0.00 0.00 7 1.04 0.51 0.81 0.83 0.26 0.24 0.00 8 1.71 0.63 1.17 1.20 1.18 1.04 0.18 0.00 9 1.14 0.53 0.75 0. \Page
Page Exit Start
89 0.88 0.80 0.51 0.00 0.00 10 1.39 0.58 0.87 1.03 1.02 0.91 0.58 0.00 0.00 0.00 11 2.88 0.74 1.61 1.68 1.64 1.38 0.89 2.32 1.39 1.77 0.00 12 2.00 0.67 1.29 1.33 1.31 1.14 0.71 0.00 0.00 0.00 2.88 0.00 3.25 0.76 1.72 1.79 1.75 1.46 1.31 2.55 1.46 Exit 1.90 5.98 3.25 0.00 2.00 0.67 1.29 1.33 1.31 1.14 1.04 1.71 1.14 1.39 2.88 2.00 3.25 0.00 Start
Fig. 4. Transition Similarity Matrix for Transition Matrix in Fig. 3 (Symmetric)
By raising
ε
we can compress more states with a commensurate increase in error. Pages sharing more in-links, out-links, and having equivalent weights on them will meet the similarity threshold. Suppose statesi
andj
are merged together, we need to assign transition probabilities between the new statei
∨
j
and the remaining statek
in the transition matrix. We compute the weighted average of thei
th andj
th rows and place the results in the row of statei
∨
j
, and sum thei
th andj
th columns and place the results in the column of statei
∨
j
., , , k i j k i k j
P
∨=
P
+
P
, , , i i k j j k i j k i jm
P
m
P
P
m
m
∨×
+
×
=
+
(4)For the similarity matrix in Figure 4, we set the similarity threshold
ε
=0.10. Experiments indicated a value of ε between 0.08 and 0.15 yielded good compression with minimal error for our link graph. The compression process is shown in Figure 5. States 2 and 4, 5 and 6 are compressed as a result ofSim
i j,(
in link
−
)
=0, states 8, 9,10 and 12 are compressed as a result of
Sim
i j,(
out
−
link
)
=0.The compressed matrix is shown in Figure 6. The compressed matrix is denser than the original transition matrix.
When either
Sim
i j,(
out
−
link
)
=0 orSim
i j,(
in link
−
)
=0, the compression will result in no error:Error
i j,=
0
andQ
cn=(
Q
n)
c [15]. So there is no compression error for the transition matrix in Figure 4 and its compressed matrix in Figure 6. There may not always be the case for a transition matrix calculated from another link graph. WhenSim
i j, is below a given threshold, the effect of compression on the transitionbehavior of the states (
(
Q
n)
c−
Q
cn) will be controlled, the transition property of the matrix is preserved and the system is compressed to an optimal size for probability computation. The compressed transition matrix is used for efficient link prediction.Fig. 5. Compression Process for Transition Matrix in Fig. 3
1 (2, 4) 3 (5, 6) 7 (8, 9,10,12) 11 1 0.7 0.3 (2, 4) 0.08 0.25 0.67 3 0.25 0.75 (5, 6) 0.04 0.96 7 0.68 0.32 (8, 9,10,12) 1.0 11 1.0 1.0 1.0 \Page
Page Exit Start
Exit Start
Fig. 6. Compressed Transition Matrix for Transition Matrix in Figure 3
4 Link Prediction Using Markov Chains
When a user visits the Web site, by taking the pages already visited by him/her as a history, we can use the compressed probability transition matrix to calculate the probabilities of visiting other pages or clusters of pages by him/her in the future. We view each compressed state as a cluster of pages. The calculated conditional probabilities can be used to estimate the levels of interests of other pages and/or clusters of pages to him/her.
4.1 Link Prediction on M-Order N-Step Markov Chains
Sarukkai [14] proposed to use the “link history” of a user to make link prediction. Suppose a user is currently at page
i
, and his/her visiting history as a sequence of mpages is {i− +m1,i− +m 2, ..., }i0 . We use vector L =0
{ }
l
j , wherel
j=1 whenj
=
i
and jl
=0 otherwise, for the current page, and vectors L =k{ }
k j
l
(k
= −
1, ...,
− +
m
1
),Compressed state 4 into state 2 (similarity 0.000000)(states: 2 4) Compressed state 6 into state 5 (similarity 0.000000)(states: 5 6) Compressed state 9 into state 8 (similarity 0.000000)(states: 8 9) Compressed state 12 into state 10 (similarity 0.000000)(states: 10 12) Compressed state 10 into state 8 (similarity 0.000000)(states: 8 9 10 12) Finished compression.
where
1
k jl
=
when j =k i and k0
k jl
=
otherwise, for the previous pages. These history vectors are used together with the transition matrix to calculate vector Re c1 for the probability of each page to be visited in the next step as follows:1
Re c =
a
1× × + ×
L
0Q
a
2L
−1×
Q
2+ +
...
a
m×
L
− +m 1×
Q
m (5) where a a1, 2, ...a are the weights assigned to the history vectors. The values ofm1, 2, ... m
a a a indicate the level of influence the history vectors have on the future.
Normally, we let 1>a1>a2 > >... am>0, so that the closer the history vector to the present, the more influence it has on the future. This conforms to the observation of a user’s navigation in the Web site. Re c ={1
rec
j} is normalized, and the pages with probabilities above a given threshold are selected as the recommendations.We propose a new method as an improvement to Sarukkai’s method by calculating the possibilities that the user will arrive at a state in the compressed transition matrix within the next n steps. We calculate the weighted sum of the possibilities of arriving at a particular state in the transition matrix within the next n steps given the user’s history as his/her overall possibility of arriving at that state in the future. Compared with Sarukkai’s method, our method can predict more steps in the future, and thus provide more insight into the future. We calculate a vector Rec representing then
probability of each page to be visited within the next n steps as follows:
Rec =n
a
1,1× × +
L
0Q
a
1,2× ×
L
0Q
2+ +
...
a
1,n× ×
L
0Q
n+ 2 3 1 2,1 1 2,2 1...
2, 1 n na
×
L
−×
Q
+
a
×
L
−×
Q
+ +
a
×
L
−×
Q
+ +…+ 1 1 1,1 1 1,2 1...
1, 1 m m m n m m m m m n ma
−×
L
− +×
Q
−+
a
−×
L
− +×
Q
+ +
a
−×
L
− +×
Q
+ − (6)where
a
1,1,
a
1,2,...,
a
1,n,...,
a
m−1,1,
a
m−1,2,...,
a
m−1,n are the weights assigned to the history vectors L ,…,0 L− +m1 in 1,2,…,n ,…,m
−
1
,m
…,m
+ −
n
1
steps into the future, respectively. Normally, we let 1>a
k,1>
a
k,2> >
...
a
k m, >0 (k
=1,2,…,m ), sothat for each history vector, the closer its transition to the next step, the more important its contribution is. We also let 1>
a
1,l>
a
2,l> >
...
a
m l, >0 (l
=1,2,…,n ), so that the closer the history vector to the present, the more influence it has on the future. Rec ={nrec
j} is normalized, and the pages with probabilities above a given threshold are selected as the recommendations.4.2 Maximal Forward Path Based Link Prediction
A maximal forward path [3] is a sequence of maximally connected pages in a user’s visit. Only pages on the maximal forward path are considered as a user’s history for
link prediction. The effect of some backward references, which are mainly made for ease of travel, is filtered out. In Fig. 3, for instance, a user may have visited the Web pages in a sequence 1
→
2→
5→
2→
6. Since the user has visited page 5 after page 2 and then gone back to page 2 in order to go to page 6, the current maximal forward path of the user is: 1→
2→
6. Page 5 is discarded in the link prediction.5 Experimental Results
Experiments were performed on a Web log file recorded between 1st
and 14th
of October, 1999 on the University of Ulster Web site, which is 371 MB in size and contains 2,193,998 access records. After discarding the irrelevant records, we get 423,739 records. In order to rule out the possibility that some links are only interesting to individual users, we set a threshold as the minimum number of traversals on each hyperlink as 10 and there must be three or more users who have traversed the hyperlink. We assume each originating machine corresponds to a different user. These may not always be true when such as proxy servers exist. But in the absence of user tracking software, the method can still provide rather reliable results. We then construct a link graph consisting of 2175 nodes, and 3187 links between the nodes. The construction process takes 26 minutes on a Pentium 3 desktop, with a 600 MHz CPU, 128M RAM. The maximum number of traversals on a link in the link graph is 101,336, which is on the link from the “Start” node to the homepage of the Web site. The maximum and average numbers of links in a page in the link graph are 75 and 1.47 respectively. The maximum number of in-links of a page in the link graph is 57.
The transition matrix is 2175
×
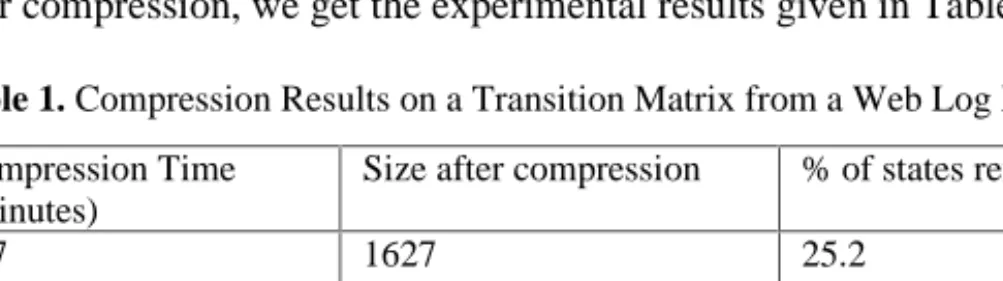
2175 and very sparse. By setting six different thresholds for compression, we get the experimental results given in Table 1:Table 1. Compression Results on a Transition Matrix from a Web Log File
ε
Compression Time (Minutes)Size after compression % of states removed
0.03 107 1627 25.2 0.05 110 1606 26.2 0.08 118 1579 27.4 0.12 122 1549 28.8 0.15 124 1542 29.1 0.17 126 1539 29.2
We can see that when
ε
increases, the matrix becomes harder to compress. For this matrix, we chooseε
=0.15 for a good compression rate without significant error. Experiments in [15] also show that a value ofε
=0.15 yielded good compression with minimum errors. Now we calculateQ
c2 and use the time spent as the benchmark form c
Q
. Since we can repeatedly multiplyQ
c2 by Q to get cQ
c2, …, 1 m cQ
− ,Q
cm, the time spent for computingQ
c2,…,Q
cm−1,Q
cm can be estimated as them
−
1
time of the time forQ
c2. Table 2 summarises the experimental results of computation for2 c
Q
. We can see that the time needed for compression is compensated by the time saved in the computation for Qc2. When calculating Qm, computational time can be further reduced. 2Q ,…, m
Q can be computed off-line and stored for link prediction. So the response time is not an issue given the fast developing computational capability of the Web servers.
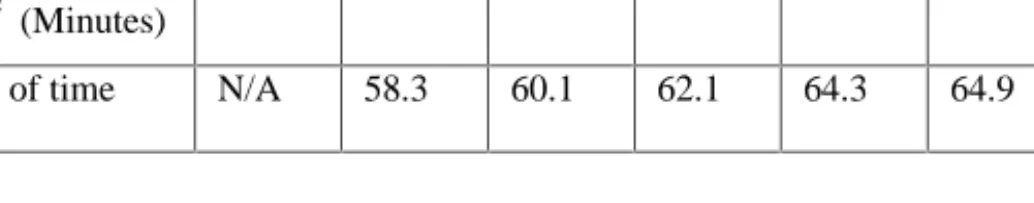
Table 2. Experimental Results for Q2 and Qc2
Matrix Dimension(2) 2175 1627 1606 1579 1549 1542 1539 Computation Time for
2 Q or Qc2 (Minutes) 1483 618 592 561 529 521 518 Percentage of time saved (%) N/A 58.3 60.1 62.1 64.3 64.9 65.1
We then use the compressed transition matrix for link prediction. Link prediction is integrated with a prototype called ONE (Online Navigation Explorer) to assist users’ navigation in our university Web site. ONE provides the user with informative and focused recommendations and the flexibility of being able to move around within the history and recommended pages. The average time needed for updating the recommendations is under 30 seconds, so it is suitable for online navigation, given the response can be speeded up with the current computational capability of many commercial Web sites. We selected m =5 and n =5 in link prediction to take into account five history vectors in the past and five steps in the future. We computed
2
Q ,…, 9
Q for link prediction.
The initial feedback from our group members is very positive. They have spent less time to find interested information using ONE than not using ONE in our university Web site. They have more successfully found the information useful to them using ONE than not using ONE. So users’ navigation has been effectively speeded up using ONE. ONE presents a list of Web pages as the user’s visiting history along with the recommended pages updated while the user traverses the Web site. Each time when a user requests a new page, probabilities of visiting any other Web pages or page clusters within the next n steps are calculated. Then the Web pages and clusters with the highest probabilities are highlighted in the ONE window. The user can browse the clusters and pages like in the Windows Explorer. Icons are used to represent different states of pages and clusters. Like the Windows Explorer, ONE allows the user to activate pages, expand clusters. Each page is given its title to describe the contents in the page.
6 Related Work
Ramesh Sarukkai [14] has discussed the application of Markov chains to link prediction. User's navigation is regarded as a Markov chain for link analysis. The transition probabilities are calculated from the accumulated access records of past users. Compared with his method, we have three major contributions. We have
compressed the transition matrix to an optimal size to save the computation time of
1
m n
Q + − , which can save a lot of time and resources given the large number of Web pages on a modern Web site. We have improved the link prediction calculation by taking into account more steps in the future to provide more insight into the future. We have proposed to use Maximal Forward Path method to improve the accuracy of link prediction results by eliminating the effect of backward references by users.
The “Adaptive Web Sites” approach has been proposed by Perkowitz and Etzioni [11]. Adaptive Web sites are Web sites which can automatically change their presentation and organization to assist users’ navigation by learning from Web usage data. Perkowitz and Etzioni proposed the PageGather algorithm to generate index pages composed of Web pages most often associated with each other in users’ visits from Web usage data to evaluate a Web site’s organization and assist users’ navigation [12].
Our work is in the context of adaptive Web sites. Compared with their work, our approach has two advantages. (1) The index page is based on co-occurrence of pages in users’ past visits and does not take into account users’ visiting history. The index page is a static recommendation. Our method has taken into account users’ history to make link prediction. The link prediction is dynamic to reflect the changing interests of the users. (2) In PageGather, it is assumed that each originating machine corresponds to a single user. The assumption can be undermined by proxy servers, dynamic IP allocations, which are both common on the WWW. Our method treats a user group as a whole without the identification of individual users and thus is more robust to these influences. However, computation is needed in link prediction and the recommendations can not respond as quickly as the index page, which can be directly retrieved from a Web server. Spears [15] proposed a transition matrix compression algorithm based on transition behaviors of the states in the matrix. Transition matrices calculated from systems, which are being modeled in too many details, can be compressed for smaller state spaces while the transition behaviors of the states are preserved. The algorithm has been used to measure the transition similarities between pages in our work and compress the probability transition matrix to an optimal size for efficient link prediction.
Pirolli and Pitkow [13] studied the web surfers' traversing paths through the WWW and proposed to use a Markov model for predicting users' link selections based on past users' surfing paths. Albrecht et al. [1] proposed to build three types of Markov models from Web log files for pre-sending documents. Myra Spiliopoulou [16] discussed using navigation pattern and sequence analysis mined from the Web log files to personalize a web site. Mobasher, Cooley, and Srivastava [4, 9] discussed the process of mining Web log files using three kinds of clustering algorithms for site adaptation. Brusilovsky [2] gave a comprehensive review of the state of the art in adaptive hypermedia research. Adaptive hypermedia includes adaptive presentation and adaptive navigation support [2]. Adaptive Web sites can be seen as a kind of adaptive presentation of Web sites to assist users’ navigation.
7 Conclusions
Markov chains have been proven very suitable for modeling Web users’ navigation on the WWW. This paper presents a method for constructing link graphs from Web log
files. A transition matrix compression algorithm is used to cluster pages with similar transition behaviors together for efficient link prediction. The initial experiments show that the link prediction results presented in a prototype ONE can help user to find information more efficiently and accurately than simply following hyperlinks to find information in the University of Ulster Web site.
Our current work has opened several fruitful directions as follows: (1) Maximal forward path has been utilized to approximately infer a user’s purpose in his/her navigation path, which might not be accurate. The link prediction can be further improved by identifying users’ goal in each visit [6]. (2) Link prediction in ONE needs to be evaluated by a larger user group. We plan to select a group of users including students, staff in our university, and people from outside our university to use ONE. Their interaction with ONE will be logged for analysis. (3) We plan to use Web log files from some commercial Web site to build a Markov model for link prediction and evaluate the results on different user groups.
References
1. Albrecht, D., Zukerman, I., and Nicholson, A.: Pre-sending Documents on the WWW: A Comparative Study. IJCAI99 (1999)
2. Brusilovsky, P.: Adaptive hypermedia. User Modeling and User Adapted Interaction 11 (1/2). (2001) 87-110
3. Chen, M. S., Park, J. S., Yu, P. S.: Data mining for path traversal in a web environment. In Proc. of the 16th Intl. Conference on Distributed Computing Systems, Hong Kong. (1996) 4. Cooley, R., Mobasher, B., and Srivastava, J. Data Preparation for Mining World Wide Web
Browsing Patterns. Journal of Knowledge and Information Systems, Vol. 1, No. 1. (1999) 5. Hallam-Baker, P. M. and Behlendorf, B.: Extended Log File Format. W3C Working Draft
WD-logfile-960323. http://www.w3.org/TR/WD-logfile. (1996)
6. Hong, J.: Graph Construction and Analysis as a Paradigm for Plan Recognition. Proc. of AAAI-2000: Seventeenth National Conference on Artificial Intelligence, (2000) 774-779 7. Kalpazidou, S.L. Cycle Representations of Markov Processes, Springer-Verlag, NY. (1995) 8. Kijima, M.: Markov Processes for Stochastic Modeling. Chapman&Hall, London. (1997) 9. Mobasher, B., Cooley, R., Srivastava, J.: Automatic Personalization Through Web Usage
Mining. TR99-010, Dept. of Computer Science, Depaul University. (1999) 10. Nielsen, J.: Designing Web Usability, New Riders Publishing, USA. (2000) 11. Perkowitz, M., Etzioni, O.: Adaptive web sites: an AI challenge. IJCAI97 (1997)
12. Perkowitz, M., Etzioni, O.: Towards adaptive Web sites: conceptual framework and case study. WWW8. (1999)
13. Pirolli, P., Pitkow, J. E.: Distributions of Surfers’ Paths Through the World Wide Web: Empirical Characterization. World Wide Web 1: 1-17. (1999)
14. Sarukkai, R.R.: Link prediction and path analysis using Markov chains. WWW9, (2000) 15. Spears, W. M.: A compression algorithm for probability transition matrices. In SIAM
Matrix Analysis and Applications, Volume 20, #1. (1998) 60-77
16. Spiliopoulou, M.: Web usage mining for site evaluation: Making a site better fit its users. Comm. ACM Personalization Technologies with Data Mining, 43(8). (2000) 127-134