University of Tennessee, Knoxville
Trace: Tennessee Research and Creative
Exchange
Masters Theses Graduate School
8-2018
Design and Implementation of a Stepped
Frequency Continuous Wave Radar System for
Biomedical Applications
Sabikun Nahar
University of Tennessee, [email protected]
This Thesis is brought to you for free and open access by the Graduate School at Trace: Tennessee Research and Creative Exchange. It has been accepted for inclusion in Masters Theses by an authorized administrator of Trace: Tennessee Research and Creative Exchange. For more information, please [email protected].
Recommended Citation
Nahar, Sabikun, "Design and Implementation of a Stepped Frequency Continuous Wave Radar System for Biomedical Applications. " Master's Thesis, University of Tennessee, 2018.
To the Graduate Council:
I am submitting herewith a thesis written by Sabikun Nahar entitled "Design and Implementation of a Stepped Frequency Continuous Wave Radar System for Biomedical Applications." I have examined the final electronic copy of this thesis for form and content and recommend that it be accepted in partial fulfillment of the requirements for the degree of Master of Science, with a major in Electrical
Engineering.
Aly E. Fathy, Major Professor We have read this thesis and recommend its acceptance:
Seddik M. Djouadi, Phani Teja Kuruganti
Accepted for the Council: Dixie L. Thompson Vice Provost and Dean of the Graduate School (Original signatures are on file with official student records.)
Design and Implementation of a Stepped
Frequency Continuous Wave Radar System for
Biomedical Applications
A Thesis Presented for the
Master of Science
Degree
The University of Tennessee, Knoxville
Sabikun Nahar
August 2018
ii
Copyright © 2018 by Sabikun Nahar All rights reserved.
iii
iv
ACKNOWLEDGEMENTS
I would first like to thank my thesis advisor Dr. Aly E. Fathy of the Department of Electrical Engineering and Computer Science at University of Tennessee, Knoxville. As my teacher and mentor, he has taught me more than I could ever give him credit for. Through sharing his expertise and extensive insight in the field of microwave circuits and antennas, Professor Fathy made working on this project an extraordinarily fulfilling and enjoyable experience.
Besides my supervisor, I would like to thank the rest of my thesis committee: Dr. Teja Kuruganti, and Prof. Seddik M. Djouadi. They have both put their valuable time and effort to guide me through this process.
This work would not have been possible without the financial support of Maxentric Technologies, so my sincere gratitude goes out to them as well.
Finally, I have to express heartfelt gratefulness to my parents and my spouse for providing me with continuous encouragement and unwavering support throughout my educational life. They have always motivated me to pursue my goals and this accomplishment could never be achievable without them.
v
ABSTRACT
There is a need to detect vital signs of human (e.g., the respiration and heart-beat rate) with noncontact method in a number of applications such as search and rescue operation (e.g. earthquakes, fire), health monitoring of the elderly, performance monitoring of athletes Ultra-wideband radar system can be utilized for noncontact vital signs monitoring and tracking of various human activities of more than one subject. Therefore, a stepped-frequency continuous wave radar (SFCW) system with wideband performance is designed and implemented for Vital signs detection and fall events monitoring. The design of the SFCW radar system is firstly developed using off-the-shelf discrete components. Later, the system is implemented using surface mount components to make it portable with low cost. The measurement result is proved to be accurate for both heart rate and respiration rate detection within ±5% when compared with contact measurements. Furthermore, an electromagnetic model has been developed using a multi-layer dielectric model of the human subject to validate the experimental results. The agreement between measured and simulated results is good for distances up to 2 m and at various subjects’ orientations with respect to the radar, even in the presence of more than one subject. The compressive sensing (CS) technique is utilized to reduce the size of the acquired data to levels significantly below the Nyquist threshold. In our demonstration, we use phase information contained in the obtained complex high-resolution range profile (HRRP) to derive the motion characteristics of the human. The obtained data has been successfully utilized for non-contact walk, fall and limping detection and healthcare monitoring. The effectiveness of the proposed method is validated using measured results.
vi
TABLE OF CONTENTS
Chapter One Introduction ... 1
1.1 Motivations ... 2
1.2 Radar Theory ... 3
1.3 State of the Art in Vital Signs Radar ... 5
1.4 Scope of the Thesis ... 7
Chapter Two System Development of SFCW Radar ... 8
2.1 Design Considaration ... 8
2.1.1 Signal Generation ... 8
2.1.2 Operating Frequency ... 10
2.2 Design Parameters ... 11
2.3 System Description ... 14
2.3.1 Single Channel System ... 14
2.3.2 Multi Channel System ... 15
2.3.3 Link Budget Analysis of Two Channel System ... 17
2.3.4 Compact Proposed Radar System ... 18
2.4 Conclusion ... 22
Chapter Three An Electromagnetic Model of Human Vital Signs Detection and It's Experimental Validation ... 23
3.1 Background ... 23
3.2 Electromagnetic Model ... 24
3.3 Phase Based Methods ... 28
3.4 Experimental Validation ... 31
3.4.1 Subject at different orientations ... 31
3.4.2 Subject at different distances ... 34
3.4.3 Subject lying down on ground. ... 35
3.4.4 Multiple subjects in the scene. ... 36
3.4.5 Effect of transversal distance between subjects ... 38
3.4.6 Effect of longitudinal distance between subjects ... 39
3.5 Discussion ... 41
3.6 Conclusion ... 41
Chapter Four Alternatives to Big Data Acquisition Using Stepped Frequency Continuous Wave Radar and Compressive Sensing Algorithms ... 43
4.1 Background ... 43
4.2 Compressive Sensing Algorithm ... 46
4.3 Full-wave Electromagnetic Scattering Model ... 49
4.4 Fall Detection Analysis ... 50
4.4.1 Standing and Walking. ... 51
4.4.2 Limping ... 52
4.4.3 Falling on the ground ... 52
4.5 Conclusion ... 54
Chapter Five Summary of Work ... 55
vii
List of References ... 58 Appendix ... 64 Vita ... 72
viii
LIST OF TABLES
Table 1.1. State-of-the-art research comparison... 6
Table 2.1. Dielectric Properties of Various Building Materials. ... 10
Table 2.2. System Design Parameters. ... 13
Table 2.3. Components used in integrated transmitter. ... 20
Table 2.4. Components used in integrated receiver. ... 21
Table 3.1. Comparison between different radar technologies.. ... 24
Table 3.2. Simulated torso dimensions in normal respiration.. ... 26
Table 3.3. Thickness, dielectric constant information of human body parts at different frequencies and their corresponding effective dielectric constant. . 27
Table 3.4. The respiratory rates and heart rates from the contact sensors and simulated and measured radar results for the four different orientations.. ... 32
Table 3.5. Error percentages for different distances.. ... 35
Table 3.6. Error percentage for detecting vital signs for a lying down subject.. .. 36
Table 3.7. Error percentage for detecting vital signs for two subjects... ... 37
Table 3.8. Error percentage for detecting respiration for two subjects with different transversal distances.. ... 39
Table 3.9. Error percentage for detecting respiration for two subjects with different longitudinal distances.. ... 40
Table 3.10. Comparison of the proposed SFCW Radar performance with other state-of-the-art.. ... 42
Table 4.1. Various methods of non-contact fall detection and their disadvantage.. ... 45
ix
LIST OF FIGURES
Figure 1.1. Different target applications of the proposed radar based human sensing system: (a) Search and rescue operation in an earthquake scenario, (b) Vital signs monitoring of infants with sensitive skin conditions, (c) Continuous elderly monitoring and (d) Apnea detection for premature infants..
... 2
Figure 2.1. Step-frequency waveform generation in the time domain. ... 8
Figure 2.2. Signal Generator Based on DDS-Driven PLL Architecture.. ... 9
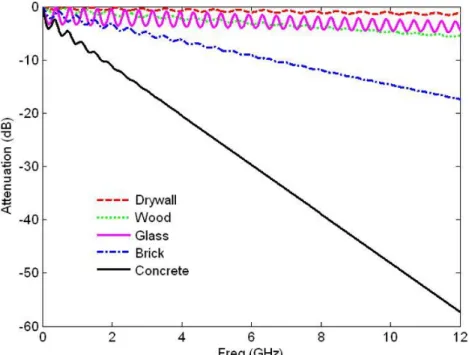
Figure 2.3. Simulated through wall reflection and transmission through various building materials. ... 10
Figure 2.4. Top-level block diagram of the single channel SFCW radar system... ... 14
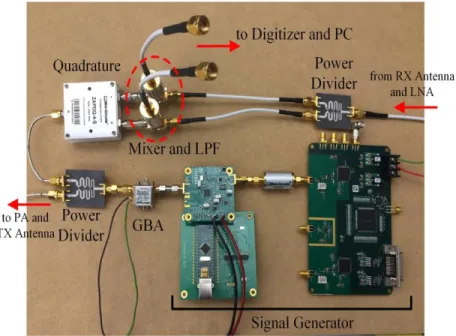
Figure 2.5. Single channel implemented system of SFCW radar.. ... 15
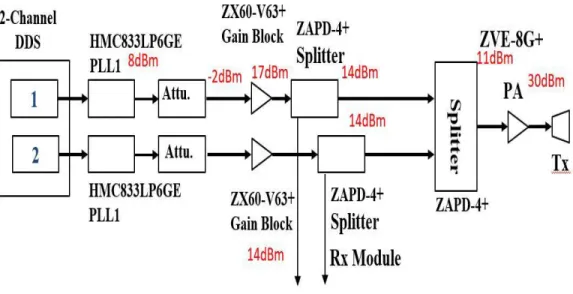
Figure 2.6. Block diagram of two channel SFCW radar.. ... 16
Figure 2.7. Block diagram of four channel SFCW radar.. ... 16
Figure 2.8. Link Budget analysis of transmitter.. ... 17
Figure 2.9. Link Budget analysis of receiver.. ... 18
Figure 2.10. Stack-up SFCW radar system.. ... 19
Figure 2.11. SFCW Radar Stack-up Implementation.. ... 19
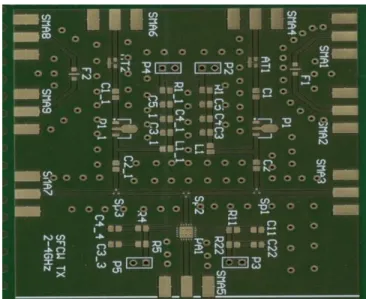
Figure 2.12. The fabricated FR4 board of the transmitter.. ... 20
Figure 2.13. The fabricated board of the receiver. ... 21
Figure 2.14. Stack-up implementation of two-channel SFCW radar system.... ... 22
Figure 3.1. Human Torso Model Geometry.. ... 25
Figure 3.2. (a) Inhomogeneous medium of different dielectric layers. (b) Equivalent homogenous model.. ... 26
x
Figure 3.3. Proposed phase based methods.. ... 28 Figure 3.4. Steps of phase-based method to detect vital signs.. ... 30 Figure 3.5. Subject at different angles. Ref 00, (1) 450, (2) 900, (3) -450.. ... 32 Figure 3.6. The breathing rate and heart beat based on: (a) simulated data
(b) measurement for subject in different orientations.. ... 33 Figure 3.7. Subject at different distances (a) 1m, (b) 3m.. ... 34 Figure 3.8. The breathing rate and heart beat based on simulated and measured data... ... 34 Figure 3.9. Person under test is lying on ground.. ... 35 Figure 3.10. Simulation and measurement results for person under test lying on the ground.... ... 36 Figure 3.11. The vital sings spectrum showing respiration and heart rate for (a) 1st person. (b) 2nd person... ... 37 Figure 3.12. Setup of two human beings under test where the transversal distance between them is variable... ... 38 Figure 3.13. Extracted time domain respiration signal from radar data for two distances showing the effect of spacing between the two subjects... ... 39 Figure 3.14. Setup of two human beings under test where the transversal distance between the subjects are varied ... ... 40 Figure 3.15. Detection of displacement due to vital signs detected by radar... ... 40 Figure 4.1. Fall detection monitoring using (a) conventional method and (b) compressive sensing... ... 47 Figure 4.2. Human body (a) Human model with 17 joints, (b) Human models with 16 ellipsoids and (c) Meshed human body... ... 49 Figure 4.3. When subject walking, the instantaneous velocity acquired with simulation, conventional method and CS... ... 51 Figure 4.4. The velocity of the target limping obtained from experimental data and simulation... ... 52
xi
Figure 4.5. The velocity of the subject falling on mattress from a standing position obtained from experimental data (conventional/full set and CS) and from simulation... ... 53 Figure 4.6. The target falling on a mattress from a standing position obtained from experimental data (conventional and CS) and from simulation, (a) acceleration, and (b) from experimental data using conventional method and CS... ... 53 Figure 4.7. (a) HRRP for walking, (b) HRRP for limping, (c) HRRP for falling, (d) Walking HRRP using CS, (e) Limping HRRP using CS, (f) Falling HRRP using CS………...54 Figure A.1.1. The block diagram of a DDS, illustrating the output of each stage..66 Figure A.1.2. A photograph of the two-channel DDS board……….…...66 Figure A.2.1. The general process of MLFMA………...68 Figure A.3.1. Human motions: standing still and then falling on knee………...…70 Figure A.3.2. Human motions: standing still and then walking………71 Figure A.3.3. Human motions: standing still and then limping………71
1
CHAPTER ONE
INTRODUCTION
Remote monitoring technology has improved remarkably over the past few decades. This technology especially in healthcare has great advantages of emphasizing early detection and prevention of disorders as well as personalized health management [1, 2]. Remote detection of human subjects’ vital signs technology is even more significant in case of rescue operations and for non-contact motion detection for elderly. For example, the injuries sustained from fall incidents are very serious for elderly subjects and monitoring their activities can help in getting care rapidly and eventually prevent such events. According to [3,4], there is a great importance of ubiquitous care for patients’ health remotely that can extend patient care from hospital to home.
One of the popular examples of remote monitoring is regular vital signs recording. It can benefit the prediction, prevention and treatment of a variety of health issues. There are many conventional contact sensing methods and technologies behind the vital signs monitoring including electrocardiogram (ECG), phonocardiograph (PCG) and inductive plethysmography. However, the drawbacks of these contact measurements are causing disturbance to the patient like skin irritations and discomfort and also they are not feasible for unobtrusive long term monitoring. Unlike the aforementioned contact-based methods, noncontact vital signs monitoring, in particular, offers an attractive solution nowadays using ultra-wide band (UWB) radar system. Lately, the UWB remote monitoring systems have been advanced to track multiple vital signs such as heart rate (HR), respiratory rate (RR), electrocardiogram (ECG), blood pressure (BP), blood oxygen saturation (SpO2), blood glucose (BG) concentrations and many more [1–4].
In this thesis, a stepped-frequency continuous wave (SFCW) radar system is implemented for remote monitoring of vital signs of human applications. Here the focus is on the technology and device implementation for vital signs detection and fall detection. The system utilizes the phase information for the signal processing to derive the tiny vibrations of the chest and the motion pattern of a subject. The main thrust in developing the SFCW is to provide a light-weight, low-cost system targeting biomedical applications or rescue operations. The design and construction of the SFCW radar have been experimentally tested and results have been validated using Electromagnetic (EM) model.
In the following, at first, the motivation behind developing the SFCW radar will be presented in section 1.1. In section 1.2, some radar theory will be presented. Section 1.3 will discuss the state of the art in the field of research on the UWB radar system, and the scope of the thesis will be introduced in section (1.3).
2
1.1 Motivations
Wireless technology has recently emerged as an enabler for remote monitoring revolution and could impact disease prediction, treatment, and prevention in home and clinical environments. In many applications such as in search and rescue operations in disaster areas, remote soldier health monitoring in battlefields, vital signs monitoring of infants and burn victims, use of contact sensors is just not a realistic option. In addition, for applications that require continuous monitoring, such as fall detection in elder homes and sleep apnea monitoring for premature infants, wearing or attaching contact sensors on the body is inconvenient and impractical. The motivation of this thesis work is to provide an elegant, accurate and portable solution to this problem through the use of microwave radars. The goal was to come up with a system capable of fully monitoring vital signs for general health follow-ups and understand the different kinematics of human motions for many applications such as aiding elderly, gait analysis and fall detection.
(a) (b)
(c) (d)
Figure 1.1. Different target applications of the proposed radar based human sensing system: (a) Search and rescue operation in an earthquake scenario, (b) Vital signs monitoring of infants with sensitive skin conditions, (c) Continuous elderly monitoring and (d) Apnea detection for premature infants.
3
The non-contact cardiorespiratory monitor based on UWB technology provides truly remote, non-contact vital signs monitoring solution. It is especially useful for conditions that can be influenced or deteriorated by contact sensors, including neonatal monitoring, burn or trauma patient monitoring, sleep monitoring and so on. Additionally, monitoring and tracking of elderly’s activities is becoming a great concern for health industry and the public. Fall detection, in particular, is considered to be a major public health problem, as a fall would usually result in a serious disability for elderly. Studies show that rapid detection of a fall event and immediate assistance after a fall can greatly reduce the adverse effects on the elderly [5]. Therefore, it is of great importance to develop a way to detect a fall automatically by using non-contact methods, and to report the fall incident to the related medical personnel so that proper care can be provided immediately. However better hardware and improved algorithms are required for robustness requirements.
In this thesis, stepped frequency continuous wave radar has been designed based on the discretization of the spectrum rather than using a continuous spectrum like in FM or impulse UWB radars. Use of UWB signal provides ranging and multi-person detection capabilities. But at the same time, the stepped frequency technique eliminates the need for high speed and expensive ADCs while maintaining easier calibration requirements. The implemented radar system operates with a center frequency of 3 GHz, with a 2 GHz bandwidth and a 20 MHz frequency step is utilized to detect the vital signs of human. The received baseband signal are processed using sophisticated signal processing schemes to extract vital signs or detect fall incidents of the subject.
1.2 Radar Theory
Radar technology has become prominent since the beginning of the 20th century.
The principle of Radar is very similar to sound. It uses electromagnetic waves that is transmitted to the object and gets reflected from the object of interest. This returned energy is called an echo. Radar sets can use the echo to determine various information such as the direction, distance and velocity of the reflecting object. Radar functions similarly and is most commonly employed to obtain the location of a moving object through the use of radio frequency (RF) waves rather than sound.
To understand the principle of the radar system operation, it is important to understand the radar fundamental theory. Radar systems transmit microwave signals, which can either be a single tone or a pulse, through space with the speed of light. When the signal is intercepted by an obstacle, the signal is reflected off the object back to the radar. The reflection of the signal can be in towards any direction and but only the part that is captured by the receiving antenna is of
4
interest to the radar system. The radar system then analyzes the differences between the original transmitted signal and the reflected signal to provide useful information such as distance (based on the time delay between transmission and reception), size (based on the signal intensity), and velocity (based on phase and Doppler shift) of an object with respect to the radar system.
For a radar system with transmitted power of Pt, the directional power density at
distance R is given by:
𝑆𝑡 = 𝑃𝑡
4𝜋𝑅2× 𝐺 (1-1)
Where G is the antenna gain. The reflected power is a function of this power density and the radar cross section (RCS). The radar cross section (RCS) of a radar system is the measure of the ratio of back scattered power density in the direction of the radar to the power density that is intercepted by the target. Since the scattered power is distributed on a shape of a sphere, a small part of this (4πr2)
can be received by the radar. The formula of the RCS can be defined as =4π𝑅2|𝐸𝑅|2
|𝐸𝑖|2 (1-2)
where ERiselectric field strength at range R and Et is the electric field strength
incident on the target. So the reflected power is then given by: 𝑃𝑟𝑒𝑓 = 𝑆𝑡× 𝜎 = 𝑃𝑡
4𝜋𝑅2× 𝐺 × 𝜎 (1-3)
The power received by the radar is a function of this reflected power and effective antenna aperture, which can be defined as:
𝐴𝑊 = 𝐺𝜆2
4𝜋 (1-4)
where λ is the wavelength. Thus, the received power is given by: 𝑃𝑟𝑒𝑐 = 𝑃𝑟𝑒𝑓
4𝜋𝑅2× 𝐴𝑊 =
𝑃𝑡 .𝐺2 .𝜎 .𝜆2
(4𝜋)3𝑅4 (1-5)
Which in turn gives the range of the subject through the classic radar equation: 𝑅 = √𝑃𝑡 .𝐺2 .𝜎 .𝜆2
𝑃𝑟𝑒𝑐(4𝜋)3 4
(1-6)
In this thesis, a stepped-frequency continuous wave radar (SFCW) system has been designed, implemented and tested. SFCW radar transmitter set transmits a
5
discrete number of single tones continuously increasing by a constant frequency step. The mathematical expression of the transmitted stepped-frequency signal at frequency f0can be written as
𝑆(𝑡) = 𝐴𝑡sin [2(𝑓0 + 𝑛𝑓)𝑡] (1-7) The reflected signal from a subject can be represented as
𝑆(𝑡) = 𝐴𝑟sin [{2(𝑓0+ 𝑛𝑓)𝑡} −(t) (1-8) Where Ar is the amplitude of the received signal, and (t) is the phase. The
maximum unambiguous range can be formulated as 𝑅𝑎𝑚𝑏 =
𝑐
2𝑓 (1-9)
Another important parameter of the SFCW radar is range resolution which is the ability of a radar system to distinguish between two or more targets on the same bearing but at different ranges. The theoretical range resolution of a SFCW radar system can be calculated as
𝑆𝑅 = c
2𝐵 (1-10)
where B is the effective bandwidth and the c is the speed of light.
1.3 State of the Art in Vital Signs Radar
Various types of radars can be utilized for human sensing applications, like the continuous wave (CW) Doppler radar, ultra-wide band impulse radar, and stepped-frequency continuous wave (SFCW) or stepped-frequency-modulated continuous wave (FMCW) radar. CW radars have been used for remote vital signs detection [6-11], precise assessment of key cardiopulmonary activity parameters [12], motion or gesture sensing [13-15]. The big disadvantage of the CW radar is its inability to provide range information and conduct multi-person experiments. The UWB impulse radar can overcome that drawback through its use of narrow pulse and wide band signal. In order to provide cardio-respiratory estimation with high accuracy, various UWB radar systems have been proposed [16-21]. The feasibility of utilizing UWB radar system has also been demonstrated in the health care applications such as the ones presented in [16-19]. But, typically impulse radars need high-speed ADCs which are very expensive.
FMCW and SFCW radars on the other hand can eliminate this high-speed ADC requirement while still providing the advantage of the effective wide bandwidth.
6
FMCW radars have been successfully applied to non-contact vital signs detection and subject localization [22-24, 29]. But FMCW radars are typically more difficult to calibrate than the SFCW radars. SFCW radars can also skip certain frequency steps while maintaining the same level of performance through compressive sensing techniques which can speed-up the data collection process. These radars have also been widely studied for applications such as vital signs monitoring, gait analysis, and subject localization [25-28].
Below is a summary of the state-of-the-art research on SFCW and FMCW radars in this application. Since the operating principles of the UWB impulse radars are very different compared to these radars, they were not included in this table.
Table 1.1. State-of-the-art research comparison
Research Group Radar Type Application Frequency Range Accuracy Peng et al. [29] 2017 FMCW + CW Localization, ISAR Imaging, HR/RR 5.64-5.96 GHz - L. Qiu et al. [26] 2017
SFCW Through wall life signal extraction 2.15–2.75 GHz - Wang et al. [23] 2015 FMCW HR/RR 75-85 GHz 8% Ren et al. [27] 2015 SFCW HR/RR 3.14-3.46 GHz 5.7% Wang et al. [22] 2014 FMCW/CW HR/RR 5.72-5.88 GHz - Wang et al. [24] 2014 FMCW RR 5.72-5.88 GHz - Liu et al. [28] 2014 SFCW RR 0.3-1.3 GHz -
7
1.4 Scope of the Thesis
In this thesis, SFCW radar system has been introduced with off-the-shelf components initially. Later the system was implemented with respective ICs to make it portable. Finally, this system is utilized for monitoring vital signs and fall events of elderly people during the validation phases. There are three objectives identified for this project:
i. To design and implement a SFCW radar system
The SFCW radar system design is simple and straight forward. Simple, light weight, compact, and low-cost design are the overall top-level requirements. The proposed system can achieve wide bandwidth using multi-channel implementation. In this thesis, the SFCW radar is designed 2 GHz bandwidth which is suitable for many biomedical applications.
ii. To validate the SFCW radar performance
For the experimental validation, two different tests were performed using SFCW radar system. One of them is vital signs detection. During the experiments, a standard pulse sensor and respiratory contact sensor are used to record the heartbeat and breathing rates and are used as the ground truth. The second test is used for fall detection analysis. The distinct events that are considered here in this research are regular activities such as standing and walking, limping and falling on a mattress.
iii. To Simulate Human Model
Firstly, a human rib cage was modeled using an elliptical cylinder with the appropriate dimensions. Then an inhomogeneous model of the rib-cage was created that consisted of different layers with different dielectric constants to represent the skin, the bones, muscles, fat, blood and so on. These modeling efforts were helpful in understanding the problem and verifying the results from different experiments. This model is utilized as a reference to validate the vital signs experiments in different cases.
The organization of the thesis is as follow: Chapter two discusses the system development of the implemented SFCW system, chapter three shows the validation of the system for vital signs detection with the help of electromagnetic modeling, and chapter four shows the success of the system in fall detection with compressive sensing techniques while chapter five concludes the thesis.
8
CHAPTER TWO
SYSTEM DEVELOPMENT OF SFCW RADAR
This chapter illustrates the details of the implementation of a SFCW radar and also demonstrates our strategy to select an optimal operation frequency for the SFCW radar. The benefit of using SFCW radar system includes good range resolution, high signal-to-noise ratio, ability to discriminate targets in range, capability to reduce clutter within the resolution cell and its cost-effectiveness.
We will describe a single channel and multichannel SFCW radar block diagrams and will introduce miniaturization scheme of the conventional SFCW radar system to be portable integrated platform that we have developed through the course of this effort.
2.1 Design Consideration
The goal of this project to design and develop a SFCW radar with high range resolution. Some important design issues that have been considered include:
2.1.1 Signal Generation
The single channel SFCW radar system operates within 2 GHz to 4 GHz with 20 MHz frequency step size. The operating frequency waveform of the SFCW radar is linearly increased in discrete steps over the bandwidth in Figure 2.1. The frequency of the nth pulse can be written as
fn= fo + N∆f (2-1)
where fo is the initial carrier frequency, and ∆f is the frequency step.
9
A stepped-frequency waveform achieves a wide bandwidth (N∆f) sequentially, but has a narrow instantaneous bandwidth of 1/ where =1/f. The SFCW radar provides a high range resolution which is inversely proportional to its equivalent total bandwidth.
To generate the signal waveform, a direct digital synthesizer (DDS) is utilized for the SFCW radar. The IF signal is synthesized from the DDS board and the phase-locked loop (PLL) generates an RF stepped-frequency signal. For the multi-channel radar system implemented here, the center frequency of each DDS channel has been shifted by 1 GHz; while each channel covers 1 GHz. Hence, the total bandwidth of the stepped frequency signal is 2 GHz for a two-channel system. The frequency step and duration of each step are programmed as 20 MHz and 50 μs respectively, so that a 7.5-m unambiguous range (Run) can be achieved using
this equation
𝑅𝑢𝑛 = 𝑐
2𝑃𝑅𝐹 (2-2)
Where PRF is pulse repetition frequency. The block diagram of the DDS board and PPL are shown in Figure 2.2. For more details about the signal generation readers are referred to [30].
10
2.1.2 Operating Frequency
At the preliminary stage, the functional goal of designing SFCW radar system is to simply detect vital signs of a human in a harsh environment such as rescue operation and military service. Therefore, the operation frequency of the radar system needs to be determined based on the function that the system is to accomplish. With this function in mind, the SFCW radar system is designed in the S-band range with a frequency band between 2 GHz to 4 GHz and a bandwidth of 2 GHz. The advantage of using higher-frequency transmissions to get wider bandwidth, hence higher range resolution but we must have low insertion loss to
Figure 2.3. Simulated through wall reflection and transmission through various building materials.
Table 2.1. Dielectric Properties of Various Building Materials.
Material ’ ” * Concrete 6.8 0.9 0.13 Glass 6.4 0.032 0.005 Brick 4.0 0.2 0.05 Wood 2.5 0.05 0.02 Drywall 2.0 0.01 0.005
11
go through obstructing barriers. For the development of the SFCW radar system, there is need to be accounted the through barrier attenuation in many applications. It is well-known that through barrier attenuation increases with frequency. Hence, a lower frequency band usage is preferred to minimize the see-through insertion loss for high signal to noise ratio or even receive an adequate detectable signal after going a round trip propagation through the wall.
To better understand the through barrier attenuation of a SFCW radar signal, transmission characteristics are reviewed for various building materials. The propagation characteristics through the drywall, wooden wall, glass, brick wall, and concrete wall over the DC-12 GHz frequency range are presented in Figure 2.3 and Table 2.1.
It is very clear that loss due to drywall is typically low, but for concrete and cement walls it is relatively high at high frequency, however, it is acceptable still around 2 GHz, and could be used for our implementation.
2.2 Design Parameters
Normally, the stepped-frequency radar transmits a burst of N pulses, whose carrier frequencies are increased from pulse to pulse by a constant frequency increment
Δf. Assuming the carrier frequency of the first pulse is f0, the frequency of the nth
pulse is then fn = f0+(n-1)Δf. The mathematical expression for a frame of the
transmitted stepped-frequency signal (i.e. a burst) can be formulated as
(2-3) where rect(.) is the rectangular function, T is the pulse repetition time (PRT), and the total time of a burst is TN = NT. Assuming the instantaneous distance between
the target and radar is R(t), the received signal can be represented as
(2-4) where is the amplitude of the received signal, and c is the speed of light. The received signal is demodulated with its corresponding carrier frequency and then sampled in the baseband. The normalized sample of the baseband signal can be expressed as
s f
n,m
expj4f R mn
/c (2-5) where m represents the burst number. Here, we assume that the instantaneous range of the target does not change during the period of a burst, which is a
1 0 0 1 ( ) rect exp 2 N n t nT s t j f n f t T T
( ) 2 ( ) r s t as t R t c12
reasonable assumption given that the period of a burst is usually very short, e.g. several milliseconds and the displacement of the target during the period of a burst is less than a range resolution cell.
According to (2-5), we can acquire the high-resolution range profile (HRRP) of the target by performing an inverse fast Fourier transform (IFFT) along each burst. This procedure can be expressed as
1 0 0 ( , ) , exp 2 / exp 1 / exp 4 / sin sin / N n n m m m x k m s f m j nk N j N k k N j f R m c k k k k N
(2-6)where k = 0, 1, …, N-1, and . The first two terms represent the phase information of the HRRP, while the third term is the amplitude of the HRRP. When k is equal to km, the HRRP achieves its maximum and its position represents
the range of the target, while the first term has little contribution to the phase as its value is nearly one. The second phase term also contains the range information of the target, which is highly ambiguous as the phase cannot be larger than 2π. However, based on the principle of differential interferometry, the displacement of the target during the period of a burst can be calculated as
4
*
, 1 , m m R x k m x k m (2-7) Where denotes the complex conjugate, denotes the phase of the complex data, and is the wavelength of the signal.The radar range equation provides an indication of the ability of the radar to detect the presence of a target. The equation is based on the Friis transmission equation and can be written for power received as a function of range for a given transmit power, wavelength, antenna gain, and radar cross section (RCS).
𝑃𝑟 = 𝑃𝑡𝐺2 2
(4𝑅)2
4𝑅2 (2-8)
Where Pt is the transmitted power, G is the gain of the antenna, is the radar cross
section RCS and R is the range. The transmitted output power is chosen to be 30dBm, because we needed penetration through barrier at a distance of 1-2 m in Table 2.2. We can use a power level as low as 8 dBm for normal vital signs detection where the distance is 1m from the subject.
2 ( )
m
k R m N f c
13
In practice, the reflected signal is corrupted by thermal noise, interference and clutter. Therefore, it is essential to measure the minimum detectable signal Pm
which depends on receiver bandwidth (B), noise figure (F), temperature (T), and required signal-to-noise ratio (S/N).
𝑃𝑚 = 𝑘𝑇𝐵𝐹(𝑆/𝑁)𝑚𝑖𝑛 (2-9)
The available input thermal noise power is proportional to the product kTB where k is Boltzmann’s constant, T is temperature (degrees Kelvin) and B is receiver noise bandwidth in hertz. The SFCW radar design parameters is shown in Table 2.2.
Table 2.2. System Design Parameters.
System Parameters Value
Transmitter Output Power 30 dBm
Receiver Bandwidth 2 GHz
Receiver Thermal Noise Floor
(-174 dBm/Hz=-114 dBm/MHz) + 10log10(2000)
-81 dBm
Center Frequency 3 GHz
Receiver Noise Figure 4 dB
Signal to Noise Ratio 6 dB
Receiver Sensitivity Thermal noise floor+ Receiver NF+ S/N) = -71 dBm
1 dB compression point 12 dB
Receiver Dynamic Range 1 dB compression-Receiver sensitivity = 83 dB
14
2.3 System Description
Basically, the main three components of the SFCW radar system are the transmitter, receiver and antenna. It is essential to understand these three components.
2.3.1 Single Channel system
The block diagram of our single-channel SFCW radar system is shown in Figure 2.4. The DDS chip achieves an ultra-wideband of 1 GHz and uses a 1.2-GHz reference clock. The DDS channel synthesizes an IF signal with a bandwidth of 20 MHz, after which a 50 times PLL is used to acquire the RF stepped-frequency signal. The RF stepped-frequency signal is firstly divided into two components through a two-way power splitter. One component of is fed into a power amplifier before being sent for transmission through a horn antenna. The other component is split again with a quadrature hybrid coupler to serve as the in-phase and quadrature-phase local oscillator. On the receiver side, after a Hittite HMC753 wideband low noise amplifier (LNA), the received signal is split into its two constituent components and each is mixed with its corresponding local oscillator and unwanted components are filtered to acquire the baseband signal. Each baseband signal is then digitized and converted to a 14-bit digital signal and stored in a PC for further processing using a low speed data acquisition card. The implemented SFCW radar system is shown in Figure 2.5.
15
Figure 2.5. Single channel implemented system of SFCW radar.
2.3.2 Multi-channel system
The advantage of using a multi-channel stepped-frequency continuous wave radar is that it can achieve even wider bandwidth through dividing the spectrum into many channels, and all channels operate simultaneously, i.e. parallel processing. Our proposed two-channel SFCW radar system is shown in Figure 2.6. Each DDS board has two DDS channels integrated on a single platform and work simultaneously to achieve the whole ultra-wide bandwidth. The two boards are synchronized using one 1.2-GHz reference clock (master). Even though we have ultra-wide band for the whole system, it is still relatively easy to use low speed analog to-digital converters due to the very low instantaneous bandwidth.
In the design of two channel SFCW radar, the transmitter is designed in a way that it transmits adequate peak power at the desired frequency bandwidth, which is determined by the required radar range. The primary components of the transmitter of the two channel SFCW radar are waveform generator (DDS & PLL), gain block amplifier, attenuator, power divider and power amplifier. Four channel SFCW radar system is illustrated in Figure 2.7.
16
Figure 2.6. Block diagram of two channel SFCW radar.
ADC PC Power Splitter LPF LPF PA LNA Transmitting Antenna Receiving Antenna DDS11 DDS12 DDS21 DDS22 Power Splitter Power Splitter Power Splitter Power Splitter M u lt ip le x e r LPF LPF PLL PLL PLL PLL M u lt ip le x e r 1.2 GHz Ref Clock
17
2.3.3 Link Budget Analysis of Two Channel System
Figure 2.8 shows the link budget of the transmitter of the two channel SFCW system with a summary of the associated power levels. The stepped frequency signal is generated from DDS and PLL. The Mini-Circuits ZX60-V63+ Gain Block is used with a +19.2dB gain at 3 GHz, with an acceptable return loss better than 10 dB. The Mini Circuits ZVE-8G+ power amplifier is utilized before transmitting antenna. The output 1 dB compression point of the power amplifier is +30 dBm. At the receiving side, there are four main components: mixer, quadrature hybrid ‘Q-hybrid’, LNA and filters. The detailed link budget of the receiver is outlined in Figure 2.9. In this radar system design, the Mini-Circuits QSC-722+ Q-hybrid provided a phase-shifted carrier of 0⁰ and 90⁰ to the mixers. The Q-hybrid has better than 15dB return loss, less than ±0.5dB amplitude imbalance and an error of less than 3⁰ between ports, signals to be mixed with the received signals after amplification. As the received signal is captured by another horn antenna and is amplified by a Low Noise Amplifier (LNA). Afterwards it is divided into two parts for the I-Q mixer. Mini-Circuits ZX05-C-60+ mixer to mix the LO with the RF received signal, and it is used since it has 32 dB of isolation from LO to RF ports from 2 GHz to 4GHz and low conversion loss. After the down-conversion by the mixer, there is a need to filter unwanted components from the baseband signal. Therefore, a low pass filter is added after down-conversion. The Mini-Circuits SLP-1.9+ low pass filteris inserted in the RF front-end. Finally, the baseband signal is digitized using a low-speed data acquisition card and stored in a personal computer for subsequent processing.
18
Figure 2.9. Link Budget analysis of receiver.
2.3.4 Compact proposed radar system
This section describes the development of a new compact module with improved performance, with significant size and power reduction over the original prototype. The main design goals of the SFCW radar system design are the preservation of a small size factor and a small weight to be portable. Therefore, the system is designed in printed circuit board with respective ICs to reduce the size of the integrated prototype. The 3D view of PCB stack-up configuration of the SFCW radar system is shown in Figure 2.10.
For minimizing the interference of the integrated system, the whole system design is divided into five different boards in Figure 2.11 and the interconnections among the different boards is done using flexible coaxial cable.
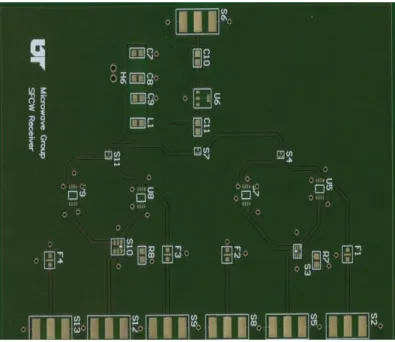
The transmitter of SFCW radar is integrated on FR4 boards and Rogers 4350 laminate. The board is separately stacked up for avoiding EMI problem. Figure 2.12 illustrates the fabrication of the transmitter board. The components used for the integrated boards are listed in Table 2.3.
19
Figure 2.10. Stack-up SFCW radar system.
20
Figure 2.12. The fabricated FR4 board of the transmitter.
Table 2.3. Components used in integrated transmitter.
Symbols in
Block Diagram Chips Description
Gain Block Hittite, HMC589LP3 21 dB gain, DC-4 GHz, 5V supply Splitter/Combiner Susumu,
PS1608GT2-R50-T5 2 Way-0° 0 to 20 GHz
PA Triquint,
TGA2597-SM 25V, -27.5V, 2-6 GHz
The receiver board is fabricated on FR4 and Rogers 4350 laminate. The respective integrated chips are listed in Table 2.4. The layout of the receiver board is shown in Figure 2.13.
21
Figure 2.13. The fabricated board of the receiver.
Table 2.4. Components used in integrated receiver.
Symbols in Block
Diagram Chips Description
LNA HMC639 0.2-4GHz, NF 2.3 dB, Gain
13 dB Splitter1/Splitter2 Susumu,
PS1608GT2-R50-T5 2 Way-0° 0 to 20 GHz
Mixer Hittite, HMC175MS8E 8 dB conversion loss, LO/RF 1.7-4.5 GHz, IF DC-1 GHz Quadrature1 Mini-circuits, QCS-332 2 Way-90° 1800to 3300 MHz Quadrature2 Mini-circuits, QCS-442 2 Way-90° 2800to 4400 MHz
22
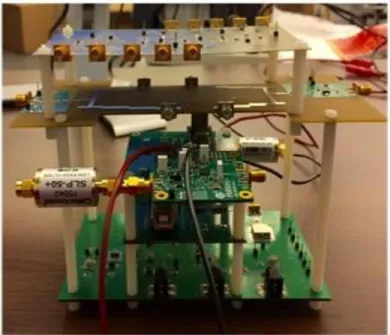
Figure 2.14. Stack-up implementation of two-channel SFCW radar system.
Figure 2.14 illustrates an overview of the stack-up system. The prototype is implemented using five boards for DDS, the transmitter, the receiver, the oscillator and the power supply. The Transmitter, Receiver and Power Supply PCB’s are separated by blank single-sided FR4 PCB’s. These blank grounded copper clad boards provided adequate isolation between the individual power supply, transmitter and receiver boards. The SFCW radar prototype is successfully implemented and the performance of the prototype is similar to the conventional system.
2.4 Conclusion
In this chapter, single channel, multi-channel and finally a compact SFCW radar system is designed and implemented, which can transmit a set of frequencies simultaneously via one UWB antenna over multiple channels operating in parallel. In many applications, a hand-held radar system is desired for simultaneous monitoring of accurate vital signs detection and localization capabilities. The performance of the SFCW radar system will be evaluated and the applicability of this SFCW UWB radar system, e.g., precise target localization, fall detection and vital signs detection will be investigated.
23
CHAPTER THREE
1AN ELECTROMAGNETIC MODEL OF HUMAN VITAL SIGNS
DETECTION AND ITS EXPERIMENTAL VALIDATION
In this chapter, Non-contact vital signs detection using a stepped-frequency continuous wave radar is presented. To validate the experimental results, an electromagnetic model using the scattered fields of incident plane waves on a dielectric model of a human subject has been developed. The model approximates the torso by an equivalent homogenous dielectric layer. The SFCW radar system results are accurate for both heart rate and respiration rate detection within 5% error margin when compared to conventional contact sensor readings. The agreement between measured and simulated results is acceptable for distances up to 3 m, and at various subject orientations with respect to the radar boresight. Meanwhile, in the presence of more than one subject, only slight drop in accuracy has been observed unless one subject is almost blocked by another. This system can be utilized to investigate various human activities and motion-scenarios as well, to validate the performance of radar system.
3.1 Background
There is a growing need to fully monitor and understand the different kinematics of human vital signs for many applications; such as monitoring elderly, and for aiding them with falling incidents, or discriminating between different daily human activities like walking, limping or running (e.g. gait analysis). Electromagnetic (EM) modeling of such scenes can help in developing and testing new design and detection concepts in early stages of system development. For instance, through the use of accurate EM modeling, one can study different rescue scenarios in natural disasters like earthquakes and landslides events and aid the development of effective radar systems to save lives. Numerous modeling methods have been already investigated for fast and accurate computations of scattered fields for various subjects using techniques such as ray tracing and EM numerical techniques [31-33]. In this work, we focus on modeling the human torso, which is the area that should be affected the most by respiratory and heartbeat motions. The torso is represented by a dielectric elliptical cylinder, and the chest and heart motions are emulated by expanding and shrinking the corresponding surface. Widely used radar systems for such applications are continuous wave (CW), ultra-wideband (UWB), frequency modulated continuous wave (FMCW) and stepped
1 This chapter is a collaborative effort with Mr. Tuan Phan from The Catholic University of America,
Mr. Farhan Quaiyum, Dr. Lingyun Ren from University of Tennessee and Dr. Ozlem Kilic from The Catholic University of America.
24
Table 3.1. Comparison between different radar technologies.
CW UWB FMCW SFCW
Localization No Yes Yes Yes
Multiple Subjects No Yes Yes Yes
ADC Speed Low Fast Low Low
Calibration - -
Difficult if nonlinearity
exists*
Easy
frequency continuous wave (SFCW) systems. Different features of these systems are listed in Table 3.1. In this paper, we utilize a SFCW radar system; and are able to switch between its two operating modes: heart and breathing rates using CW for a single subject, while SFCW operation for locating heart and breathing rates and range of multiple subject(s) as well [11].
3.2 Electromagnetic Model
In this section, the human vital signs model is briefly described. The model developed by the Catholic University of America (CUA) assumes that the human torso, represented by a homogenous dielectric object is illuminated by a plane wave emanating from a stepped frequency radar source over 1 GHz bandwidth. The frequency range is uniformly sampled by a set of K frequencies fk; ranging
from f1 to fK with a frequency step size f. The signals are transmitted for each
time frame with T = 0.0469 s; and subsequently the resulting scattered fields from the scene are calculated. The full-wave MLFMA model is run on a GPGPU cluster at CUA to calculate the scattered fields with significant acceleration. Since the scattered field is a function of both frequency and time, it is represented by a full matrix for all specified frequencies and time steps.
To represent the human subject more accurately, we improved our previously developed human subject model by utilizing a dielectric model rather than a perfect electric conducting boundary conditions [34]. Thus, we need detailed information on the material properties, as well as the shape of the human torso. Given that at the high frequency end of the operation frequency; i.e. 3 GHz, the lateral and anterior-posterior rib cage diameters of the torso correspond to 1.5 λ– 2.5 λ in free
25
space, the size of the problem would be relatively large. Model details and MLFMA process are discussed in the following sections.
The human torso is represented by an elliptical cylinder, which mimics the internal anterior-posterior rib cage diameters. The anterior-posterior, lateral rib cage diameter and diaphragm height corresponding to those dimensions are provided in Table 3.2 [35]. A local region on the top-left corner of this elliptical cylinder is periodically perturbed to simulate the periodic displacements on the chest wall due to heartbeat as shown in Figure 3.1. Meanwhile, the chest’s anterior and lateral diameters expand and shrink periodically in both directions as a result of respiration [36]. The periodic chest wall and local region movements due to heartbeat can be approximated as sinusoidal models given by:
(3-1) (3-2)
where mh, map/l, are the heart and anterior-posterior/lateral and displacements
amplitudes, dh,0 and dap/l,0are the heart and chest nominal diameters, respectively;
and fh, and fb, are the heart rate and respiratory rate respectively.
Figure 3.1. Human Torso Model Geometry.
,0
( )
sin(2
)
h h h hd t
d
m
f t
/( )
/ ,0 /sin(2
)
ap l ap l ap l bd
t
d
m
f t
26
Table 3.2. Simulated torso dimensions in normal respiration.
Anterior-posterior diameter
Lateral diameter Diaphragm dome diameter
Min. 15.2 cm 24.3 cm 20.6 cm
Max. 17.6 cm 25.6 cm 20.6 cm
The human torso is developed as an inhomogeneous medium comprised of different layers with different dielectric properties (e.g. skin, blood, bone, etc.); which are modeled as a multilayered structure in Figure 3.2 (a), [37]. We follow this step by creating an equivalent homogenous model for the torso that has the same transmission and reflection coefficients in the direction of interest for our experiments, as shown in Figure 3.2 (b) for the elliptical cylinder model described earlier in Figure 3.1. Rather than solving this complex problem, the calculations were simplified by using an equivalent single dielectric slab to replace the multilayer structure. The single slab has the same size and a homogeneous equivalent dielectric constant; maintaining that both structures have the same transmission and reflection coefficients over the entire frequency range of interest and for the direction of interest. The equivalent dielectric constant was calculated via a particle swarm optimization algorithm (PSO) [38]. This technique is inspired by the collective intelligence and social behavior of the bees searching for food.
Figure 3.2. (a) Inhomogeneous medium of different dielectric layers. (b) Equivalent homogenous model.
27
At first, 25 agents (bees) are randomly distributed to sample the search domain; which is a two-dimensional space corresponding to the real and imaginary parts of the dielectric constant. We set the range from 1 to 100, and from -50 to 0, for the real and imaginary parts respectively. The fitness function for this application is the reflection coefficient, which is computed for each agent based on its location in the search space. Using the collective intelligence on each individual’s best location, as well as a global best location that has been achieved by the swarm, each agent updates its velocity and location toward these best locations. The algorithm repeats itself until the desired convergence criterion is met (i.e. either the reflection coefficient error is less than 1% or the maximum number of iterations reaches 1000 in this case). More details about the PSO implementation can be found in [39]. The material properties of each layer in the multilayer representation, and the optimization results for an equivalent homogenous representation are shown in Table 3.3 over a 4 GHz bandwidth. More information can be found in A.2, which is done by the Catholic University of America.
Table 3.3. Thickness, dielectric constant information of human body parts at different frequencies and their corresponding effective dielectric constant [37].
Frequency 1GHz 2GHz 3GHz 4GHz 5GHz Skin 2mm 35.8-10.5j 35.05-7.9j 34.4-8.2j 33.7-9j 32.9-10.1j Blood 1mm 58.7-21.4j 58.1-14.5j 57.5-13.8j 56.7-14.5j 55.7-15.8j Fat 8mm 5-0.9j 4.8-0.7j 4.7-0.8j 4.5-0.8j 4.4-0.9j Muscle 10mm 54.1-12.2j 53.3-11.1j 52.3-12.5j 50.9-14.6j 49.3-16.6j Bone 10mm 8.5-0.8j 7.9-1.2j 7.5-1.3j 7.2-1.3j 7.0-1.7j Heart 60mm 60.3-19.3j 59.3-14.9j 58.2-15.6j 56.7-17.3j 55.1-19.4j Effective Dielectric Constant (91mm) 21.45-12.0j 21.9-12.1j 22.5-12.3j 23.2-12.6j 24.1-13.27j
28
3.3 Phase based Methods
In the conventional approach, the frequency of displacements modulating the collected sample amplitudes can be identified by applying the direct FFT method to slow-time samples. As presented in Figure 3.3 (a), phase-based methods first implement FFT on each pulse along slow time for direct phase variation extraction.
Alternatively here, in order to extract the vital signs information, we apply a phase-based method on the received baseband signal [40,41]. As presented in Figure 3.3 (b), phase-based methods first implement FFT on each pulse along slow time
(a)
(b)
Figure 3.3. (a) Conventional FFT method to detect vital signs (b) Proposed phase-based methods.
29
for direct phase variation extraction. The harmonic and intermodulation interference of respiration are suppressed using the phase information because of the linear relationship between phase and time delay. FFT is performed next on the fast time samples [42],
, exp 2 exp 2 p d c p c c d Y t A P j t A P j t (3-3)where * represents convolution. For the FFT of each pulse, the computation complexity is minimal at dc compared with any other frequency. As a result, FFT of each pulse at dc is
, 0 , , exp 2
k k k p c c d Y t I t jQ t A P j t (3-4)It is worthwhile mentioning that synchronization between FPGA clock and carrier frequencies helps in eliminating the jitter in the system for the proposed phase- based method. Suppose the jitter in the FPGA clock is J(t), then the signal of interest at the receiver will be
,
p
d
r t
A p
t
J t
(3-5)When the system clock and carrier frequencies are synchronized, there will be phase coherence between these two frequencies, i.e., the two different frequencies are phase locked. The intermediate signals of I/Q channels and collected pulses are
I t
,
r t
,
cos 2
c
J t
(3-6)
,
,
sin 2
c
Q t
r t
J t
(3-7)
,
,
,
,
exp
2
cy t
I t
jQ t
r t
j
J t
(3-8) When FFT is applied on the fast time samples of (16), we obtain30
, exp 2 2 exp 2 exp 2 exp 2 p d c c p c c d Y t A P j t j J t j J t A P j t j J t (3-9)When each pulse is Fourier transformed at dc, (3-9) will become (3-5). In this manner, the jitter existing in the FPGA clock can be eliminated from the demodulated phase information using proposed phase-based methods.
As summarized in Figure 3.4, in the phase-based method, FFT is applied on each pulse first within a time window and along “fast” time, then direct phase variation extraction is implemented. A time Hamming window was utilized, and its optimized length is three times that of the frequency samples.
Figure 3.4. Steps of phase-based method to detect vital signs.
Phase based methods use the phase and time delay linear relationship, which drastically suppresses both harmonic distortion and intermodulation products in the retrieved phase information. The retrieved signal has two terms: one is the summation of the frequency components and the second is a dc term. The dc term is mainly a result of the imbalance between the I and Q channels, and we use mean subtraction here to remove both baseband dc and dc offset. By extracting
31
and analyzing the phase of the fast-time samples along a traversed range bin of a subject as shown in Figure 3.4, the displacements caused by respiration and heartbeat can be readily calculated by arctangent demodulation method [43], or complex signal demodulation [43], or state space method [44] or combination.
3.4 Experimental Validation
In this chapter, for experimental validation, four different scenarios were investigated: (a) a single subject was positioned at different orientations with respect to the radar, (b) a single subject was positioned at different distances from the radar, (c) a single subject lying down, (d) two subjects present in the scene. The utilized radar has a transmitted power of 8 dBm, uses two 9 dB gain horn antennas, and its receiver sensitivity is -71 dBm. The phase-based method has been applied to measured data to extract the heart rate and respiratory rate similar to the steps used in simulation [40, 41].
The normal respiration rate of an adult at rest is 12 to 20 breaths per minute, while heartbeat is 60 to 80 beats per minute. Hence, for a person with the slowest breathing rate (i.e. 12 breaths/min) and heartbeat (60 beats/min), 15 second is about 5 cycles of breathing and 15 cycles of heartbeats. These many cycles, would be enough to extract the information of motion. Furthermore, we also want to minimize the corresponding simulation computational time for our modeling efforts for comparison. Thus, in this paper we have considered 15 seconds as an appropriate amount of time needed to run the measurements. Definitely, fewer cycles can be used. For instance, fewer cycles can be employed for detection, and we can keep updating the rates by using say 2 cycles at a time (moving average), to allow faster real time displays.
The observation time; i.e. 15 seconds corresponds to 320 slow-time samples that were acquired. During the experiments, a commercial pulse sensor and respiratory contact sensor were also used to record the heartbeat and respiration rates of the subject(s) and are used as the ground truth. The measured and simulated deviations (errors) from these contact sensor readings are quantized by:
Error =𝑃𝑠−𝑃𝑚
𝑃𝑠 ∗ 100% (3-10)
where Ps is the commercial contact sensor result and Pm is either the measured
or simulated result.
3.4.1 Subject at different orientations
In the first experiment, the subject position was fixed at 1 m away from the radar [24]. The subject had a height of 165 cm, waist size of 78 cm, and was sitting on a
32
chair with the main beam of the antennas in line with her torso level. Four different orientations with respect to the radar were considered as shown in Figure 3.5. Simulated and measured results are shown in Figure 3.6 for these four cases, while Table 3.4 shows the heart and respiratory rates recorded by the contact sensors for the four cases and compares them to both the simulated and measured results. The respiratory frequency errors are within 4%, and heart rate errors are within 2.5%, for both simulations and measurements as listed in Table 3.4 Generally, smaller radar cross-section (RCS) or further distance from the heart leads to an increased error. As expected, the reference case is the best among the four scenarios investigated for simulations, as it has the largest RCS.
Figure 3.5. Subject at different angles. Ref 00, (1) 45°, (2) 90°, (3) -45°.
Table 3.4. The respiratory rates and heart rates from the contact sensors and simulated and measured radar results for the four different orientations.
Case Sensor RR(Hz) Simulated RR (error) Measured RR (error) Sensor HR(Hz) Simulated HR (error) Measured HR (error) Ref. 0.558 (0.14%) (2.20%) 1.043 (0.47%) (0.67%) 1 0.510 (1.57%) (2.52%) 1.101 (0.99%) (2.26%) 2 0.475 (3.78%) (2.85%) 1.091 (2.44%) (1.60%) 3 0.499 (0.16%) (1.70%) 1.063 (0.94%) (1.89%)
Similarly, simulation results show that case 3 results are the least accurate for both respiratory rate and heart rate due to the lower RCS, and the relative position of the heart, which is on the farther side with respect to the radar. However,
33
experimentally it is difficult to see such distinct differences for various practical reasons in the measurement setup, yet such effects still result in less than 3% error.
(a)
(b)
Figure 3.6. The breathing rate and heart beat based on: (a) simulated data (b) measurement for subject in different orientations.
34
3.4.2 Subject at different distances
In the second experiment, the same subject was positioned in front of the radar with the normal to the torso aligned at 0° degree with the radar boresight. The subject was placed at 1 m away laterally from the radar at first, then was subsequently moved to 3 m away as shown in Figure 3.7 and the results are shown in Figure 3.8. The errors for the heart and respiration rate detection of these different cases are shown in Table 3.5 Both simulation and measurement results show that the error worsens as the subject gets further away. As expected, the further the subject is the weaker the received power.
Figure 3.7. Subject at different distances (a) 1m, (b) 3m.
35
Table 3.5. Error percentages for different distances.
Case Sensor RR(Hz) Simulated RR(error) Measured RR(error) Sensor HR(Hz) Simulated HR(error) Measured HR(error) 1 m 0.558 (0.14%) (2.20%) 1.043 (0.47%) (0.67%) 3m 0.40 (2.25%) (3.50%) 1.045 (2.85%) (4.30%)
3.4.3 Subject lying down on ground
In the third experiment, we investigated the case when the same subject is lying down on the ground. The antenna is pointing down to the subject at an oblique angle as shown in Figure 3.9.
The sensor readings for breathing rate and heart beat are 0.45Hz and 1.120Hz, respectively. Although there is a ground effect in this scenario, both simulation and measurement are pretty close to the sensor readings due to the relatively large RCS. The errors for respiration and heartbeat are 0.22% and 0.53% respectively for simulation, while the measurements are at 2.22% and 1.34%. The results are plotted in Figure 3.10. Table 3.6 shows simulated and measured HR and RR for the subject lying down.