Virtual Commons - Bridgewater State University
Virtual Commons - Bridgewater State University
Honors Program Theses and Projects Undergraduate Honors Program 12-9-2019You’re the Boss: The Stereotype Content Model as a Predictive
You’re the Boss: The Stereotype Content Model as a Predictive
Behavioral Tool in Résumé Evaluation Processes
Behavioral Tool in Résumé Evaluation Processes
Caylin M. FariaBridgewater State University
Follow this and additional works at: https://vc.bridgew.edu/honors_proj
Part of the Applied Behavior Analysis Commons, Cognition and Perception Commons, Cognitive Psychology Commons, and the Experimental Analysis of Behavior Commons
Recommended Citation Recommended Citation
Faria, Caylin M.. (2019). You’re the Boss: The Stereotype Content Model as a Predictive Behavioral Tool in Résumé Evaluation Processes. In BSU Honors Program Theses and Projects. Item 308. Available at: https://vc.bridgew.edu/honors_proj/308
Copyright © 2019 Caylin M. Faria
This item is available as part of Virtual Commons, the open-access institutional repository of Bridgewater State University, Bridgewater, Massachusetts.
You’re the Boss:
The Stereotype Content Model as a Predictive Behavioral Tool in Résumé Evaluation Processes
Caylin M. Faria
Submitted in Partial Completion of the
Requirements for Commonwealth Honors in Psychology
Bridgewater State University December 9, 2019
Dr. Elizabeth Spievak, Thesis Advisor Dr. Michael Root, Committee Member Dr. Joseph Schwab, Committee Member
Abstract
Extensive literature has confirmed that hiring discrimination is a persistent problem; less research has focused on the social cognitive mechanisms of prejudicial hiring and its effects on résumé evaluations. The present study evaluated how stereotyped evaluations of minority candidates could be predicted with the Stereotype Content Model (SCM) dimensions of warmth and competence. No published research has demonstrated how SCM group ratings may predict evaluations of individuals and their qualifications for employment. Participants evaluated two résumés for each of five listed job positions and completed a survey packet. One résumé in each pair suggested membership in a minority group: Muslim, transgender, African American, elderly, or Mexican immigrant. Contrary to expectations, minority signaled candidates were generally viewed more positively than the corresponding non-signaled applicant, and participants were more likely to recommend the minority candidate for the specified job. On the SCM,
minority group results replicated past work, but perceptions of minority groups on the SCM did not directly predict résumé evaluations or hiring decisions. SCM ratings were indirectly linked to hiring choices. The more people judged themselves better than society, the more likely they were to hire minority candidates; the more people rated themselves “worse than society” (having less positive views of groups than society), the higher they were in SDO, which was linked to fewer minority hires. Future research on the relationships between the better than average effect, SDO, and the SCM is warranted, as these relationships may become tools used in human resources.
You’re the Boss:
The Stereotype Content Model as a Predictive Behavioral Tool in Résumé Evaluation Processes Despite extensive literature on hiring discrimination, less research has considered why résumé evaluations, the first obstacle applicants typically face, may be prone to bias and discrimination (Derous & Ryan, 2018). A recent meta-analysis by Zschirnt and Ruedin (2016) found that minority group members need to send 1.5 applications for every application sent by an equally qualified member of the majority group, in order to be invited for a job interview. The authors suggest that what is urgently needed is research that strives to identify the mechanisms of prejudicial hiring. Derous and Ryan (2018) offered one descriptive model comprised of three stages, during which stereotypes may influence the often difficult and ambiguous evaluation process: applicant information (stage 1), evaluator information processing and impressions (stage 2), and applicant, workplace and societal outcomes (stage 3). The current study investigated how experimentally manipulated applicant materials (stage 1 information) influenced evaluator impressions and hiring decisions (stages 2 and 3). Furthermore, the study was an attempt to respond to Zschirnt and Ruedin’s (2016) call for more work on social cognitive processing relevant to hiring practices by investigating how stereotyped evaluations of minority groups could be predicted with the Stereotype Content Model (SCM; Fiske et al., 2002) dimensions of warmth and competence. The SCM has emerged as a useful tool to conceptualize cultural stereotypes and predict images of outgroups and associated emotional prejudices. However, it has not been studied in relationship to employer decision-making within résumé and hiring evaluations.
In most cases, the hiring process begins with an applicant’s résumé, which is followed by an interview, and then the decision-making process (Cole, Rubin, Feild, & Giles, 2007).
Résumés play a crucial role in the hiring process, sometimes more so than the employment interview (Dipboye, Fontenelle, & Garner, 1984; Pannone, 1994; Schmidt & Zimmerman, 2004). Identifying and predicting the effects of underlying mechanisms that result in biased hiring practices is critical, as it has important implications for the field of human resources, and may extend to the broader realm of an increasingly diverse society.
Implicit and Explicit Attitudes
Stereotypes can be explicitly denounced, but an individual’s behavior may contradict self-reported attitudes because résumé content may activate associations in long-term memory and facilitate the processing of related information and responses (Shiffrin & Schneider, 1977). Because cultural stereotypes have a long history of learning, which may lead to the development of automated responses (both semantic and evaluative), in some instances, an individual’s response to a social group member may reflect automatic processes, for which there is no conscious intent. When humans are faced with making decisions in conditions of uncertainty, under time constraints, when attentional resources are strained, or when their investment or decision efficacy is low, they tend to rely on heuristics or rules of thumb that reflect stereotypical world knowledge, but are often less relevant to a single circumstance or choice (Tversky & Kahneman, 1974). Examples of heuristics include a variety of mental shortcuts, including stereotypes. Heuristic processing is automatic, fast, requires less effort, and consumes few cognitive resources (Chaiken, 1980, 1987; Chaiken, Lieberman, & Eagly, 1989). In comparison, systematic processing is prompted only when the less effortful heuristic processing produces obviously poor results or low confidence (Maheswaran & Chaiken, 1991; Petty, Cacioppo & Goldman, 1981; Tetlock, 1983). Past research by Tversky and Kahnemann (1974) provides
evidence to suggest that in complex situations, such as in time constrained forced-choice hiring decisions, heuristics may be heavily relied upon.
Wilson, Lindsey and Schooler (2000) describe a dual process model of two distinct forces, systematically driven or explicit attitudes, and heuristically driven or implicit automatic attitudes, both of which independently influence behavior toward the same target. The attitude that people endorse in the moment is dependent upon the availability of cognitive resources and motivation to use them. Explicit processes require attention and effort, and explicit measures reflect conscious awareness about social context, norms, and who we think we are or hope to be (e.g., how we think we feel, believe we should respond, or want to act). Implicit responses result from repeated exposure and practice, and implicit measures reflect embedded knowledge of the world (e.g., stereotypes, social norms, societal expectations and socially programmed responses). Though there are observable relationships between explicit and implicit attitudes (Nosek et al., 2007; Rooth, 2009), explicit attitudes tend to be more malleable and implicit attitudes have a tendency to remain stable (Wilson et al., 2000).
The Hiring Process and Résumé Discrimination
In order to understand the implicit and explicit biases that occur during résumé
evaluations, researchers have focused on résumé content and potential employer responses to this content. Derous and Ryan (2018) proposed a three-stage model to help conceptualize how bias in résumé evaluations occurs: applicant information (stage 1), evaluator information processing and impression formation (stage 2), and evaluator screening outcomes (stage 3). Overall, the model suggests that when stigmatizing applicant information is present in résumés and job-related information is limited, evaluators often engage in the use of automatic stereotypes, which then increases the risk of biased applicant impressions and discriminatory behaviors. Cole et al.
(2007) suggested a similar premise: that as recruiters read and process an applicant’s written descriptions of their background, experience and interest, recruiters’ perceptions of the content can either increase or decrease an applicant’s chances of selection.
Past literature has demonstrated that word choice and language can impact perception and stimulate implicit, automatic stereotypes. For example, Gaertner and McLaughlin (1983) found that word pairs that reflected racial stereotypes (white/intelligence; black/violent) were more easily and quickly understood than counter-stereotype pairs (black/intelligence; white/violence). Similarly, Devine (1989) found that White participants exposed to words that were 80%
stereotypically associated with African-Americans (e.g., poor, lazy, athletic), judged a race-unspecified male target to be more hostile in an unrelated second task. This was in comparison to a group who was exposed to words that were 20% stereotypically associated. More relevant to the current study is research that demonstrates the impact of language, specifically names and extracurricular involvements, on callbacks and interview invitations.
Résumé language acts as a signal that likely affects impression formation (Derous & Ryan, 2018), and can have more of an impact than work experience and qualifications (Cole et al., 2007). For example, a comparison of résumés with African-American or White-sounding names revealed fifty percent more callbacks for interviews for the White names (Bertrand & Mullainathan, 2004). In one study, King, Madera, Hebl, Knight, and Mendoza (2006) paired high or low-quality résumés (signaled by education and GPA) with names that implied a Black, Hispanic, Asian, or White race. King et al. (2006) found that both Black and Hispanic applicants were judged more negatively than equally qualified Asian and White applicants. In an attempt to clarify the importance of race and ethnicity signals, Kang, Decelles, Tilcsik, and Jun (2016) examined levels of résumé whitening and its’ effects on interest in Black and Asian applicants.
Applications listed a whitened first name, whitened experience (i.e., involvements that do not cue race), or whitened first name and whitened experience. The authors found that callback rates were significantly lower for both non-whitened Black and Asian applicants, and were highest for a whitened first name and experience.
Although race and ethnicity related stereotypes have more frequently been the focus of research, stereotypes surrounding age and sexual orientation appear to impair perceptions of applicants as well. In a study that examined implicit age cues in résumés, Derous and Decoster (2017) found that job suitability ratings for applicants with old-sounding names were
significantly lower compared to more contemporary names. Job suitability ratings were also significantly lower for résumés that listed activities stereotypically linked to maturity (member of a bridge club; walking club member), compared to those that signal youth (member of boy scouts; life board rescuer). Similar to Derous and Decoster (2017), Tilcsik (2011) used audit methods in a field study designed to measure discrimination against applicants with listed experience in a gay campus organization. The author found that heterosexual applicants had an 11.5% chance of being invited for an interview, compared to the 7.2% chance for gay applicants, a statistically significant difference. In addition, employers who indicated that they valued and sought stereotypically male heterosexual traits (aggressive, assertive, and decisive) were more likely to discriminate against gay men by providing less positive responses. Overall, past
research on race, ethnicity, age, and sexual orientation stereotypes support the notion that typical decision-making processes for résumés may rely more on evaluators’ implicit feelings and opinions toward the evaluated, instead of an evaluation of competence and experience.
Warmth, Competence, and the Stereotype Content Model
In order to understand the pervasiveness of stereotypes, social cognitive researchers interested in stereotype content have focused on two dimensions, warmth and competence, to conceptualize how social perceptions influence emotions, and behaviors. Many stereotypes use terms related to warmth and competence to differentiate groups. For example, Jews have
historically been described with terms that convey grudging respect for capabilities (low warmth, high competence), and African-Americans with patronizing (warmer, but less competent) terms (Allport, 1954; Bettleheim & Janowitz, 1950). Competence and warmth have also been shown to describe subgroups of women. Nontraditional women (e.g., feminists, lesbians, athletes) have been described as disliked, dominant, and competent, while the terms commonly used to describe housewives include likable, dependent, and incompetent (Deaux, Winton, Crowley, & Lewis, 1985; Eckes, 1994; Noseworthy & Lott, 1984; Six & Eckes, 1991).
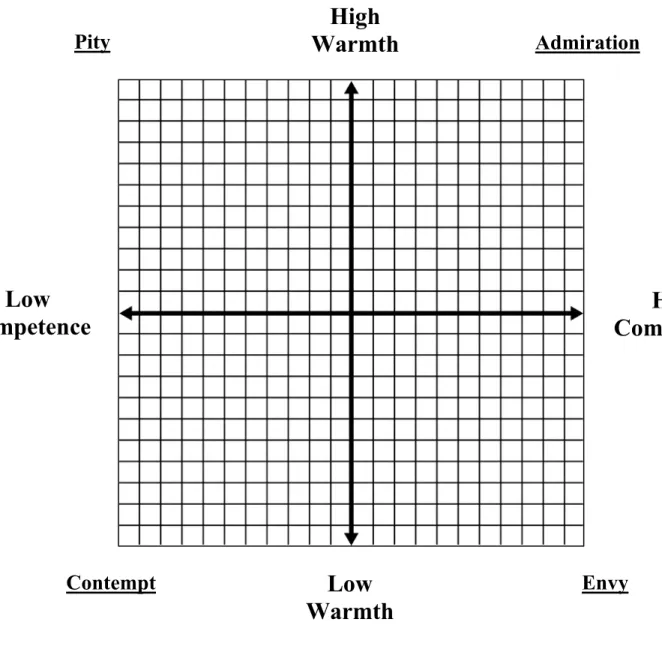
The Stereotype Content Model (SCM) developed by Fiske, Cuddy, Glick, and Xu (2002) provides a formal model based on the dimensions of warmth and competence. The authors found that words that suggested status, reputation, or influence, predicted perceptions of competence, while words that indicated competition for societal resources predicted perceptions of warmth. Based on different ascriptions of these two dimensions, the SCM can graphically illustrate attitudes toward outgroups on a Cartesian grid (see Figure 1). In addition, the model has been used to predict emotional prejudices associated with the four quadrants of the SCM (Cuddy, Fiske, & Glick, 2007; Fiske et al., 2002). High warmth and low competence is associated with paternalistic or protective prejudice; low status individuals that are not competitive garner pity (e.g., elderly or disabled people). Low warmth and low competence is linked to contemptuous prejudice; low status individuals perceived as consumers of valuable resources generate scorn
(e.g., welfare recipients, poor people). Low warmth and high competence is associated with envious prejudice; high status individuals in competition for resources provoke jealousy (e.g., Asians, rich people). Terms that convey both high warmth and high competence are typically reserved for close allies or the in-group (Fiske et al., 2002).
Like other survey measures of attitudes and personality, the SCM is an explicit measure of stereotype beliefs, capturing conscious attitudes about stereotypes. For over 20 years it has been used to analyze the intentional activation of responses to language that describes groups and intergroup relationships (Cuddy et al., 2007; Fiske et al., 2002). Specifically, research using the SCM has focused on bias toward stereotyped groups (Lin, Kwan, & Cheung, 2015), self-threat and resulting prejudice toward groups (Collange, Fiske, & Sanitioso, 2009) historical depictions of groups (Durante, Volpato, & Fiske, 2010), societal level stereotypes and prejudices
(Caprariello, Cuddy, & Fiske, 2009), and cross-cultural similarities and differences in stereotype content (Cuddy et al., 2009).
Although the SCM continues to gather empirical support with more outgroups, emotional prejudices, and diverse samples, additional support may arise from research exploring the
predictive capabilities of the model in résumé evaluations. In one relevant study, Agerström, Björklund, Carlsson and Rooth (2012) used cover letter content to manipulate the degree to which Swedish (in-group) and Arab (out-group) applicants signaled degrees of warmth and competence. The field study measured how many of the over 5600 applicants were invited for interviews. Low-competence applicants used less task-oriented language in the cover letter than high-competence counterparts, and warmth was signaled with indications that the applicants had interests and priorities in life other than income or performance criteria. Consistent with their predictions, derived from SCM research, the results revealed that an Arab applicant needed to
signal both more warmth and more competence than a similar ingroup applicant to have the same chance of being invited to a job interview.
Agerström et al.’s (2012) large field study suggests that SCM biases are relevant to résumé evaluations, but their focus was on signaling warmth and competence, not on how warmth and competence may be perceived or inferred based on evaluator heuristics because, as is true with most field studies, they had no access to hiring official attitudes. As asserted by Zschirnt and Ruedin (2016), this missing social cognitive component is relevant because hiring officials likely employ their personal attitudes during objective résumé evaluations, whether they are aware of it or not. In order to test mechanisms of prejudice during evaluations, the influence of stereotypical knowledge and embedded attitudes should be measured and accounted for, as should self-awareness and the explicit desire to adhere to social norms.
The current study attempted to address the limitations of field studies (such as Agerstrom et al., 2012; Bertrand & Mullainathan, 2004; Derous & Decoster, 2017; Kang et al., 2016; Tilcsik, 2011) by including the SCM and two other common individual difference measures: social dominance orientation and socially desirable responding. Zschirnt and Reudin (2016) specifically referenced the potential implications of status hierarchies, or how groups are ranked according to social position, and associated negative stereotypes. Social dominance orientation (SDO; Pratto, Sidanius, Stallworth, & Malle, 1994), or an individual’s support for group-based hierarchies, would therefore be relevant to résumé evaluations, as beliefs about whether one’s own group should dominate other groups could impact decision-making toward minority group members. The second measure, social desirability (SD; Crowne & Marlowe, 1960), which assesses whether or not respondents are concerned with social approval, is also relevant to measure. While negatively biased assessments of minority groups have been the focus thus far,
there is evidence that evaluations may sometimes be biased in the opposite direction, and that minorities may benefit from selective leniency. Evaluating minority individuals may make respondents feel uncomfortable and motivate them to overcome their implicit biases and
compensate with explicitly positive responses (Harber, 1998), thereby communicating to others that they believe in equality (Carver, Glass, & Katz, 1978) and convincing themselves that they are unbiased (Gaertner & Dovidio, 1986). During self-reports that may reveal prejudices, people may over report socially approved behaviors and be unwilling to admit their true response because they want to gain social approval, or to avoid embarrassment over a response that is not acceptable to others or to oneself (Rooth, 2009).
The Present Study and Hypotheses
This project aimed to fill the void in the hiring and stereotype literature by testing the usefulness of the SCM in predicting how applicant information (names and activities),
influenced evaluator impressions and hiring recommendations. The goal was to replicate prior work on the SCM (e.g., placement of the elderly and African-Americans on the SCM) and on the effects of language signals on hiring practices (e.g., lower assessment ratings of
African-American, Hispanic, and elderly applicants), and extend the research in both fields to measure outcomes for understudied, but marginalized groups (transgender, Muslim, Mexican immigrant). Participants in the current study evaluated pairs of résumés; one résumé in each pair represented a member from a specified minority group (Muslim, Mexican immigrant, transgender, elderly, African American). Minority groups were selected based on relevance to modern society. Some groups were previously researched (e.g., elderly, African-American; Fiske et al., 2002). The remaining groups are those currently targeted by society, and appear at the forefront of news
stories or national dilemmas (e.g., Muslims, transgender, Mexican immigrants; Nosek et al., 2007).
Participants completed a survey packet that included standardized personality and attitude scales. They responded to a measure of SDO (Pratto et al., 1994), which captures beliefs in societal group hierarchies, and is commonly included in studies that measure personality and individual differences (Derous & Ryan, 2018). The packet also included a measure of socially desirable responding, which assesses whether or not respondents are concerned with social approval (Crowne & Marlowe, 1960). Participants completed two versions of the SCM scale: the original version (society’s view of the group) and an adapted version (participant’s personal view of the group). The purpose of including two SCM scales was to replicate and extend research on stereotypes using the SCM, and to identify the congruency between responses on the original SCM, the adaptation (SCM personal view), and résumé evaluations.
Hypothesis 1: Minority résumés will be more negatively evaluated than non-minority résumés. With regard to résumé evaluations, it was expected that materials that signaled the applicant as older or African American would lower assessment ratings, a replication of previous research (Bertrand & Mullainathan, 2004; Derous & Decoster, 2017). This effect was expected to remain true for both the résumé evaluations and the applicant evaluations, and extend to materials that signaled the applicant as Muslim, transgender, or Mexican immigrant.
Hypothesis 2: Society SCM minority groups’ ratings would generally be negative.
With regard to the society SCM perception, it was hypothesized that the resulting graph of groups would replicate previous research on the elderly and African Americans (Fiske et al., 2002), and that the extension to less studied groups (Muslim, transgender, Mexican, immigrant)
would reflect corresponding intergroup stereotypes and prejudices.Specifically, it was
hypothesized that the elderly would be within the high warmth but low competence quadrant and African Americans would be in the low warmth and low competence quadrant. It was
hypothesized that the Muslim, Mexican, transgender, and immigrant groups would be considered low in warmth and low in competence.
Hypothesis 3: Participants would endorse little personal bias, but their perception of society’s biases on the SCM would still predict discriminatory behavior. In alignment with the dual process model of implicit and explicit attitudes, it was hypothesized that participants would rate themselves as less biased than society, but that their evaluation of society’s views (SCM ratings of a group’s warmth and competence) would nonetheless predict discriminatory behavior in rating and selecting a job candidate. For example, Cuddy et al. (2007) found
evidence that SCM ratings were linked to social exclusion, a behavior the authors characterized as passive and not the result of deliberative thought. No specific behaviors were investigated, but the authors suggested that one outcome might be failure to hire members of a specific group. Though both SCM measures ask for explicit beliefs, the “as viewed by society” scale perception does not place personal pressure on the participant and can tap into cultural knowledge,
including implicit awareness of stereotypes (Fiske et al., 2002), while minimizing socially desirable responding (Fiske, 2018).
Method Participants
One hundred thirty-three participants (46 males, 86 females, 1 non-binary, Mage= 20.21,
age range: 18 – 44 years, SD = 3.6) recruited from the Bridgewater State University Psychology department’s SONA subject pool, took part in this research study in exchange for course credit.
Most participants identified themselves as Freshman (53.8%), while the others were Sophomores (24.2%), Juniors (12.9%), and Seniors (9.1%). The majority of the sample consisted of
Caucasian individuals (57.1%). Others identified as African-American (12%), Asian-American (3%), Latin-American (6.8%), European-American (2.3%), or indicated mixed heritage (6%) or other (12%).
Materials and Measures
Résumés. The résumés used in this research study were created through adaptations of past research studies (e.g., Bertrand & Mullainathan, 2004; Derous & Decoster, 2017; Kang, Decelles, Tilcsik, & Jun, 2016; Tilcsik, 2011). The two résumés examined for each job position were essentially identical in every way. Both applicants had the same type and length of
occupational and educational experience. The only aspects that differed between the two applicants were the names, along with their experiences, extracurricular activities, and/or involvements. All names were chosen based on past research (Bertrand & Mullainathan, 2004; Derous & Decoster, 2017; Kang, Decelles, Tilcsik, & Jun, 2016; Tilcsik, 2011) or by statistically popular names in Massachusetts (“Popular Names by States”, n.d.). The experiences,
extracurricular activities, and/or involvements were manipulated on one résumé in the pair, while the other résumé maintained vaguely associated involvements. The minority signaled applicants had involvements with clubs or organizations that represented their minority group, in alignment with past research studies (Derous & Decoster, 2017; Tilcsik, 2011).
One of the résumés in each pair was ambiguous; these résumés implied a Caucasian man of unknown age and religion, with non-signaling experiences and involvements (e.g., James Sullivan, accounting club). For the African-American résumé, the name Lamar R. Smith was chosen, along with involvement in the Black Student’s Association. The transgender résumé had
a gender-neutral first name, Dakota F. Lucas. This applicant also had involvement with the Transgender Alliance group and worked as a mentor for transgender youth. The elderly résumé had the name Ernest Kenneth, with extracurricular activities in a bridge and country club. The Mexican immigrant résumé used the name Jose Gonzalez, with involvement in the Association of Mexican Professionals in Finance and Accounting (ALPFA). Additionally, to further signal the Mexican applicant as an immigrant, an out-of-country university reference was listed. The last résumé for the Muslim applicant used the name Mohammed J. Wilson, with involvement in an Arab Film Club and Muslim Alumni Association. (See Appendices A and B for sample résumés.)
Stereotype Content Model. Stereotype content was measured by the Stereotype Content Model (SCM; Fiske et al., 2002). This scale includes twelve terms scored on a five-point Likert scale from 1 (Not at all) to 5 (Extremely). Participants are asked to answer how competent, confident, capable, efficient, intelligent, skillful, friendly, well-intentioned, trustworthy, warm, sincere, and good-natured a group (student, Muslim, African American, elderly, transgender, Mexican immigrant) is through the perspective of modern society. Half of the terms relate to the warmth dimension, whereas the other half relate to the competence dimension (competence = .94; warmth = .90 as reported by Fiske et al., 2002). An adaptation of this scale was included along with the original. Following the original scale where participants rated groups as viewed by society, they also used the same scale to rate groups as viewed by themselves (see Figure 2).
Social Desirability Scale. The social desirability scale ( = .88 as reported by Crowne & Marlowe, 1960) measures whether or not participants are concerned with social approval through thirty-three forced choice items, with the response options being either T (True) or F (False).
Sample items include, “I like to gossip at times” and “I never hesitate to go out of my way to help someone in trouble” (Crowne & Marlowe, 1960).
Social Dominance Orientation Scale. The social dominance orientation scale ( = .91 as reported by Pratto et al., 1994) measures support for group-based hierarchies, a personality characteristic which has been linked to social and political attitudes. It is a sixteen item, seven-point Likert scale ranging from 1 (Extremely Negative) to 7 (Extremely Positive). Sample items include, “We should strive to make incomes as equal as possible” and “Inferior groups should stay in their place” (Pratto et al., 1994).
Procedure
Upon arrival to the lab, participants were led to a designated room where they were pre-briefed. Participants reviewed and signed consent materials before they completed their
evaluations of résumé applicants, their attitudes in general, and their attitudes toward groups. First, participants were instructed to read a vignette that described the purpose of the résumé evaluations. Participants were instructed to evaluate résumé applicants and to suggest which individual, in the pair, would be best suited for the designated job position. They were asked to evaluate the résumé appearance (neatly typed, spelling accuracy, correct grammar, appropriate font, appropriate size) and the résumé organization (easy to follow, appropriate format, understandable entries, adequate explanations) on a five-point Likert scale from 1 (Far below standard) to 5 (Far above standard). Participants evaluated the applicant’s personal qualities (intelligent, efficient, skillful, friendly, responsible, competent, motivated, likable, trustworthy, professional) on a five-point Likert scale from 1 (Not at all) to 5 (Extremely), based on an adaptation from King et al.’s (2006) evaluation scale. Participants were then instructed to choose which applicant they would hire for the designated job position.
Once participants completed the résumé portion of the research study, their work was collected by the researcher and they received a pencil-and-paper survey packet. In the first half of the packet, participants were instructed to rate their personal views and society’s views about a specific group (student, Muslim, transgender, African-American, Mexican, immigrant, elderly) on the SCM. The sequence of these two scales were counterbalanced (personal/society,
society/personal) to avoid priming. Approximately half of the sample received the SCM scale that inquired about the participant’s personal views first. Participants then completed a SD scale and SDO scale following the SCM scales. Participants were thanked and debriefed when they finished the survey.
Results
In preparation for data analysis, scale means, internal reliability coefficients, and scale intercorrelations were computed. As obliged by Fiske et al.’s (2002) model, raw SCM ratings were transformed from a 1 to 5 scale into a -2 to +2 scale, and aggregate scores of warmth and competence were computed. Scores for SDO and SD were computed according to scale scoring instructions. Means for overall minority warmth and competence, SDO, SD, and the scale intercorrelations are presented in Table 1. Reliability coefficient scores were acceptable to strong: Cronbach’s alpha was .77 for the SD scale, .86 for SDO, and ranged from .82 to .95 for the SCM measures of warmth and competence.
Hypothesis 1: Applicant Ratings and Candidate Selection
A series of paired sample t-tests were used to test the hypothesis that résumé materials that signaled an applicant as older, African American, Muslim, transgender, or Mexican
immigrant would result in lower assessment ratings. Aggregated mean scores were calculated for résumé qualities (appearance and organization) and for personal characteristics. Contrary to the
hypothesis, participants evaluated the minority candidates more positively on both personal characteristics and résumé qualities (see Table 2). All minority candidate résumés (Mexican immigrant, African American, elderly, transgender, Muslim) were rated significantly higher than the non-minority candidate résumé. The transgender, Mexican immigrant, African American, and Muslim candidates were rated higher on personal characteristics than their corresponding non-minority applicant. There was no significant difference between the elderly and the corresponding non-minority applicant in personal characteristic ratings.
A series of Chi-square tests were used to evaluate the dichotomous decisions to recommend (or not recommend) a candidate for hire. For each decision, participants were significantly more likely to recommend the minority candidate (transgender, African American, elderly, Mexican immigrant, and Muslim) than would be expected if the manipulation of résumé signals had no effect (see Table 3).
A series of point-biserial correlations were conducted to compare candidate overall ratings with the dichotomous decisions to recommend a candidate for hire. The decision to hire each minority candidate was significantly positively correlated with higher overall ratings for the candidate, however the decision to hire the non-minority candidate was not strongly linked to the candidate rating. Correlation coefficients appear in Table 4.
Hypothesis 2: Stereotype Content Model
In order to test the hypothesis that the resulting SCM graph of groups would replicate previous descriptive model results regarding the elderly and African Americans (Fiske et al., 2002), and reflect similar biases (i.e. in the low warmth and competence quadrant) for less studied groups (Muslim, transgender, Mexican, and immigrant), the means for warmth and competence dimensions for each perception (personal/society) were plotted along the axes of
warmth and competence (see Figure 3). Results partially supported the hypothesis. Participants indicated that society perceived the elderly as leaning toward low competence, but high in warmth. Participants indicated that society perceived African Americans as neutral in
competence but moderately low in warmth. For transgender, Muslim, immigrant, and Mexican groups, participants indicated that society tended to perceive these groups as more negative in both dimensions. On the contrary, participants believed that society would rate the ingroup (students) as moderately warm and competent. Specific details of group placement can be viewed in Figure 3.
The hypothesis that participants would rate themselves as less biased than society was supported. A within subjects’ comparison of mean ratings indicated that overall personal ratings for minority group warmth and competence were significantly higher than society ratings, Fwarmth
(1, 131) = 196.6, p < .001, partial ƞ2 = .60; Fcompetence (1, 131) = 208.4, p < .001, partial ƞ2 = .61.
A series of t-tests was performed and with the exception of students, all society/personal minority group rating discrepancies on both dimensions were significant (see Table 5).
Participants personally rated the elderly, transgender, Mexican, immigrant, Muslim, and African-American groups more positively on both dimensions compared to how society would rate these groups. For the society ratings, all minority groups besides the elderly group had averaged warmth and competence scores that were on or within the margins of the opposing quadrant (low warmth, low competence) compared to the quadrant of the personal ratings (high warmth, high competence).
Hypothesis 3: Relationship between the SCM and Résumés
The hypothesis that participants’ evaluation of society’s views (SCM ratings of group warmth and competence) would predict discriminatory candidate rating and selection was not
supported. Personal and society SCM ratings for minority groups did not significantly correlate with applicant ratings for the associated minority group candidate, or with hiring the minority group member.
Exploratory Analyses
In order to further explore the relationship between the SCM and résumé discrimination, overall difference scores were calculated for both warmth and competence by measuring the discrepancy between the society and personal perceptions for all minority groups on both
dimensions. Then, these overall warmth and competence difference scores were correlated with a bias toward minority score, which represented the sum of the number of minority hires (0 - 5). Results indicated that the more people judged themselves better than society (less prejudiced) the more likely they were to hire minority candidates. The effect was marginally significant for competence (r = .17, p = .05) and significant for warmth (r = .21, p = .01).
To examine whether SDO had a significant role in participants’ hiring biases, Pearson’s correlations were used. Results revealed that those who scored high in SDO recommended significantly fewer minorities (r = -.20, p = .03). SDO also predicted more negative personal evaluations of minority groups (rpersonal competence = -.40, p < .001, rpersonal warmth = -.44, p < .001)
compared to how they believed society would rate them (rsociety competence = .19, p = .04, rsociety warmth = .25, p = .01). For more specific correlations between SDO and minority groups’ warmth
and competence scores (i.e., individual correlations for each SCM minority group), see Table 6. In order to test the effects of SD on participants’ opinions and evaluations, Pearson’s correlations were conducted. While SD did predict more positive scores for society’s overall SCM ratings of minorities (r society competence = .24, p = .01, r society warmth = .28, p < .005), there was no relationship between SD and personal SCM ratings for specific minority
groups (more details appear in Table 1). There was no relationship between SD and bias toward minority hire, or evaluations of minority candidates’ personal characteristics or résumé qualities.
Discussion
The current study examined three hypotheses about the cognitive processes that may underlie hiring bias. First, it tested the prediction that minority résumés would be more
negatively evaluated than equivalent non-minority résumés, as indicated by previous research on implicit biases, such as stereotypes, that generally affect difficult and ambiguous decisions (such as deciding between equally qualified candidates), and have been linked to hiring bias in field studies. Second, prior work on SCM ratings was replicated, and was extended by adding new groups. Third, a set of parallel SCM ratings for personal views was developed, and personal and society SCM ratings were evaluated as predictors of hiring bias. Contrary to expectations,
minority candidates in this sample were generally viewed more positively than the corresponding non-minority applicant, and participants were more likely to recommend the minority candidate for the specified job. As expected, society SCM minority group results replicated past work and the extension to other groups reflected similar biases. Participants generally reported personal SCM attitudes towards minorities that were higher than society’s, suggesting that the measure reflected conscious awareness about social context and norms. The expectation that their evaluation of society’s views (SCM ratings of group warmth and competence) would predict discriminatory behavior in rating and selecting a job candidate was not supported. However, SCM ratings were more indirectly linked to hiring choices in that participants who indicated that society’s views were more positive than their own were less likely to recommend minority candidates. In addition, those who scored high in SDO were less likely to recommend hiring the minority candidate during the résumé evaluation process.
Hypothesis 1: Applicant Ratings and Candidate Selection
Contrary to the hypothesis and past research on résumé discrimination with race
(Bertrand & Mullainathan, 2004), ethnicity (Kang et al., 2016; King, et al., 2006), age (Derous & Decoster, 2017), and sexual orientation (Tilcsik, 2011), participants in this sample generally viewed the minority applicant more positively on personal characteristics and on résumé quality, and consistently chose to recommend the minority applicant for hire in comparison to the non-minority applicant. However, applicant evaluations, résumé evaluations and hiring decision results appear to partially support Derous and Ryan’s (2018) model of résumé evaluation bias. The model suggests that stigmatizing applicant information in résumés can signal attributes that influence evaluators to form impressions using heuristics, such as stereotypes, which then increases biased behaviors (e.g., hiring discrimination, lack of workplace diversity). In the current study, positive evaluations of applicant characteristics and résumé qualities for the minority candidate suggests that participants did interpret signals from the otherwise equal résumés (stage 1). Then, participants appeared to form impressions based on these signals, and because these signals referred to race, ethnicity, age, religion, and gender, it is likely that one candidate in each pair was identified as a minority through the use of stereotypes (stage 2). The question of whether participants engaged in biased, discriminatory behavior through the
consistent selection of the minority candidate is less clear.
It is possible that sample participants valued diversity and adhered to public policies dedicated to promoting minority hires. The current sample was enrolled in an institution,
Bridgewater State University, that heavily promotes social justice and includes this in its mission statement. In particular, the university houses the Martin Richard Institute for Social Justice, which aims to build knowledge about social justice, empowers individuals to work for social
justice, and facilitates action that advances social justice (“Martin Richard Institute for Social Justice”, n.d.). Within this institute is The Bridge Partnership, The Community Service Center, and Jumpstart. Many students partake in these initiatives, and those who do not may still support them. Participants were not asked about their social justice involvements, or their attitudes
toward social justice. However, it is possible that the majority of the current sample valued social justice, therefore engaging in behaviors such as affirmative action policies. Affirmative action policies have resulted in increased numbers of underrepresented demographic groups in the workplace (Kravitz & Platania, 1993), by considering demographics when applicants have equal competencies (as they had in this study), thus aiding minority candidates. Participants were not asked whether they endorsed public policies related to affirmative action, but the explanation that participants valued social justice and diversity public policies is indirectly supported by the absence of significant correlations between SD and ratings of candidates’ personal characteristics and résumé qualities.
Another explanation is that participants’ positive ratings were driven by political
correctness, or avoidance of ideas or viewpoints that are offensive to certain groups (Anderson, 1993). The current sample consisted of participants at Bridgewater State University in
Massachusetts, a state that typically endorses more liberal views. Participants may have been more positive toward the minority candidate specifically because the candidate was a minority, and the participants did not want to “offend” or be viewed as discriminatory. Carver et al. (1978) and Harber (1998) found that evaluations communicated in a feedback encounter might result in positive biases, perhaps because of a desire to express commitment to social equality. Harber (1998) found a positive bias in that that majority members gave more favorable feedback on poorly written essays when the author was described as a minority group member (Blacks). The
positivity bias appeared only for subjective and ambiguous criteria (comments on essay content and reasoning), not for objective standards (grammar and spelling). Thus, in this study the responsibility of criticizing minority résumés may have aroused concerns (e.g., of appearing racist, of violating internalized values), leading to a bias in the form of consistently choosing the minority candidate. In support of this explanation, Brief, Dietz, Cohen, Pugh and Vaslow (2000) found that recruiters were less prejudicial in résumé-screening situations where bias would have been obvious (e.g., attributable to themselves), or when there was an external reason not to react in a biased way (e.g., political correctness).
Though the résumé and hiring evaluations may represent socially desirable responses, it is difficult to explain the null results with regard to the measure of social desirability. SD was significantly correlated with positive scores on the society version of the SCM, which was unexpected; because respondents reported society’s views, it should have minimized responses based on SD (Fiske, 2018). In addition, SD was not correlated with personal SCM evaluations, which is also counter intuitive. However, the SD scale may not have captured the attitudes as intended. Although the reliability was adequate in the current study (a = .77), past literature suggests that the SD measure may be lacking in its factor structure and internal-consistency reliability (Loo & Thorpe, 2000). The authors suggested that the full scale used in this study may measure phenomenon beyond Crowne and Marlowe’s (1960) original conceptualization of approval-seeking behavior. Thus, it is unclear whether participants engaged in discriminatory behavior or “morally” just behavior.
Hypothesis 2: Stereotype Content Model
The results from this sample’s society SCM ratings partially supported previous SCM research regarding elderly and African American groups. Participants indicated that society
perceived the elderly as leaning toward low competence but high in warmth, replicating previous findings (Fiske et al., 2002). For African Americans, current study participants indicated that society’s view was more negative on both dimensions compared to previous research, and were more aligned with evaluations of a “poor Blacks” subgroup in previous research. Fiske et al., (2002) first examined SCM ratings for “Blacks” and found that this outgroup was moderately warm and moderately competent. However, when the authors examined two subgroups that were created by social class, “poor Blacks” and “Black professionals”, they found that the “poor Blacks” subgroup was rated as low warmth and low competence, while the “Black professionals” subgroup was rated as moderate warmth and high competence, demonstrating that subgroups of the larger group “Blacks” elicit different perceptions. It is not known whether participants in the current sample may have thought more of “poor Blacks” when asked to evaluate the African-American outgroup, but the SCM ratings (low warmth and low competence) have been linked to detachment and a willingness to passively harm the outgroup (Cuddy et al., 2007). Passive harm would include knowing that an applicant was a minority and refusing to do anything on their behalf. This sentiment was not reflected in the candidate evaluations, so it may be that the SCM group “Blacks” and the African-American applicant were judged to represent different
subgroups one “poor” (the SCM group) and the other “professional” (the applicant).
The society ratings of the Mexican group were also low in both warmth and competence. This finding is consistent with Fiske et al.’s (2002) SCM models evaluating a broad Hispanic outgroup, which was rated consistently as low in warmth and low in competence. Lee and Fiske (2006) also found that Mexican immigrants were generally viewed in the low warmth and low competence quadrant. These findings suggest that Mexicans, whether broadly defined as Hispanics or whether subdivided as immigrants, are generally viewed negatively and appear in
the low warmth and low competence quadrant. Other groups that fall within this same quadrant in past literature are poor people and farm workers (Lee & Fiske, 2006), and blue-collared workers (Fiske et al., 2002). Perhaps the more negative perceptions toward Mexican groups may be because individuals attribute competence to prestigious jobs and economic success, resulting in low competence for this group (Lee & Fiske, 2006). The immigrant group was rated as very low in warmth and moderately low in competence on the society SCM. This finding is in
alignment with past research that suggests that the initial perception of generic immigrants is low competence and low warmth (Fiske & Neuberg, 1990; Lee & Fiske, 2006). Moreover, Lee and Fiske (2006) found that subgroups of immigrants, specified by nationality and social status, were represented with different perceptions of warmth and competence. Undocumented immigrants were found to be in a cluster that had the lowest competence and low warmth, embodying the image of a low-status migrant or farm-worker class (Lee & Fiske, 2006). Warmth is attributed to those who are not competitive for jobs and resources. Perhaps the explanation for low warmth is linked to the current political climate, including assertions that Mexicans and foreign immigrants are “stealing” jobs (Walley, 2017). Again, there was no evidence of willingness to passively harm the Mexican immigrant job applicant, so it may be that participants were thinking of different subgroups when they completed the SCM than when they engaged in the résumé task.
Society SCM ratings for the Muslim group leaned toward low competence and was the lowest in warmth, compared to the other minority groups. This is aligned with some past research by Fiske et al., (2002). In one sample, the outgroup “Arabs” were rated as slightly low in competence and very low in warmth. Though these two groups do not necessarily represent the same individuals, the current sample may have identified these two groups as being similar or identical, which is a popular misconception in the United States (Suleiman, 1999). Perhaps one
explanation for this negative perception of warmth, which can also be understood as one’s trustworthiness (Lee & Fiske, 2006), is current fears toward ISIS, and possibly reemerging islamophobic attitudes from post 9/11 (Nosek et al., 2007).
The transgender group was rated on the society SCM as slightly low in warmth, and low in competence. This group has not been heavily investigated using the SCM, but they were more negative in comparison to evaluations of other groups within the LGBTQ+ community. For example, Fiske et al. (2002) found that “Gay men” were viewed as moderately warm and
competent. Similarly, Brambilla, Carnaghi, and Ravenna (2011) found that “Lesbians” were also viewed as moderately warm and competent. One explanation for the indications that society views the transgender group more negatively may be recent increases in public dialogue about gender and attitudes toward transgendered individuals, including dilemmas regarding public bathroom use (e.g., using bathrooms according to one’s gender and not one’s sex) and military enlistment (e.g., Trump administration claims that transgender service members undermine combat readiness; Goodwin & Chemerinsky, 2019).
All society minority group ratings fell within the same quadrant of low warmth and low competence, with the exception of the elderly group. An overarching explanation for the similar negativity toward the African American, immigrant, Mexican, Muslim, and transgender groups may be described through power relations. According to the social structural hypothesis of the SCM, stereotypes reflect the perceiver’s knowledge of power relations in society (Lee & Fiske, 2006). It is possible then, that in this sample, current power relations may have informed the participants’ perceptions of minority groups through society’s view. These power relations have become tense and have plagued media and news networks, and became especially prominent after the presidential election of Donald Trump. The Federal Bureau of Investigation reported a
rise in hate crimes and violence toward minorities during the presidential election year (Inwood, 2018).
Power relations may also explain why the elderly group was located in a different quadrant compared to the other groups. Society ratings for the elderly group was seen as high in warmth, whereas society ratings for African American, immigrant, Mexican, Muslim, and transgender groups were perceived as generally lower in warmth. Warmth reflects a group’s intent (e.g., trustworthiness, friendliness, well-intentioned), therefore it is fundamental, because intent predicts behavior (Fiske, 2015, 2018). That the elderly group was viewed high in warmth suggests that participants believe that society finds the elderly very well-intentioned and non-threatening to the ingroup, with no real threat to power relations, as opposed to the other minority groups in this sample. It also may suggest that when participants think of the elderly, they may not think of elderly African American, immigrant, Mexican, Muslim, and transgender individuals, as these broad minority groups were generally perceived as low in warmth.
Participants rated their ingroup, students, as moderately high in warmth and in
competence, and indicated that society would rate them similarly. The results were comparable to past research from BSU samples surveyed in 2012 and 2017-2018 (Faria & Spievak, 2018). Ingroup favoritism is apparent, particularly among students (Fiske, 2015) and this may be because individuals view the ingroup as extensions of, or overlapping with, the self (Smith, 1993). In support of this, past research on group narcissism suggests that group narcissism is a sublimation of individual narcissism, and the individual satisfies their narcissistic cravings by belonging to and identifying with a group (Emmons, 1987). Personal gratification can be sacrificed for other things, such as enhancement of the ingroup, and perceived threat to ingroup feelings of superiority and entitlement can result in negative emotional responses, including
aggressive behaviors toward the offending outgroup (Lyons, Kenworthy, & Popan, 2010). Thus, the ingroup is rated positively on dimensions of warmth and competence through personal perceptions, but also through society’s perception, in order to maintain the ingroups image of superiority.
The significantly different placements of minority groups according to the
personal/society perceptions on the SCM demonstrates a phenomenon that is known as the better-than-average effect (BTAE). This effect suggests that when asked to compare abilities, skills, or personality traits with an average person, most people believe that they are superior (Alicke, 1985). It is possible that in this sample, participants truly were better than a society perceived as full of bias and discrimination, and therefore personally rated the SCM groups with positivity. This may also be indirectly supported with participants’ possible social justice and affirmative action behaviors on the résumé task. However, the BTAE is often thought of as self-serving in that it enhances or maintains positive self-image. Some recent studies have found evidence for the BTAE in participant evaluations of susceptibility to bias (Pronin, 2007; Pronin, Lin, & Ross, 2002), and in attitudes and opinions about sociopolitical issues (Cohen, 2003). The significant difference in the ratings between the society and personal perceptions of the SCM support the better-than-average effect (Alicke, 1985) in that participants evaluated the minority groups more positively on the dimensions of warmth and competence compared to their
perception of society’s evaluations. The results may also support Cohen’s (2003) and Pronin et al.’s (2002, 2007) findings, suggesting that participants may be aware of the power of social norms and their influence on others, but believe they are immune to the effects.
Hypothesis 3: Relationship between the SCM and Résumés
The finding that the BTAE between the society and personal perceptions of minority groups correlated with discrimination against minority résumé applicants was not hypothesized, and revealed a potentially interesting relationship. Although individually these perceptions did not predict discriminatory behavior, the resulting BTAE may have predictive capabilities. The more people judged themselves better than society, the more likely they were to hire minority candidates; the more people rated themselves “worse than society” (having less positive views of groups than society), the higher they were in SDO, which was linked to fewer minority hires. The first result may be aligned with research described above in which there was compensatory positive evaluations of minorities (Carver et al., 1978; Harber, 1998) and less discriminatory résumé-screening when it would be obvious to the self or others (Brief et al., 2000). The second finding offers support for the inclusion of explicit measures of attitudes. The dual-process model points to the importance of explicit measures for understanding controlled behavior, including prejudicial attitudes and discriminatory behavior toward multiple out-groups. The SDO scale predicts a range of sociopolitical and intergroup phenomena, including generalized prejudice (see Pratto, Sidanius, Stallworth, & Malle, 1994, among others). In a meta-analysis, Jost, Glaser, Kruglanski, and Sulloway (2003) found support for a motivational component of SDO that includes justification of inequality, a social cognitive process that may have led to personal SCM ratings and résumé evaluations that reflected participants’ self-reported basic personality
tendencies. Current study results indicate that Zschirnt and Reudin’s (2016) concern that those with strong beliefs in status hierarchies may engage in discriminatory hiring was a legitimate one.
Limitations and Future Directions
Though the present study attempted to adapt methodologies from past research, it should be noted that the present sample consisted of undergraduate college students, limiting
generalizability and ecological validity. Additionally, the sample size was modest for evaluations of student attitudes and opinions toward certain stereotyped groups, and the study utilized a within-subjects design, which may include carryover effects. One measure, the social desirability scale, may not have captured a tendency to engage in socially desirable responding on the
résumé evaluation task. With regard to the SCM, the stereotype differentiation for the Mexican immigrant group on the SCM could not be clearly linked to the résumé task because the SCM group scales were split into two groups: “Mexicans” and “immigrants”. Last, the SCM groups used in this sample were broad representations of particular minority groups, and limited the specificity of students’ attitudes toward potential subgroups (i.e., African Americans vs. poor Blacks, African Americans vs. Black professionals). Past research has demonstrated that
subgroups may be differentiated on the SCM differently as compared to the overall group (Fiske et al., 2002; Lee & Fiske, 2006). With the résumé evaluation task, no manipulation checks were implemented, and open-ended questions that allowed participants to justify their hire
recommendations were removed due to the time constraint of study sessions.
Future research should focus on attempts to further understand the relationship between the better-than-average effect within the SCM and discrimination toward minority individuals. This may demonstrate usefulness within populations that actively review minority individuals for hire, such as within human resources. Future research should also seek to understand a potential link between SDO and résumé evaluation and hiring discrimination, particularly within contexts
where there is a forced-choice between equally qualified minority and nonminority individuals/groups.
Conclusion
In most cases, the hiring process begins with an applicants’ résumé, which is followed by an interview, and then the decision-making process (Cole, Rubin, Feild, & Giles, 2007).
Résumés play a crucial role in the hiring process, sometimes more so than the employment interview (Dipboye, Fontenelle, & Garner, 1984; Pannone, 1994; Shmidt & Zimmerman, 2004). Approximately 98% of North American companies use résumés as their first selection hurdle (Piotrowski & Armstrong, 2006). However, many applicants may not reach the second or third part of the hiring process, perhaps due to biases that impact the evaluation résumés and candidate choices (Derous & Ryan, 2018). Past research has found that résumé signals that prime
stereotypes, such as names and experiences, produce differential outcomes for minority
applicants. The current study answered a call for more research on the cognitive mechanisms of hiring bias (Zschirnt & Ruedin, 2016), by testing the efficacy of the SCM as a predictor of biased processing. The SCM has been used extensively to differentiate cultural stereotypes and their link to the emotions that impact intergroup relations. This study aimed to fill the gap in the literature by evaluating the congruency between the SCM and between résumé and applicant evaluations. Although the results did not support the hypothesis that evaluations of society’s views on the SCM would predict discriminatory behavior in rating and selecting a job candidate, the study suggests that there is reason for further exploration. SCM ratings were indirectly linked to hiring choices in that participants who indicated that society’s views of minority groups were more positive than their own were less likely to recommend minority candidates, and scored
higher in SDO, which was also linked to discriminatory hiring decisions. These potential relationships may be the basis for future tools used to assess potential biases in employers.
References
Agerström, J., Björklund, F., Carlsson, R., & Rooth, D.-O. (2012). Warm and competent Hassan = cold and incompetent Eric: A harsh equation of real-life hiring discrimination. Basic and Applied Social Psychology, 34(4), 359-366. doi:10.1080/01973533.2012.693438 Alicke, M. D. (1985). Global self-evaluation as determined by the desirability and controllability
of trait adjectives. Journal of Personality and Social Psychology, 49, 1621-1630. doi:10.1037/00022-3514.49.6.1621
Allport, G. W. (1954). The nature of prejudice. Reading, MA: Addison-Wesley.
Anderson, C. B. (1993). Political correctness on college campuses: Freedom of speech v. doing the politically correct thing. SMU Law Review, 46(1), 171-224.
Bertrand, M., & Mullainathan, S. (2004). Are Emily and Greg more employable than Lakisha and Jamal? A field experiment on labor market discrimination. American Economic Review, 94(4), 991-1013. doi:10.1257/0002828042002561
Bettleheim, B., & Janowitz, M. (1964). Social change and prejudice. New York, NY: Free Press of Glencoe.
Brambilla, M., Carnaghi, A., & Ravenna, M. (2011). Status and cooperation shape lesbian stereotypes: Testing predictions from the stereotype content model. Social Psychology, 42(2), 101-110. doi:10.1027/1864-9335/a000054
Brief, A. P., Dietz, J., Cohen, R. R., Pugh, S. D., & Vaslow, J. B. (2000). Just doing business: Modern racism and obedience to authority as explanations for employment
discrimination. Organizational Behavior and Human Decision Processes, 81(1), 72-97. doi:10.1006/obhd.1999.2867
Caprariello, P. A., Cuddy, A. J. C., & Fiske, S. T. (2009). Social structure shapes cultural stereotypes and emotions: A causal test of the stereotype content model. Group Process Intergroup Relations, 12(2), 1-12. doi:10.1177/1368430208101053
Carver, C. S., Glass, D. C., & Katz, I. (1978). Favorable evaluations of Blacks and the
handicapped: Positive prejudice, unconscious denial, or social desirability? Journal of Applied Social Psychology, 8(2), 97-106. doi:10.1111/j.1559-1816.1978.tb00768.x Chaiken, S. (1980). Heuristic versus systematic information processing and the use of source
versus messages cues in persuasion. Journal of Personality and Social Psychology, 39(5), 752-766. doi:10.1037/0022-3514.39.5.752
Chaiken, S. (1987). The heuristic model of persuasion. In M. P. Zanna, J. M. Olson, & C. P. Herman (Eds.), Social influence: The Ontario symposium (pp. 3-39). Hillsdale, NJ: Erlbaum
Chaiken, S., Liberman, A., & Eagly, A. H. (1989). Heuristic and systematic information processing within and beyond the persuasion context. In J. S. Uleman, & J. A. Bargh (Eds.), Unintended thought (pp. 212-252). New York, NY: Guilford Press
Cohen, G. L. (2003). Party over policy: The dominating impact of group influence on political beliefs. Journal of Personality and Social Psychology, 85(5), 808-822. doi:10.1037/0022-3514.85.5.808
Cole, M. S., Rubin, R. S., Feild, H. S., & Giles, W. F. (2007). Recruiters’ perceptions and use of applicant résumé information: Screening the recent graduate. Applied Psychology: An International Review, 56(2), 319-343. doi:10.1111/j.1464-0597.2007.00288.x
Collange, J., Fiske, S. T., & Sanitioso, R. (2009). Maintaining a positive self-image by stereotyping others: Self-threat and the stereotype content model. Social Cognition, 27(1), 138-149. doi:10.1521/soco.2009.27.1.138
Crowne, D. P., & Marlowe, D. (1960). A new scale of social desirability independent of psychopathology. Journal of Consulting Psychology, 24(4), 349-354.
Cuddy, A. J. C., Fiske, S. T., & Glick, P. (2007). The BIAS map: Behaviors from intergroup affect and stereotypes. Journal of Personality and Social Psychology, 92(4), 631-648. doi:10.1037/0022-3514.92.4.631
Cuddy, A. J. C., Fiske, S. T., Kwan, V. S. Y., Glick, P., Demoulin, S., Leyens, J.P., . . . Ziegler, R. (2009). Stereotype content model across cultures: Towards universal similarities and some differences. British Journal of Social Psychology, 48, 1-33.
doi:10.1348/014466608X314935
Deaux, K., Winton, W., Crowley, M., & Lewis, L. L. (1985). Level of categorization and content of gender stereotypes. Social Cognition, 3(2), 145-167. doi:10.1521/soco.1985.3.2.145 Derous, E., & Decoster, J. (2017). Implicit age cues in résumés: Subtle effects on hiring
discrimination. Frontiers in Psychology, 8, 1-15. doi:10.3389/fpsyg.2017.01321 Derous, E., & Ryan, A. M. (2018). When your resume is (not) turning you down: Modelling
ethnic bias in resume screening. Human Resource Management Journal, 29, 113-130. doi:10.1111/1748-8583.12217
Devine, P. G. (1989). Stereotypes and prejudice: Their automatic and controlled components. Journal of Personality and Social Psychology, 56, 5-18. doi:10.1037/0022-3514.56.1.5
Dipboye, R. L., Fontenelle, G. A., & Garner, K. (1984). Effects of previewing the application on interview process and outcomes. Journal of Applied Psychology, 69(1), 118-128.
doi:10.1037/0021-9010.69.1.118
Durante, F., Volpato, C., & Fiske, S. T. (2010). Using the stereotype content model to examine group decisions in Fascism: An archival approach. European Journal of Social
Psychology, 40(3), 1-26. doi:10.1002/ejsp.637
Eckes, T. (1994). Features of men, features of women: Assessing stereotypic beliefs about gender subtypes. British Journal of Social Psychology, 33(1), 107-123.
doi:10.1111/j.2044-8309.1994.tb01013.x
Emmons, R. A. (1987). Narcissism: Theory and measurement. Journal of Personality and Social Psychology, 52(1), 11-17. doi:10.1037//0022-3514.52.1.11
Faria, C. M., & Spievak E. R. (2018, April). Axes of stereotyping: Bridgewater State University student perceptions of outgroups. Student Arts Research Symposium. Poster presented at Bridgewater State University, Bridgewater, M.A.
Fiske, S. T. (2015). Intergroup biases: A focus on stereotype content. Current Opinion in Behavioral Sciences, 3, 45-50. doi:10.1016/j.cobeha.2015.01.010
Fiske, S. T. (2018). Stereotype content: Warmth and competence endure. Current Directions in Psychological Science, 27(2), 67-73. doi:10.1177/0963721417738825
Fiske, S. T., Cuddy, A. J. C., Glick, P., & Xu, J. (2002). A model of (often mixed) stereotype content: Competence and warmth respectively follow from perceived status and competition. Journal of Personality and Social Psychology, 82(6), 878-902. doi:10.1037//0022-3514.82.6.878
Fiske, S. T., & Neuberg, S. L. (1990). A continuum of impression formation, from category-based to individuating processes: Influences of information and motivation on attention and interpretation. Advances in Experimental Social Psychology, 23, 1-74.
doi:10.1016/S0065-2601(08)60317-2
Gaertner, S. L., & Dovidio, J. F. (1986). The aversive form of racism. In J. F. Dovidio, & S. L. Gaertner (Eds.), Prejudice, discrimination, and racism (pp. 61-89). Orlando, FL: Academic Press
Gaertner, S. L., & McLaughlin, J. P. (1983). Racial stereotypes: Associations and ascriptions of positive and negative characteristics. Social Psychology Quarterly, 46, 23-30.
doi:10.2307/3033657
Goodwin, M., & Chemerinsky, E. (2019). The transgender military ban: Preservation of discrimination through transformation. Northwestern University Law Review, 114(3), 751-805.
Harber, K. D. (1998). Feedback to minorities: Evidence of a positive bias. Journal of Personality and Social Psychology, 74(3), 622-628. doi:10.1037/0022-3514.74.3.622
Inwood, J. (2018). White supremacy, white counter-revolutionary politics, and the rise of Donald Trump. Environment and Planning C: Politics and Space, 0, 1-18.
doi:10.1177/2399654418789949
Jost, J. T., Glaser, J., Kruglanski, A. W., & Sulloway, F. J. (2003). Political conservatism as motivated social cognition. Psychological Bulletin, 129(3), 339-375. doi:10.1037/0033-2909.129.3.339