Eye-Tracking to Model and Adapt to User Meta-cognition
in Intelligent Learning Environments
Christina Merten and Cristina Conati
Department of Computer Science, University of British Columbia 2366 Main Mall, Vancouver, BC, V6Z2T4, Canada
01-604-8224632 {merten,conati}@cs.ubc.ca
ABSTRACT
In this paper we describe research on using eye-tracking data for on-line assessment of user meta-cognitive behavior during the interaction with an intelligent learning environment. We describe the probabilistic user model that processes this information, and its formal evaluation. We show that adding eye-tracker information significantly improves the model accuracy on assessing user exploration and self-explanation behaviors.
Categories and Subject Descriptors
I.2.1 [Artificial Intelligence]: Applications and Expert Systems I.2.3 [Artificial Intelligence]: Deduction and Theorem Proving –
uncertainty and probabilistic reasoning;
K.3.1 [Computers and Education]: Computer Uses in Education – computer-managed instruction (CMI).
General Terms
Human Factors, Experimentation.
Keywords
Intelligent assistance for complex tasks, adaptive interfaces, user modeling, eye-tracking, meta-cognitive skills, intelligent learning environments
1.
INTRODUCTION
One of the functionalities that an Intelligent User Interface may include is providing user tailored support for complex tasks. This involves building a model of user traits relevant to adequately tailor the interaction, i.e., a user model. Depending on the nature of the task and the extent of the support, the relevant user traits may include simple performance measures (such as frequencies of interface actions), domain-dependent cognitive traits (such as knowledge and goals), meta-cognitive processes that cut across tasks and domains, and affective states. Arguably, the higher the level of the traits to be captured, the more difficult it is to assess them unobtrusively from simple interaction events. This has generated a stream of research on using innovative sensing devices to enrich the information available to a user model. This paper contributes to this research stream by presenting results on using real time eye-tracking information to inform a user model designed to assess student meta-cognitive behavior during interaction with an Intelligent Learning Environment (ILE). The meta-cognitive behaviors covered by the model include the capability to effectively learn from free exploration [7, 17] and the capability to self-explain instructional material, i.e., to clarify and elaborate the given information in light of the
underlying domain theory (e.g., [4] and [15]). Both meta-cognitive skills have been shown to improve the quality of student learning, but it has also been shown that many students lack them [4, 15].
As a consequence, there have been several efforts in the literature to support the acquisition of these skills in ILE. However, few of these efforts have tried to generate support tailored to student meta-cognitive needs. For effective exploration, most work has focused on providing interface tools that stimulate the right exploratory behaviors [13, 17]. For self-explanation, research has focused either on generating untailored prompts [1], or on relying on simple performance measures for tailoring, such as prompting for self-explanation after every new action or after every incorrect action [12]. One of the reasons for this is the difficulty of assessing user meta-cognitive behaviors. Conati and Vanlehn [6] have proposed a system that models user self-explanation behavior using interface artifacts that allows the system to obtain relevant information on user attention. However, it is not always possible to devise interface artifacts that do not interfere with the nature of the interaction. For this reason, we are exploring the use of eye-tracking data to provide information on user meta-cognition.
In this paper, we will discuss how we included eye-tracking information in a previously developed student model to track student self-explanation and exploration behavior [3]. The student model is to be used by ACE, an ILE to support student exploration-based learning in the domain of mathematical functions. The main contribution of this work is a formal evaluation of this student model, showing that the inclusion of eye-tracking information significantly improves the model assessment of student self-explanation, as compared to the previous model. The evaluation also shows that more accurate assessment of student self-explanation behavior significantly improves the assessment of student learning through exploration. There is a well established body of research on using eye-tracking data for off-line evaluation of interface design [11], or as an alternative form of input to allow a user to explicitly operate an interface [11, 16]. However, research on real-time usage of this type of data to enable on-line adaptation of the interaction is still in its infancy. Some of this work uses gaze tracking to help assess user task performance, such as reading performance for automatic reading remediation [18], or what task a user is performing independently from the underlying application (e.g., reading email vs. reading a web page) [10]. Others have explored using gaze data to assess user mental states such as interest in various elements of an interactive story [19], attention in the context of assessing learner motivation during interaction with an ILE [14] and student problem-solving strategies in a tutoring system for
algebra [9]. We contribute to this body of research by demonstrating how eye-tracking can improve recognition of user meta-cognitive skills.
In the rest of the paper, we first describe the ACE learning environment. We then briefly illustrate previous versions of the ACE student model and their limitations. Next, we describe the new model and the evaluation we ran to test its effectiveness compared to the previous versions. We also discuss sensitivity of the model to accurate onset information and different types of available evidence.
2.
THE ACE LEARNING ENVIRONMENT
ACE is an adaptive learning environment for the domain of mathematical functions designed to support student learning through exploration. ACE’s activities are divided into units and exercises. Units are collections of exercises whose material is presented with a common theme and mode of interaction. Exercises within units differ in function type and equation. Figure 1 shows the main interaction window for the Plot Unit. We will focus on this unit throughout the paper because it is the most relevant to the research presented in later sections. In the Plot Unit, a learner can explore the relationship between a function’s graph and equation by moving the graph in the Cartesian plane and observing how that affects the equation (displayed below the graph area). The student can also change the equation parameters and see how these affect the graph.
To support the
exploration process,
ACE includes a
coaching component that provides tailored hints when ACE’s
student model
predicts that students
have difficulty
exploring effectively. For more details on ACE’s interface and coaching component see [2]. In the next section we describe the general structure of ACE’s student model.
3.
PREVIOUS VERSIONS OF ACE’S
STUDENT MODEL
3.1
Version with no self explanation
ACE’s student model uses a Dynamic Bayesian Network [3] to manage the uncertainty in assessing students’ exploratory behavior. The main cause of this uncertainty is that the reasoning processes that influence the effectiveness of student exploration are not easily observable unless students are required to make them explicit. However, forcing students to articulate this reasoning would likely be intrusive and clash with the unrestricted nature of this type of learning.
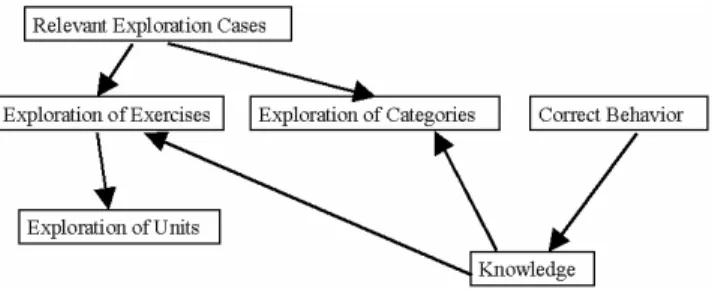
The first version of ACE’s student model was derived from an iterative design process [2] that yielded a better understanding of what defines effective exploration. Figure 2 shows a high-level description of this model’s structure, which comprises several types of nodes to assess exploratory behaviour at different levels of granularity. These include Relevant Exploration Cases,
representing exploration of individual exploration cases in an exercise (e.g., changing the slope of a line to 3, a positive number, in the Plot Unit); Exploration of Exercises and Exploration of
Units representing adequate exploration for the various ACE
exercises and units, respectively; Exploration of Categories, representing the exploration of groups of relevant exploration cases that appear across multiple exercises (e.g., all the exploration cases involving a positive slope in the Plot Unit). The links among the different types of exploration nodes represent how they interact to define effective exploration. Exploration nodes have binary values that represent the probability that the learner has sufficiently explored the items associated with the node.
Figure 2. High-level Structure of ACE's Student Model
ACE’s student model also includes binary nodes representing the probability that the learner understands the relevant pieces of knowledge (summarized by the node Knowledge in Figure 2). The links between knowledge and exploration nodes represent the fact that the degree of exploration needed to understand a concept depends on how much knowledge a learner already has. Knowledge nodes are updated only through actions for which there is a clear definition of correctness. These nodes are never updated within the Plot Unit since it consists of purely exploratory activities.
Initial studies on ACE generated encouraging evidence that the system based on the model in Figure 2 could help students learn better from exploration [2]. However, these studies also showed that sometimes the ACE student model – labeled model 1 from now on - overestimated students’ exploratory behaviour, because it considered interface actions to be sufficient evidence of good exploration, without taking into account whether a student was
self-explaining the outcome of these actions. For instance, a
student who quickly moves a function graph around the screen in the Plot Unit - but never reflects on how these movements change the function equation - performs many exploratory actions but can hardly learn from them because she is not reflecting on (self-explaining) their outcomes. We observed this behavior in several study participants.
3.2
Extending ACE to Track and Support
Self-Explanation
To address the model limitation described above, we started extending ACE’s interface and student model to track and support self-explanation. The original version of ACE only generated hints indicating that a student should further explore some elements of a given exercise. Augmenting ACE with the capability to track self-explanation allows ACE not only to detect when a student’s exploration is sub-optimal, but also to understand if the cause is a lack of self-explanation and generate tailored hints to correct this behavior.
There are two types of self-explanation that ACE needs to detect: (i) explicit self-explanation, i.e., self-explanation that the student generates using menu-based tools available in the interface; (ii) implicit self-explanation, that students generate in their head. The latter is the most difficult to detect due to the lack of hard evidence of its occurrence, and is the focus of the extensions to the student model we describe in the next sections.
e0 e0C a se1 tim e S tim u li to S E S E T e n d e n c y K n o w led g e C o a c h h in t to S E e0C a s e0 Im p lic it S E P o s itiv e In te rc e p t N e g a tiv e In te rc e p t P lo t U n it E x p lo ra tio n
Figure 3. Original ACE student model with self-explanation
The first version of the ACE student model with an assessment of self-explanation [3] – model 2 - only used time spent on each exploratory action as evidence of implicit self-explanation. Figure 3 shows a time slice in this model, corresponding to an implicit self-explanation action (similar slices capture the occurrence of explicit self-explanation). Nodes representing the assessment of self-explanation are shaded grey. In this figure, the learner is currently exploring exercise 0 (node e0) in the Plot Unit,
for which two relevant exploration cases (e0Case0 and e0Case1 in
Figure 3) are shown. Each exploration case influences one or more exploration categories (positive intercepts and negative intercepts in the figure). Here the learner performs an action corresponding to e0case1. In this new version of the model, the
probability that a learner’s action implies effective exploration of a given case depends on both the probability that the student self-explained the action and the probability that she knows the corresponding concept, as assessed by the set of knowledge nodes in the model (summarized in Figure 1 by the node Knowledge). Factors influencing the probability that implicit self-explanation occurs include the time spent exploring the case and the stimuli that the learner has to self-explain. Low time is always taken as negative evidence for implicit explanation. The probability of self-explanation with longer time on action depends on whether there is a stimulus to self-explain, i.e., on the learner’s general tendency
to self-explain and on whether the system generated an explicit
hint to self-explain
Time, however, can be an ambiguous predictor for self-explanation. First, it is hard to define for different learners what is insufficient time for self-explanation. Furthermore, a student may be completely distracted during a long interval between exploration cases. Thus, we chose to explore an additional source of evidence of self-explanation behavior, i.e., the student’s attention patterns during the exploration of a given case.
4.
ADDING EYE TRACKING TO ACE
The intuition for using an eye-tracker to assess self-explanation behaviour is that self-explanation may be more likely if the student actually attends to the parts on the interface showing the effects of a specific exploratory action. As an example, if a student has modified the function equation, a gaze shift pattern suggestive of self-explanation would start from the equation region and then hover around the graph region above.
To collect empirical data on the mapping between actual student self-explanations, time and attention patterns, we ran a user study [5], briefly summarized here because it lays the groundwork for the new model and evaluation methodology described in later sections. In this study, we collected data from 18 university students using ACE while their gaze was tracked by an Eyelink I eye-tracker, developed by SR Research Ltd., Canada. Each participant received instructions to try and verbalize all his/her thought processes while using the system. Finally they used the system for as much time as needed to go through all the units. All the student exploration cases were logged, and synchronized with the output of software we developed for the real-time detection of gaze-shifts analogous to the one described earlier. Complete video and audio data of the interaction was also collected; however the analysis described here focuses on the plot unit only. Using the audio and video data, two experts independently analyzed each participant’s exploratory actions for signs of the presence or absence of self-explanation. Only exploratory actions on which the coders fully agreed were used in the rest of the analysis, generating 149 data points.
We found a statistically significant difference between the average time taken for actions accompanied by self-explanation and actions that were not, indicating that time can be a predictor of self-explanation behavior. We then used ROC curve analysis [5] to determine the optimal threshold to indicate sufficient time for self-explanation, which we determined to be 16 seconds
Three predictors of self-explanation were considered and compared: (i) gaze shifts only, (ii) time only and (iii) gaze shifts and time used in combination. Gaze shifts proved to be the most reliable at detecting the absence of self-explanation. However, gaze shifts and time performed best together at identifying self-explanation when it occurred. Depending on whether priority is given to sensing the absence of self-explanation so that necessary intervention occurs or minimizing unwanted interruption, one of these predictors may be preferable to another. It should also be noted that an eye-tracker may not always be available due to cost and other considerations, so time may sometimes be the only predictor available.
Given these arguments, we felt that it is worthwhile adding eye-tracking information to the ACE model, and in such a way that allows for flexibility in deciding which predictor (or combination of predictors) to use. We then proceeded to change the ACE model based on the study data.
4.1
THE NEW ACE STUDENT MODEL
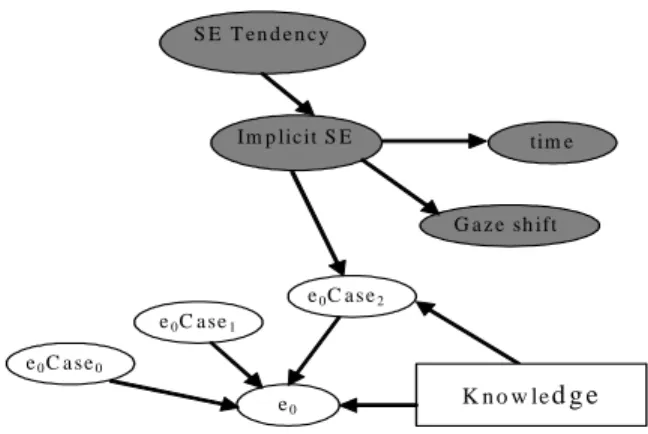
The shaded nodes in Figure 4 show the part of the ACE student model that we modified to include evidence from eye-tracking to assess implicit self-explanation. The gaze shift node has a binary value which indicates whether or not a gaze shift has occurred.
the threshold T identified from the study data has elapsed, indicating sufficient time for self-explanation.
e0 e0C a se1 tim e G a z e sh ift S E T e n d e n c y K n o w led g e e0C a se0 Im p lic it S E e0C a s e2
Figure 4. The ACE student model
As the figure shows, the revised model – model 3 - relies on a clear separation between the causes of implicit self-explanation and its effects, i.e., gaze shifts and time on action. These effects are encoded as independent predictors as in a naïve Bayesian classifier.
The main advantage to this approach is that it is highly modular, allowing the gaze shift and time nodes to be easily used or ignored as needed. Modularity also facilitates learning all the relevant conditional probabilities tables (CPTs) from data, while in the previous model the portion which tracks self-explanation was based on intuition and reasonable estimates of conditional probabilities. The disadvantage of this structure is that it assumes independence between time and the presence of gaze shifts, which is not necessarily true. In fact, our data actually suggests a small positive correlation between the two. However, similar assumptions in pure naïve Bayesian classifiers have been shown to perform surprisingly well in practice, even when this independence cannot be guaranteed. The CPTs for time and gaze shift were derived directly from frequencies in our dataset, as shown in Table 1
Table 1: CPTs for time and gaze shift in the new model implicitSE P(time < 16s) implicitSE P(gaze shift)
Y 0.71 Y 0.61
N 0.32 N 0.24
To determine the relationship between tendency to self-explain and implicit self-explanation, the study participants were divided into self-explainers – those who self-explained at least 20% of the time - and non-self-explainers – those who did not. We found that self-explainers and non-self-explainers self-explained 79.8% and 13.3% of the time, respectively. These frequencies were then used to set the conditional probabilities for the Implicit SE node. Note that the new version of the model in Figure 4 does not currently include the Coach’s hints to self-explain nodes. This is because no hints were provided during the user study, and thus we had no data to set the relevant conditional probabilities.
5.
TESTING THE NEW STUDENT MODEL
In this section the performance of the new model is evaluated using new user data. Subsection 5.1 describes the collection of
new data and the accuracy of the ACE student model over this data. Subsection 5.2 illustrates cross-validation analysis carried out to provide a more precise picture of the overall performance and stability of the model in assessing self-explanation and exploration of individual students. In subsection 5.4, the model is tested using different evidence of implicit self-explanation. For purposes of comparison, we also tested the two previous versions of the ACE model: the one which does not include self-explanation at all (labeled as model 1) and the one with time only (labeled as model 2). This allows an assessment of the incremental effects of adding self-explanation and then the gaze data to the ACE model. The new model will be labeled model 3 in the rest of the paper.
In order to gain more data for model testing we ran 18 more subjects with the same experimental setup and data analysis adopted for the first study. As in the previous study, participants were university students who had not taken any college level math. This new set of subjects yielded 109 exploration cases with self-explanation and 68 without, which were then used to assess the performance of the three models.
In this set of accuracy tests, the knowledge and tendency to SE nodes in each model were assigned a generic prior probability of 0.5. Thus the models began with an identical assessment of the knowledge and tendency for each student.
5.1
Accuracy of Implicit SE assessment
To test model accuracy in assessing implicit self-explanation, we needed a threshold probability to decide when an implicitSE node predicts the occurrence of self-explanation. This was derived from data from the previous study as follows. Using a simulated student program, the log files from the first study (training data) were run through each of the two models that do assess implicit self-explanation, e.g., model 2 and model 3. The probabilities of
implicitSE nodes were then compared against the coded data
points from the first study. Each data point corresponds to a user action which the experts determined was or was not self-explained. The implicitSE node in each model (see Figures 3 and 4) also yielded probabilities that self-explanation occurred at the time of this action. These probabilities were compared to expert assessments to test the predictive performance of each model. A small fragment of this data appears in Table 2 below.
Table 2 Values of implicitSE nodes corresponding to actions in study data action Experts SE assessment Model 2 (time only) Model 3 ( time and gaze shifts)
1 Y 0.698 0.723
2 N 0.287 0.180
3 Y 0.409 0.645
To determine a good threshold over implicit SE nodes for each model, a Receiver Operating Characteristic (ROC) curve was constructed for these implicitSE probabilities. A ROC curve is a standard technique used in machine learning to evaluate the extent to which an information filtering system can successfully distinguish between relevant data (episodes the filter correctly classifies as positive, or true positives) and noise (episodes the
filter incorrectly classifies as positive, or false positives), given a choice of different filtering thresholds.
Figure 5 shows the ROC curves for our two models, where the filter is the threshold over implicit SE probabilities. From these curves, we chose for each model the threshold that optimizes the tradeoff between true positive rate and false positive rate, as is standard practice in machine learning. These thresholds are marked by an asterisk in Figure 5.
Figure 5. ROC curves for models as predictors of implicit self-explanation over training data
Next, the user log files from the new study (test data) were run through each model. Using the thresholds found from the ROC curves over the training set, the model’s implicitSE nodes were tested for accuracy against the new set of coded data. Table 3 shows the true positive rate (i.e., percentage of self-explained cases correctly classified as such, or sensitivity of the predictor) and true negative rate (i.e., percentage of “no self-explanation” cases correctly classified as such, or specificity of the predictor) for the two models.
Table 3 Accuracies of implicitSE nodes Model 2 (time only)
Model 3 ( time and gaze shifts) True Positive rate
(sensitivity)
65.1% 71.6%
True Negative rate (specificity)
62.6% 74.3%
Combined 63.9% 73.0%
A combined measure, the average of the two accuracies, is also reported. Here the addition of the eye-tracker causes an increase in each of the measures, with the increase being more substantial for specificity. This is consistent with the assumption, supported by data in the first study, that the use of eye-tracking will catch many of the false positives inherent in the use of time as a predictor.
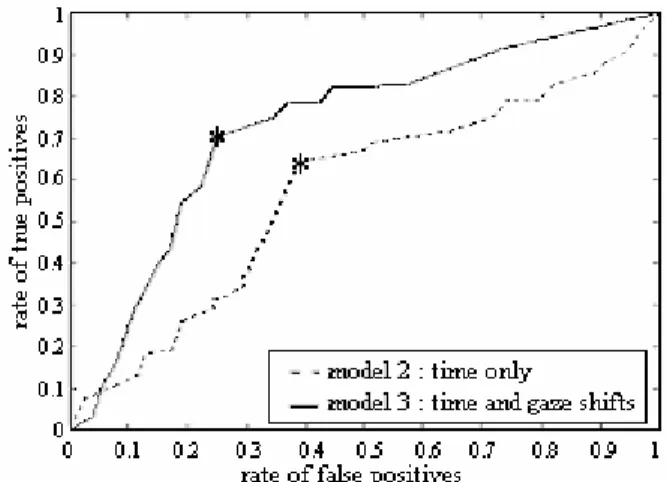
To further compare the accuracy of the two models, we generated the ROC curves of their performance as predictors of implicit SE over the new data set. These curves appear in Figure 6. The area under a ROC curve is equal to the probability that a randomly selected positive case will be given a higher probability by the model than a randomly selected negative case [8]. Thus ROC
curves with larger area correspond to better predictors over the data. As shown in Figure 6, model 3 yields a ROC curve with greater area than that of model 2. This difference in area is statistically significant to the z > 1.96 level [8].
Figure 6. ROC curves for models as predictors of implicit self-explanation over testing data
5.2
Accuracy of Exploration Assessment
Each of the 3 versions of the ACE model (including model 1, which does not assess self-explanation) was also evaluated as a predictor of adequate exploration. Data for this evaluation was collected as follows. In both user studies, participants completed a post-test on the mathematical concepts represented in the ACE model, immediately after interacting with ACE. A correspondence was then created between these concepts and specific post-test questions. These questions were then used to determine the student’s aptitude in each of the concepts (e.g., positive intercepts and negative intercepts) at the end of the experiment. In addition, when a student’s log file is run through any of the three models, the final probabilities of the exploration of categories nodes (e.g., nodes Negative Intercept ad Positive Intercept in Figure 3) represent the model assessment that the student understands these concepts at the end of the interaction. (i.e., that the student had adequately explored this material). This assessment can then be compared with the corresponding post-test scores to evaluate model accuracy over effective exploration.
.Table 4 Accuracies of exploration nodes
Model 1 (no SE)
Model (time only )
Model 3 (time and gaze
shifts ) True Positive rate (sensitivity) 62.7% 70.4% 73.9% True Negative rate (specificity) 55.2% 71.5% 76.3% Combined 59.0% 71.0% 75.1%
As before, a ROC curve was constructed for each model over the training data to determine the best threshold at which an exploration node could be found to indicate adequate exploration – and thus understanding – of the material. These thresholds were then used to determine the accuracy of each model over the
testing data, resulting in the accuracies in Table 4. Each of the accuracies increased with each successive model, suggesting that the addition of self-explanation and gaze shift data were in fact improvements. It also confirms that an increase in the accuracy of implicit self-explanation detection does in fact cause an increase in the accuracy of exploration assessment.
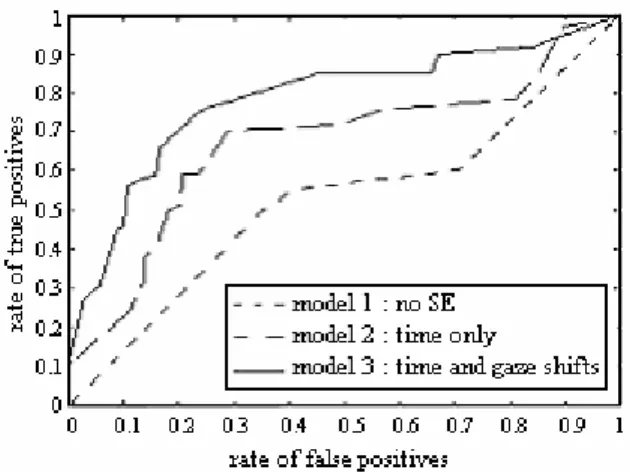
ROC curves were also generated to compare each model’s performance on exploration assessment over the test set. These appear in Figure 7. As shown in the figure, the area under the curve increased with the inclusion of self-explanation to the student model. The addition of gaze shift data also caused an increase. Both of these increases were found to be statistically significant at the z > 1.96 level [8].
It should, however, be noted that the increase in accuracy caused by the addition of the eye-tracker is higher for the implicitSE nodes than for the exploration nodes. This is due to the difference in the way each is measured. Each implicitSE probability is taken at the time that the associated action occurs while only the probabilities of the exploration nodes at the end of the interaction are used in the analysis. Thus, while the implicitSE nodes represent the state of the user at a specific time and are strongly affected by the presence or absence of a gaze shift, the exploration nodes’ final probabilities are the result of many actions throughout the interaction and are influenced by other factors. Given these results, we can conclude that the main benefit in adding eye-tracking versus using time only is the more accurate assessment of implicit self-explanation, which allows ACE to generate more precise real-time interventions during the student interaction with the system.
5.3
Cross-validation Analysis
We then conducted cross-validation analysis to get a better picture of how the various model versions perform on individual students. This also yielded results concerning the stability of each model. For each student model, leave-one-out cross-validation was performed using all 36 students from both studies. This involved isolating a student and then setting model thresholds and conditional probabilities using the data from all remaining students. This was done for each of the 36 students and the accuracy results from each student were averaged.
The mean combined accuracies and the standard deviations for the
implicitSE nodes for each model with generic prior probabilities
are given in the first row of Table 5. These values show improved performance with the addition of the eye-tracker as well as slightly higher stability. The performance difference is statistically significant at the 0.05 level (one-tailed t-test).
Figure 7. ROC curves for models as predictors of sufficient exploration over testing data
The first row of Table 6 shows analogous results for the exploration nodes. As before, there is an improvement in mean accuracy with each successive model. ANOVA analysis showed statistical significance in the differences within the set of mean accuracies and then one-tailed T-tests showed that the differences between each model are statistically significant.
The results reported so far are obtained by assigning a generic prior probability of 0.5 to knowledge and tendency to SE nodes for each test. We now discuss the influence of assigning student tailored priors on models performance.
Knowledge node priors were set based on each study participant’s performance on a pretest given before the interaction with ACE (the pretest is equivalent to the post-test discussed earlier). If the student answered the corresponding pretest items correctly, a prior probability of 0.85 was assigned to the corresponding knowledge node. Otherwise the probability was set to 0.15. Cross-validation was then performed again using customized prior probabilities for knowledge nodes. The mean accuracies for the implicitSE nodes appear in the second row of Table 5. While customizing these prior probabilities causes an increase in accuracy and stability for each model, this increase was only statistically significant for the
Table 5 Cross-validation results on implicitSE nodes for different models and prior probabilities Model 2 with
time only
Model 3 with time and gaze shifts Combined Accuracy 62.1% 71.6% Generic priors Std Dev 8.1% 7.9% Combined Accuracy 65.8% 75.2% Customized priors for knowledge nodes
Std Dev 7.4% 7.2%
Combined Accuracy
67.2% 76.4%
Customized priors for knowledge and SE Tendency nodes
Std Dev 7.6% 7.1.%
model which uses time and gaze shifts to detect self-explanation. Results with customized priors are also given for the exploration nodes in the second row of Table 6. Here the customization causes a statistically significant increase in the mean accuracy for each model as well as an increase in stability.
Priors for the tendency to SE node were derived from our previously discussed classification of study participants into
self-explainers – those who self-explained at least 20% of the time -
and non-self-explainers – those who did not. If a student was classified as a self-explainer, the prior probability for her tendency
to SE node was set to 0.85, while for a non-self-explainer, a value
of 0.15 was used (these values were arbitrarily picked after trying a few for both the high and low probabilities and realizing that the model was not sensitive to small changes over them). Repeating the cross-validation procedure using tailored priors for both knowledge and Tendency to SE nodes yielded the results given in the third rows of Tables 5 and 6. In each case, for each model, the improvement brought about by the customization of the Tendency
to SE node failed to achieve statistical significance, showing that
the model is not very sensitive to this parameter. This may be due to the fact that after many actions the tendency to SE probability can change significantly with user behavior so the effects of setting these prior probabilities can lessen over time. However, we believe it is still worth keeping this node in the model for two reasons. First, it provides ACE with an extra piece of information on potential causes of student poor exploration (i.e., low self-explanation tendency). Second, its influence may become more relevant in presence of the “coach hint to self-explain” node, which we plan to add as an additional cause of implicit self-explanation once we add data on the effect of these hints on student behavior.
In summary, we found that adding eye-tracking to the student model causes a statistically significant improvement in the assessment of both implicit self-explanation and sufficient exploration. It is also advantageous to use pretest results, if available, to customize the prior probabilities of the knowledge nodes. Tailoring the Tendency to SE prior probabilities, however, fails to bring about a significant improvement.
5.4
Performance with Different Evidence
This section illustrates how the new model’s (model 3) performance changes depending upon the type of evidence used (time alone, gaze shifts alone or both).
The log files of the new study participants were run through the new model two more times, one withholding eye-tracking data, the other withholding time data. For each run, accuracy of the model assessment over implicit self-explanation and exploration were computed as described earlier, yielding the results in Table 7. For purposes of comparison, the table also repeats the accuracies of the model that receives evidence from both time and gaze shifts. As shown in the table, information on time alone generates higher sensitivity than information on gaze shifts alone, while the latter generates higher specificity. These findings match those of the original user study [5]. They are also consistent with the assumption that time overestimates self-explanation behavior by assuming that the user spends all idle time considering the exploration. For each measure, the combined predictor outperforms either on its own.
Table 7. ImplicitSE accuracies for ACE model 3 using different predictors as evidence of implicit self-explanation
time evidence only Eye-tracking Evidence only
time and eye-tracking evidence True positive rate (sensitivity) 67.9% 62.3% 71.6% True negative rate (specificity) 64.8% 67.8% 74.3% Combined 66.3% 65.1% 73.0%
A similar analysis was performed to assess the influence of evidence type over exploration assessment, with results as reported in Table 8. As with the implicitSE nodes, information on time alone has a higher sensitivity than using only gaze shifts. However, gaze shifts alone achieve higher specificity. These predictors combine to yield the highest accuracy for each measure. This is due to the fact that accuracy improves with more evidence used. It should also be noted that each single predictor seems to succeed where the other fails so this complimentary behavior likely contributes to the high accuracy of the combined predictor.
Notably, the accuracies generated by the new model when only time information is used are comparable to (although slightly higher than) the accuracies of model 2, despite the differences in structure and method of CPT definition (data-based for model 3 and expert-based for model 2).
Table 6 Cross-validation results on exploration nodes for different models and prior probabilities Model 1
without SE
Model 2 with time only
Model 3 with time and gaze shifts Combined Accuracy 57.3% 65.3% 71.6% Generic priors Std Dev 11.6% 9.4% 8.7% Combined Accuracy 64.7% 69.9% 76.8% Customized priors for knowledge nodes
Std Dev 10.1% 9.3% 8.4%
Combined Accuracy
68.4% 70.4% 77.5%
Customized priors for knowledge and SE Tendency nodes
Std Dev 9.2% 10.3% 7.9%
Table 8. Model 3 accuracy with different evidence time evidence only Eye-tracking Evidence only
time and eye-tracking evidence True positive rate (sensitivity) 71.2% 69.8% 73.9% True negative rate (specificity) 72.9% 73.4% 76.3% Combined 72.1% 71.6% 75.1%
6.
CONCLUSIONS AND FUTURE WORK
In this paper, we have presented research on using real-time eye-tracking data for the on-line modeling of user meta-cognitive behaviors during interaction with an ILE. The goal is to enable the environment to provide adaptive support to improve these meta-cognitive behaviors and consequent student learning.
The main contribution of the paper is a formal evaluation showing that the model including eye-tracking information provides a more accurate assessment than a model using only time as a lower level predictor. The evaluation also shows that modeling the meta-cognitive skill of self-explanation improves the model performance on modeling student exploratory behavior, as opposed to only relying on student interface actions. This supports the argument that modeling high level user traits can improve the adaptive capability of an Intelligent User Interface, providing an initial justification for the effort involved in this type of high level user modeling.
Obviously, the final proof of the utility of rich user models must come from empirical evidence that adaptive intelligent interfaces based on these models improve user performance. The next step of our research is to provide this empirical evidence for ACE. We have designed a variety of interface tools that allow ACE to provide different levels of prompting for both exploration and self-explanation by relying on the assessment of the student model described here. We are in the process of designing a user study to test the effectiveness of these adaptive tools.
A longer term research step is to consider the inclusion in the model of other meta-cognitive skills involved in effective exploratory behaviors, including the capability to form hypothesis and to monitor one’s progress in the learning task.
7.
REFERENCES
1. Aleven, V. and K.R. Koedinger, An Effective Meta-cognitive
Strategy: Learning by Doing and Explaining with a Computer-Based Cognitive Tutor. Cognitive Science, 2002.
2(2): p. 147-179.
2. Bunt, A. and C. Conati, Probabilistic Student Modeling to
Improve Exploratory Behaviour. Journal of User Modeling
and User-Adapted Interaction, 2003. 13(3): p. 269-309.
3. Bunt, A., C. Conati, and K. Muldner, Scaffolding
Self-explanation to Improve Learning in Exploratory Learning
Environments. 7th Int. Conf. on Inteligent Tutoring Systems,
2004.
4. Chi, M.T.H., Constructing self-explanations and scaffolded
explanations in tutoring. Applied Cognitive Psychology,
1996. 10: p. S33-S49.
5. Conati, C., C. Merten, K. Muldner, and D. Ternes. Exploring
Eye Tracking to Increase Bandwidth in User Modeling. 10th
Int. Conf. on User Modeling. 2005. Edinburgh.
6. Conati, C. and K. VanLehn, Toward Computer-based
Support of Meta-cognitive Skills: A Computational Framework to Coach Self-Explanation. International Journal
of Artificial Intelligence in Education, 2000. 11.
7. de Jong, T. and R. van Joolingen, Scientific Discovery
Learning with Computer Simulations of Conceptual Domains. Review of Educational Research, 1998. 68.
8. Fogarty, J., R. Baker, and S. Hudson. Case Studies in the Use
of ROC Curve Analysis for Sensor-Based Estimates in Human-Computer Interaction. Graphics Interface. 2005.
9. Gluck, K.A. and J.R. Anderson, What Role do Cognitive
Architectures Play in Intelligent Tutoring Systems?, in
Cognition and Instruction: Twenty-five Years of Progress, D. Klahr and S.M. Carver, Editors. 2001: Erlbaum.
10. Iqbal, S.T. and B.P. Bailey, Using Eye Gaze Patterns to
Identify User Tasks. The Grace Hopper Celebration of
Women in Computing, 2004.
11. Jakob, R. The Use of Eye Movements in Human-Computer
Interaction Techniques: What You Look at is What You Get.
1998: Morgan Kaufmann Press: San Francisco.
12. Mitrovic, T., Supporting Self-Explanation in a Data
Normalization Tutor. Supplementary Proceedings of AIED2003, 2003.
13. Njoo, M. and T.d. Jong, Exploratory Learning with a
Computer Simulation for Control Theory: Learning Processes and Instructional Support. Journal of Research in
Science Teaching, 1993. 30(8): p. 821-844.
14. Qu, L. and L. Johnson. Detecting the Learner's Motivational
States in an Interactive Learning Environment. 12th
International Conference on Artificial Intelligence in Education. 2005. Amsterdam, The Netherlands.
15. Renkl, A., Learning Mathematics from Worked-Out
Examples: Analyzing and Fostering Self-Explanation.
European Journal of Psychology and Education, 1999. in press.
16. Salvucci, D. and J. Anderson. Intelligent Gaze-Added
Interfaces. SIGHCI Conference on Human Factors in
Computing Systems. 2000. The Hangue, The Netherlands. 17. Shute, V.J., A comparison of learning environments: All that
glitters..., in Computers as Cognitive Tools, S. Lajoie, P. and
S. Derry, Editors. 1993, Lawrence Erlbaum Associates: Hillsdale, NJ. p. 47-73.
18. Sibert, J.L., M. GokTurk, and R.A. Lavine. The Reading
Assistant: Eye Gaze Triggered Auditory Prompting for Reading Remediation. 13th Annual ACM Symposium on
User Interface Software and Technology. 2000. San Diego, California: ACM Press.
19. Starker, I. and R.A. Bolt, A Gaze-Responsive Self-Disclosing
![Figure 3. Original ACE student model with self-explanation The first version of the ACE student model with an assessment of self-explanation [3] – model 2 - only used time spent on each exploratory action as evidence of implicit self-ex](https://thumb-us.123doks.com/thumbv2/123dok_us/1834102.2765500/3.918.115.405.230.467/figure-original-explanation-assessment-explanation-exploratory-evidence-implicit.webp)