Advanced tomographic image
reconstruction algorithms for
Diffuse Optical Imaging
Alejandro Vidal-Rosas
Automatic Control and
Systems Engineering Department
University of Sheffield
A thesis submitted for the degree of
Philosophiae Doctor
Supervisor:
Prof. Daniel Coca
Dedicated to
To my wife Yessica and
my children Leonardo and Elizabeth, for all the happi-ness that you brought to this adventure.
To my parents: Elías Vidal
Castro and Gloria Rosas
Rosete, and to Ernesto,
Carmen, Gloria and
Al-berto, for all the advices that you gave me to growth in my
personal and professional
Acknowledgements
My gratitude to Professor Daniel Coca, I could not have finish this work without his advice and support during this adventure. Thank you Daniel.
I would like to thank to Doctor Tim Chico and Professor John Mayhew, for considering me in the projects that improved the contributions achieved in this thesis.
To all my dear friends: Pablo, Toñito, Mario, Ariel, Matei, Aldo, Carlos, Miriam, Pepe, Laura, Edgar "El Maza", Rafael "El Robbie", Mandy, Laura, Faedon, Guillermina, Steve, many thanks for all the funny moments, the laughs and the talks that we had. Also to my friends in Mexico: Karina, Melissa, Cinthia and Eder, thank you for your encouragement and your support.
And finally, I want to thank to Luis Alberto, Faby, Maria de la Paz, Lizbeth, Oscar, uncles Sergio and Juan, my aunt Malena and my great-aunt Elisa, she is over 100 years and she is still working hard every day.
Abstract
Diffuse Optical Imaging is relatively new set of imaging modality that use infrared and near infrared light to characterize the optical properties of biological tissue. The technology used is less expensive than other imaging modalities such as X-ray mammography, it is portable and can be used to monitor brain activation and cancer diagnosis, besides to aid to other imaging modalities and therapy treatments in the characterization of diseased tissue, i. e. X-ray, Magnetic Resonance Imaging and Radio Frequency Ablation.
Due the optical properties of biological tissue near-infrared light is highly scattered, as a consequence, a limited amount of light is propagated thus making the image reconstruction process very challenging. Typically, diffuse optical image reconstructions require from several minutes to hours to produce an accurate image from the interaction of the photons and the chormophores of the studied medium. To this day, this limitation is still under investigation and there are several approaches that are close to the real-time image reconstruction operation.
Diffuse Optical Imaging includes a variety of techniques such as functional Near-Infrared Spectroscopy (fNIRS), Diffuse Optical Tomography (DOT), Flu-orescence Diffuse Optical Tomography (FDOT) and Spatial Frequency Domain imaging (SFDI). These emerging image reconstruction modalities aim to become routine modalities for clinical applications. Each technique presents their own advantages and limitations, but they have been successfully used in clinical trials such as brain activation analysis and breast cancer diagnosis by mapping the response of the vascularity within the tissue through the use of models that relate the interaction between the tissue and the path followed by the photons.
to describe light propagation inside a medium and the latter is related to the reconstruction of the spatio-temporal distribution of the photons through the tissue. Iterative methods are used to solve both problems but the intrinsic complexity of photon transport in biological tissue makes the problem time-consuming and computationally expensive.
The aim of this research is to apply a fast-forward solver based on reduced order models to Fluorescence Diffuse Optical Tomography and Spatial Frequency Domain Imaging to contribute to these modalities in their application of clinical trials. Previous work showed the capabilities of the reduced order models for real-time reconstruction of the absorption parameters in the brain of mice. Results demonstrated insignificant loss of quantitative and qualitative accuracy and the reconstruction was performed in a fraction of the time normally required on this kind of studies.
The forward models proposed in this work, offer the capability to run three-dimensional image reconstructions in CPU-based computational systems in a fraction of the time required by image reconstructions methods that use meshes generated using the Finite Element Method. In the case of SFMI, the proposed approach is fused with the approach of the virtual sensor for CCD cameras to reduce the computational burden and to generate a three-dimensional map of the distribution of tissue optical properties.
In this work, the use case of FDOT focused on the thorax of a mouse model with tumors in the lungs as the medium under investigation. The mouse model was studied under two- and three- dimension conditions. The two-dimensional case is presented to explain the process of creating the Reduced-Order Models. In this case, there is not a significant improvement in the reconstruction considering
NIRFAST as the reference. The proposed approach reduced the reconstruction time to a quarter of the time required by NIRFAST, but the last one performed it in a couple of seconds. In contrast, the three-dimensional case exploited the capabilities of the Reduced-Order Models by reducing the time of the reconstruction from a couple of hours to several seconds, thus allowing a closer real-time reconstruction of the fluorescent properties of the interrogated medium.
In the case of Spatial Frequency Domain Imaging, the use case considered a three-dimensional section of a human head that is analysed using a CCD camera and a spatially modulated light source that illuminates the mentioned head section. Using the principle of the virtual sensor, different regions of the CCD camera are clustered and then Reduced Order Models are generated to perform the image reconstruction of the absorption distribution in a fraction of the time required by the algorithm implemented on NIRFAST.
The ultimate goal of this research is to contribute to the field of Diffuse Optical Imaging and propose an alternative solution to be used in the reconstruction process to those models already used in three-dimensional reconstructions of Fluorescence Diffuse Optical Tomography and Spatial Frequency Domain Imaging, thus offering the possibility to continuously monitor tissue obtaining results in a matter of seconds.
Contents
1 Introduction 1
1.1 Introduction to Diffuse Optical Imaging techniques . . . 2
1.2 Diffuse Optical Tomography . . . 5
1.3 Fluorescence Diffuse Optical Tomography . . . 6
1.4 Spatial Modulated Light Imaging . . . 7
1.5 Motivation . . . 7
1.6 Aims and contributions . . . 9
1.7 Organization and structure of the thesis . . . 11
1.8 Published articles and posters . . . 12
2 Diffuse Optical Imaging instrumentation 15 2.1 Introduction . . . 15
2.2 Types of Diffuse Optical Imaging Systems . . . 18
2.2.1 Continuous Wave systems . . . 18
2.2.2 Time-Domain systems . . . 20
2.2.3 Frequency-Domain systems . . . 23
2.2.4 Hybrid systems . . . 26
2.3 Diffuse Optical Imaging geometries . . . 27
2.3.1 Single-point measurements . . . 27
2.4 Conclusions . . . 33
3 Light transport models and image reconstruction 35 3.1 Introduction . . . 35
3.2 Formulation of the forward problem . . . 36
3.2.1 Modeling light propagation using stochastic methods . . . 37
3.2.2 Analytical methods for modeling light propagation . . . . 39
3.2.3 Describing light propagation using numerical methods . . . 40
3.3 Mathematical models of light transport in biological tissue . . . . 42
3.3.1 Radiative Transfer Equation . . . 43
3.3.2 Diffusion Approximation to the Radiative Transfer Equation 44 3.3.3 Boundary conditions . . . 45
3.3.4 Modelling sources and detectors . . . 47
3.3.5 Solution of the diffusion equation using the Finite Element Method . . . 48
3.4 Light transport model for Fluorescence Diffuse Optical Tomography 51 3.4.1 Simplified fluorescence transport model . . . 53
3.4.2 Finite Element Method formulation for FDOT . . . 54
3.5 Image reconstruction approaches . . . 56
3.5.1 Perturbation approach to the inverse problem . . . 57
3.5.2 Iterative image reconstruction . . . 59
3.5.3 Jacobian calculation . . . 63
3.6 Regularization methods anda priori information implementation 66 3.7 Image reconstruction in Fluorescence Diffuse Optical Tomography 69 3.8 Conclusions . . . 71
4.1 Introduction . . . 73 4.2 Procedure to estimate polynomial Reduced Order Models . . . 77 4.2.1 Estimation of Reduced Order Models numerical simulation 81 4.2.2 Formulation of Reduced-Order Models using a numerical
simulation example . . . 83 4.3 Effects of mesh density and model precision in the performance of
Reduced-Order Models . . . 89 4.4 Conclusions . . . 96
5 Fluorescence Diffuse Optical Tomography with Reduced Order
Models 99
5.1 Introduction . . . 99 5.2 Image reconstruction with fluorescent Reduced-Order Models . . . 101 5.2.1 Two-dimensional mouse thorax numerical model . . . 102 5.2.2 Fluorescence forward ROM formulation for a mouse thorax
model . . . 104 5.2.3 Image reconstruction evaluation for the 2D mouse thorax
model . . . 105 5.2.4 Noise effects on the reconstructions . . . 106 5.3 Three-dimensional image reconstruction in a mouse model . . . . 108 5.3.1 Three-dimensional mouse thorax model with three tumours 111 5.3.2 Image reconstruction of three static tumours in the lung of
the mouse model . . . 112 5.3.3 Image reconstruction of a time-varying fluorescent
concen-tration in the lung’s tumours of the mouse . . . 113 5.4 Conclusions . . . 115
6 Diffuse optical tomography using spatial frequency domain
imaging 119
6.1 Introduction . . . 119 6.2 Instrumentation . . . 122
6.4 Image reconstruction . . . 125
6.5 Reduced order models with spatial modulated light source . . . . 125
6.5.1 Human head simulation model . . . 126
6.5.2 Reduced Order Models formulation . . . 127
6.5.3 Image reconstruction for static optical parameters . . . 131
6.6 Conclusions . . . 135
List of Figures
2.1 Data acquisition for continuous wave instrumentation. . . 17
2.2 Data acquisition for continuous wave instrumentation. . . 18
2.3 Data acquisition for time domain instrumentation. . . 20
2.4 Data acquisition for frequency domain instrumentation. . . 24
2.5 Diagram of a single-point measurements set-up in a scattering medium that produce a probability density function (PDF) with a distinctive "banana-shape" profile. . . 27
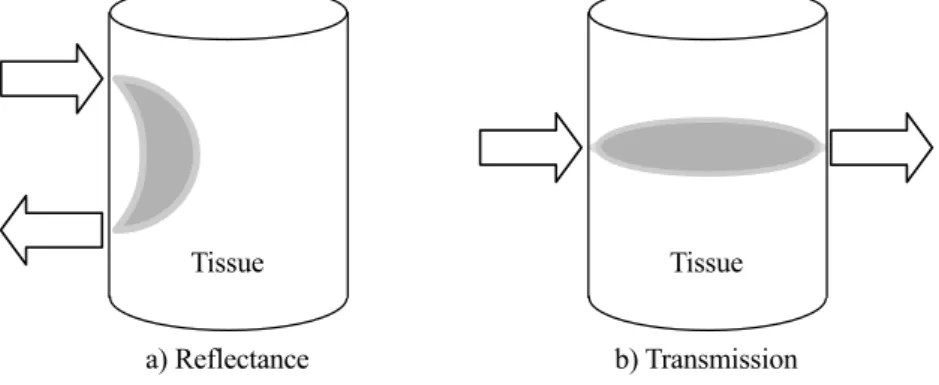
2.6 Single-point measurement: a) reflectance and b) transmission methods with their corresponding banana-shape structures. . . 28
2.7 Examples of source-detector arrays used for optical topography . . 30
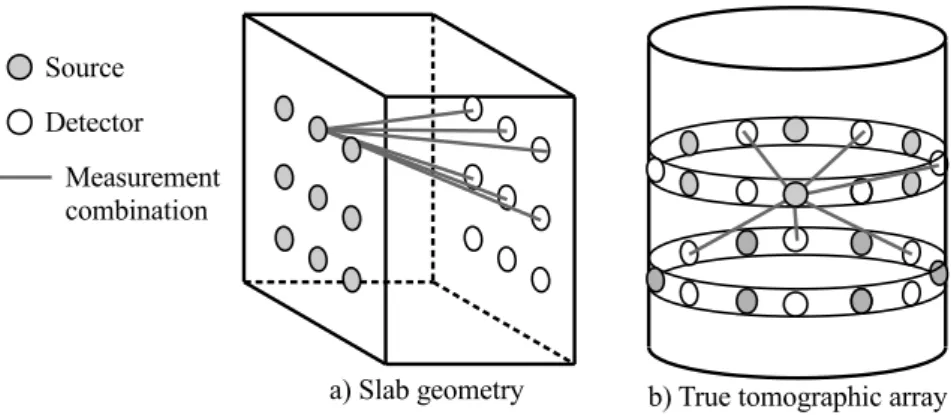
2.8 Tissue geometries used for tomographic studies of breast and brain tissues. . . 31
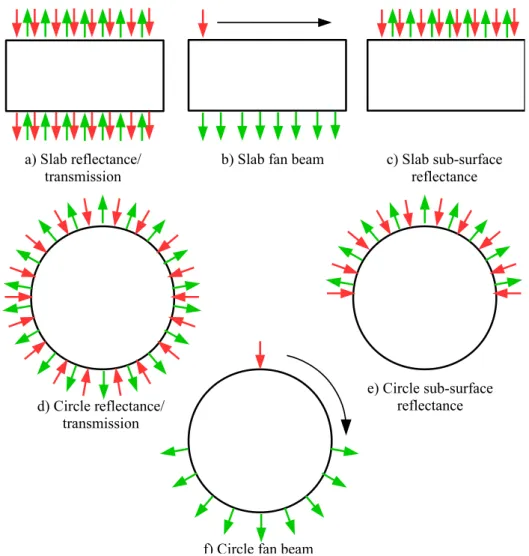
2.9 Schematic of the different source-detector configurations for the slab and the circle geometries. . . 32
3.1 Schematic of light propagation considering stochastic methods . . 37
3.2 Interaction between the light and a scattering medium. . . 42
3.3 Model Based Iterative Image Reconstruction scheme (MOBIIR) based based on perturbation methods. . . 60
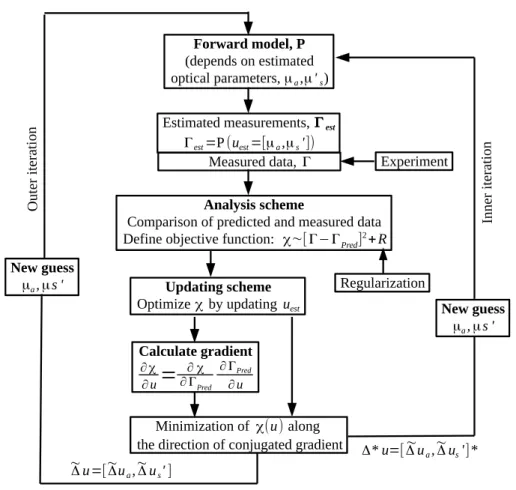
3.4 Model Based Iterative Image Reconstruction scheme (MOBIIR) based based on conjugated gradient methods. . . 63
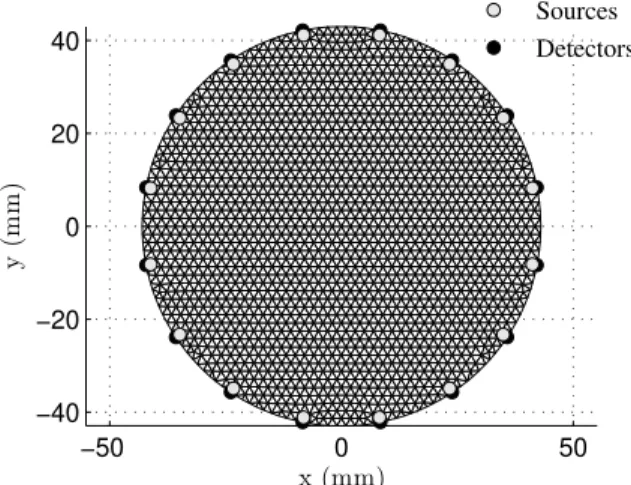
3.5 Circular geometry of 43mm radius with 16 sources and detectors. 66 3.6 Sensitivity of a homogeneous medium due to a) absorption and b) diffusion changes. . . 67
4.2 Iterative image reconstruction scheme based on Reduced Order Models (ROM). . . 77 4.3 Inverse and forward meshes used in the formulation of the reduced
order models approach in DOT . . . 84 4.4 Sample of uniform distributed random absorption coefficients. . . 84 4.5 Photon Measurement Density Function from a single
source-detector pair used for the estimation. . . 85 4.6 Reconstruction of the absorber inside the medium using a)
NIR-FAST and b) ROM approach. . . 87 4.7 Vertical profile of the image reconstruction using NIRFAST and
ROM approaches. . . 88 4.8 Different meshes and source-detectors combinations to analyse
ROM approach . . . 89 4.9 (a) Reconstruction of quasi-periodic signal, (b) ICC for each time
point. . . 92 4.10 Example of the reconstruction of an absorption using (a) NIRFAST
and (b) ROM approaches. (c) Vertical profile comparison from both reconstructions. . . 93 4.11 Comparison of the effect of the number of source-detector pairs
and mesh density on the ICC. . . 93 4.12 (a) FWHM in the direction of the x-axis, the values of FWHM in
the direction of the y-axis are very similar (Not shown). (b) Area under the curve (AUC). . . 94 4.13 (a) Overall ICC considering the time series as a whole. Similarly,
the absolute error is displayed in panel (b) . . . 95 4.14 (a) Time required to calculate the absorption changes due to a
quasi-periodic signal for each time point. (b) Improvement in the speed of the reconstruction for each time point. . . 96 5.1 Numerical model of a mouse thorax segmented in four regions . . 101 5.2 Mouse thorax absorption target used for the reconstruction . . . . 102 5.3 Data required for the image reconstruction and ROM generation:
a) inverse mesh with a priori structural information and b) the
Photon Measured Density Functio (PMDF) used to guide the system identification process. . . 103
5.4 Sample of the random absorption values used for ROM estimation. 104 5.5 Image reconstruction of the fluorescent concentration inside the
lungs. a) Using NIRFAST as reference and b) results from the
proposed ROM approach. . . 105
5.6 Vertical profile comparison of the reconstructions. . . 106
5.7 Results of reconstructions considering noise. . . 107
5.8 Inverse mesh and data required for generating ROM . . . 109
5.9 Target medium with anomalies and location of source-detector pairs110 5.10 Image reconstructions from a) NIRFAST three dimensional view, b) NIRFAST top view, c) ROM three dimensional view and d) ROM top view. . . 111
5.11 Noise effects on 3D reconstructions. . . 113
5.12 Dynamic image reconstruction of the fluorophore concentration from. a) Top tumour, b) middle tumour and c) bottom tumour. . 114
6.1 Schematic of a spatial frequency domain imaging system . . . 123
6.2 Human head section model: a) tissue regions considered in the numerical simulation and b) distribution of the absorption coefficient along the medium. . . 126
6.3 Light propagation with spatial frequency fx = 0.18and α = 2/3π. 127 6.4 Random absorption values used as inputs used to generate the polynomial models. . . 128
6.5 Example of the virtual sensor approach used for measuring the reflectance from the numerical model. . . 129
6.6 Three dimensional image reconstruction of the absorption value with initial guess close to the expected values. a) Using NIRFAST and b) with the ROM approach. . . 132
6.7 Vertical profile comparison between the target medium and the reconstructions from NIRFAST and ROM approaches with het-erogeneous initial guess. . . 133
6.8 Three dimensional image reconstruction of the absorption value with an homogeneous initial for the absorption value. a) Using NIRFAST and b) with the ROM approach. . . 134
6.9 Vertical profile comparison between the target medium and the reconstructions from NIRFAST and ROM approaches with homo-geneous absorption initial guess. . . 134
List of Tables
4.1 Parameters of the proposed forward model. . . 86
5.1 Optical properties for the mouse thorax model. . . 102
5.2 Optical properties for the 3D mouse thorax model. . . 108
6.1 Optical properties for the head model. . . 126
6.2 Parameters for one output of the forward reduced order models with spatial frequency modulated illumination. . . 130
Chapter 1
Introduction
The first medical imaging modalities to achieve great success were based on the use of X-rays. Techniques such as projection radiographs and fluoroscopy were extensively used before the advent of the digital computer that allowed the development of imaging modalities such as X-ray Computed Tomography (X-ray CT), Magnetic Resonance Imaging (MRI) and Ultrasound.
Magnetic Resonance Imaging (MRI) uses radio-frequency waves to reconstruct anatomic images based on the different susceptibility properties of tissue. Unlike X-ray imaging that uses dangerous ionizing radiation, MRI use non-ionizing radiation with the disadvantage that a scan can last up to 90 minutes and also patients with pacemakers or metal objects can not be examined. Ultrasound imaging uses high frequency sound waves to visualize internal body structures. Its instrumentation is compact, mobile, inexpensive and exhibits very low risks compared to X-ray that produces ionizing radiation and has the potential risk of harm healthy tissue [1, 2].
The use of light to interrogate tissue is an alternative to the aforementioned imaging modalities, either in the visible or near-infrared spectrum, with the current technology is possible to visualize the interaction of the photons with
biological tissue. Unlike X-rays, photons do not present a straight path in biological tissue and hence light distribution is modelled using sophisticated methods, such as Monte Carlo simulations [3, 4], the Radiative Transfer Equation (RTE) [5], the Diffusion Approximation (DA) [6, 7].
The models used to describe light propagation and the methods used to perform the reconstruction depend on the application,i.e. it is not recommended
to use the Diffusion Approximation in small samples or void-like mediums due to it is unable to predict light propagation on those mediums. In these cases, Monte-Carlo models and the Radiative Transfer Equation are recommended to be implemented, although the solution is expected to be complex and time-consuming. To solve the limitations imposed by each DOI reconstruction method, hybrid techniques have been proposed such as the radiative-diffusion models proposed by Tarvainen et. al., 2005 [8] and Renet. al., 2004 [9].
1.1
Introduction to Diffuse Optical Imaging
tech-niques
Over the last three decades, Diffuse Optical Imaging (DOI) techniques have emerged as a new medical imaging modality that provides a cheaper alternative to functional MRI, to aid in the diagnosis and detection of cancer, analyse wounds recovery and develop. It uses harmless Near-Infrared (NIR) light to analyse biological tissue [10, 11, 12]. With the time, Diffuse Optical Imaging techniques has been able to perform complex test such as breast cancer diagnosis and fetal brain activation using spectroscopy and Diffuse Optical Tomography [13]. Furthermore, with the aid of fluorescent markers and bioluminescence it has been possible to understand biological underlying processes from deep tissue [14].
1.1. Introduction to Diffuse Optical Imaging techniques
Near-infrared spectroscopy (NIRs) is an imaging technique that is sensitive to tissue function and composition. This technique is used to quantify blood composition, water and adipose content, and epithelial tissue [15]. In principle, NIRs has a poor spatial resolution because it recovers both superficial and internal information. By adding more measurement positions, it is possible to obtain topograms from the areas where the biological activity is occurring and obtain temporal and spatial images of them. This imaging technique is known as NIR topography [16] and it could be considered the base reference to more advanced optical imaging techniques.
Diffuse Optical Tomography (DOT) is an imaging method that enhances the capabilities of NIR topography by spatially quantifying the absorption and scattering optical properties of a medium. Typically, the absorption parameter is used to characterize physiological changes from a specific tissue volume, such as brain activity [17]. This due to the strong dependence of absorption to changes to blood oxygenation [18].
To improve DOT imaging capabilities it is possible to use external fluorescent markers in a technique known as fluorescence diffuse optical tomography (FDOT). In most cases, the fluorescent marker increase the absorption by concentrating it in areas with high vascularity, such as tumoral tissue. In other cases, the marker is excited and the fluorescent reaction is reconstructed such as the studies carried out by Sevick-Muraca&Burch, 1994 [19] and Chang,et. al., 1997 [20] that studied
the response of both absorption and re-emitted photons from a fluorescent marker injected into the tissue, furthermore providing mathematical descriptions of the absorption and the fluorescent response.
The advantages that optical imaging methods offer over other imaging modali-ties are: fast data acquisition, portability, compactness and very significantly, the
technology is non-invasive, which allows in vivo functional imaging of important biological processes such as muscle oxygenation and brain activation, several DOT techniques and applications were compiled in the review offered by Gibsonet. al.,
2005 [11, 21].
An insight of mathematical models used to successfully simulate light propagation and perform image reconstructions through the software package NIRFAST given by Dehghani, et. al., 2008 [22]; an alternative package to
NIRFAST is TOAST++ described in the paper of Schweiger&Arridge, 2014 [23]..Both packages consist of a set of libraries for Finite Element computation and different inverse solvers to perform image reconstructions.
The large set of available Diffuse Optical Imaging technologies and recon-structions techniques allow the visualization of light tissue interactions through the scattering, absorption and fluorescence from endogenous and exogenous tissue elements. These optical properties are used to reveal information of the structure, molecular function, physiology and biochemistry of tissue [24].
Is important to note that NIR light is highly scattered in biological tissue, as a result, light propagation does not follow a straight line from sources to detectors. Therefore, traditional back-projection algorithms, used in CT have limited application. Furthermore, the image reconstruction process is known to be non-linear and ill-posed; consequently, sophisticated reconstruction methods are required [25].
Several approaches have been proposed to model light transport in tissue, such as Monte Carlo simulations [26, 27], the radiative transfer equation (RTE) [28] or the diffusion approximation (DA) [29]. MC and RTE models are considered the most accurate methods to describe light propagation; however,
1.2. Diffuse Optical Tomography
they are computationally expensive and time-consuming being necessary the use of supercomputer to model light propagation and then perform the image reconstruction from [3, 8].
The diffusion approximation is less computationally demanding than RTE and MC simulations, and it is widely employed for biological tissue image reconstructions [30, 31]. The disadvantage of using DA is that it fails to accurately describe light propagation on small geometries, regions near to the sources and in the presence of void-like domains such as the Cerebrospinal Fluid (CSF) in the brain, or the synovial liquid in finger joints [5].
1.2
Diffuse Optical Tomography
Diffuse optical tomography is a biomedical imaging modality that reconstruct the intrinsic optical properties, such as absorption and scattering, from a highly scattering medium. Rather than using X-rays, magnetic fields or radio waves, DOT uses light to obtain 3D images of the optical properties from deep tissue [32, 29].
Due to the natural optical contrast between abnormal and normal tissue, DOT has a great potential in medical diagnosis areas, for example in oncology and neurophysiology [33, 34, 35]. With the new advances of computational capabilities and progresses made in sensing components, DOT applications have started to spread and to generate other sub-modalities such as High-Density DOT which considers a larger number of sources and detectors that not long ago was not even possible due to technological limitations [36].
As mentioned before, DOT applicability tends to be limited by the computa-tional capabilities that the user accounts for to perform the image reconstruction.
A trade-off between image quality, reconstruction accuracy, size resolution and time is necessary to define prior to start the reconstruction process. For this reason, research groups around the globe actively work in suitable ways to outcome the intrinsic limitations that DOT presents.
1.3
Fluorescence Diffuse Optical Tomography
The use of molecular probes to target biological events made it possible to quantify clinical images with high resolution and specificity [37], ranging from molecular level to whole tissue samples [38]. Moreover, fluorophore interactions with tissue allowed 3D image reconstructions over time, known as four-dimensional imaging [39].
Fluorescence Diffuse Optical Tomography (FDOT) has received particular attention due to the development of fluorescent dyes, enabling non-invasive studies of gene expression, protein interactions and cellular processes with microscopic and molecular resolution levels [40]. FDOT has been used in small animal experiments to monitor the progression of diseases and biological processes [10, 41, 42].
Fluorescence Diffuse Optical Tomography (FDOT) exploits the presence of fluorophores inside a medium. This allows depth biological tissue examination with an enhanced contrast compared to standard DOT [43]. It has been used in brain imaging studies [44, 45] and breast cancer studies [46, 47, 48].
Compared to DOT, the use of a fluorescent marker allowed to improve the signal-to-noise ratio of the background and the absorption parameters. Besides, it exploited other features given by the intrinsic properties of the exogenous markers allowing analyse specific biological interactions. But FDOT shares
1.4. Spatial Modulated Light Imaging
similar limitations with DOT related to the performance and time required for reconstructions.
1.4
Spatial Modulated Light Imaging
Spatial modulated light imaging or spatial frequency-domain imaging is a novel approach that can perform fast, wide-field non-invasive spectroscopy and DOT reconstructions. This approach uses spatial frequencies and angular shifts to improve the capabilities of continuous wave illumination sources [49, 50]. This technique offered the advantage to allow the generation of wide-view images due to the use of CCD cameras and wide sources of illumination.
Clinical applications of this imaging method involve tissue characterization to aid monitoring burn wounds [51], assessing vascular abnormalities [52] among other experiments carried out to characterize tissue considering topographic imaging. Planar imaging and look-up tables are normally used to describe depth tissue, with limited information about the precise location of the events investigated, although some attempts to perform 3D reconstruction have been carried out on small animals [53]. and tissue-like models known as "phantoms" [54] with results that demonstrated the clinical applicability of this novel imaging modality.
1.5
Motivation
Diffuse optical imaging techniques have the potential to aid in the detection and monitoring of vascular related diseases and oncology. In addition, optical imaging instrumentation is harmless, portable, easy to use and inexpensive. However, several limitations hinder their clinical application; such as the relatively low spatial resolution and the complex reconstruction process which
is computationally expensive and time-consuming.
The algorithmic approaches to accelerate computation have focused on the use of adaptive meshing schemes [55, 56, 57] and multigrid meshes [58, 59] have been proposed. But these approaches require careful design in the interface tissue regions, making it difficult their application. Alternatively, model reduction schemes have been employed to simplify the high-dimensional simulation models obtained after FEM discretization [60] by using B-splines [61] and wavelets to compress the stiffness matrix [62, 63].
To speed-up the reconstruction time, Vidal-Rosas [64, 65] developed a real-time 3D image reconstruction technique based on the reduced order models approach for Diffuse Optical Tomography. The proposed method generate numerical models based-on information gathered from the target medium. The models make use of signal processing and system identification techniques to create a reduced-order model that describe the light propagation into the tissue.
The reduced-order model generated is loaded into an iterative reconstruction technique, thus the application of reduced order models derived from data to solve the forward and inverse problems in DOT has been demonstrated and validated using both numerical and experimental studies involving complex 3D geometries. The results obtained were similar to those obtained using the standard approach that considers light propagation through a Finite Element Method (FEM) mesh, but in a fraction of the time.
Extending the reconstruction capabilities of the reduced order models method could benefit other optical imaging modalities, such as FDOT where the computational burden is even higher due to the light propagation model used in the image reconstruction process. In order to accurately resolve the fluorescent
1.6. Aims and contributions
properties of a fluorescent marker injected into depth tissue, it is important to first resolve the endogenous optical properties of the target medium. Neglecting these optical properties is possible, but further operations are required to prepare the signals prior to the reconstruction process adding more complexity to the problem.
In the same way, spatial frequency domain imaging (SFDI) require precise models to describe the path followed by the photons inside the tissue but being recorded by the pixels of a CCD camera, thus making it a complex task if we consider that each pixel of the camera is a sensing position. Models that could potentially describe this behaviour could be too complex to solve, thus limiting the applicability of SFDI for real-time three-dimensional reconstructions.
We aim to contribute to overcome the aforementioned limitations by the use of the reduced-order models approach in both optical imaging modalities FDOT and SFDI. The proposed approach is intended to be used in 3D application where the precise location of anomalies, either fluorescent or due to the absorption parameters, from depth tissue is a requirement. In the specific case of SFDI we generate the models considering a virtual sensor technique that is intended to further reduce the complexity without compromising the quality of the image.
1.6
Aims and contributions
The aim of this research project was to develop and apply advanced tomographic image reconstruction algorithms for diffuse optical imaging techniques that reduce the reconstruction time without compromising the quality of the image, the accuracy of the objects reconstructed and further enhance the applicability of this imaging modality.
The main contribution is the development of the reduced-order models (ROM) approach as an alternative light propagation model to typical iterative image reconstruction schemes based on the Finite Element Method that typically consider the mesh of the whole medium to perform the reconstruction. This approach maps directly the optical properties to the measured light which drastically reduces the reconstruction time.
Two diffuse optical imaging modalities were selected for the development of ROM approach: Fluorescence Diffuse Optical Tomography (FDOT) and Spatial Frequency Domain (SFD) imaging. These two imaging modalities are considered emerging techniques with enormous potential in the aid of neurological and oncology studies, as well as in the monitoring of post-surgical procedures and small animal research.
For the FDOT case, the proposed ROM approach is formulated to avoid the coupled diffusion equations used to describe the fluorescent light propagation through biological tissue which require the solution of the endogenous optical properties, thus reducing the reconstruction process by only focusing in the remitted light generated by the fluorescent marker.
To implement the Reduced-Order models approach into SFDI, it was also used the concept of virtual sensor in order to image reconstruct the optical properties of a 3-Dimensional medium using a CCD camera and a spatially modulated light source. The idea behind the virtual sensor considers that several camera pixels can be considered to form a single measuring point. Otherwise, each pixel on the CCD camera works as a measuring position, thus making it too complex to perform 3D reconstruction. The use of the virtual sensor avoids this difficulty, thus aiding another contribution to the present work.
1.7. Organization and structure of the thesis
In both cases, the main contributions are in the reduction of the time required for the 3D image reconstruction and that the simplicity of Reduced-Order models can be implemented directly over already existent image reconstruction packages such as NIRFAST.
1.7
Organization and structure of the thesis
The present chapter introduced the motivation and the importance of the research stated in the present work. The remaining chapters are organized as follows:
Chapter 2 depicts the literature review of diffuse optical imaging instrumenta-tion including frequency domain, time-domain and continuous wave. This chapter provides an overview of source-detector configurations available and generally used in optical imaging applications with their advantages and limitations.
Chapter 3 formulates the forward and inverse problems for Diffuse Optical Tomography (DOT) and Fluorescence Diffuse Optical Tomography (FDOT), summarizing the key mathematical models used on light propagation and the algorithms that perform optical image reconstructions. This chapter mainly focuses in the Diffusion Approximation (DA) to the Radiative Transfer Equation (RTE) due to the present work focuses on relatively large tissue volumes for the experiments.
Chapter 4 introduces the method to train a numerical model based on the Reduced-Order Models (ROM) approach for DOT applications using data gener-ated by numerical simulations. The trained model is a simplified representation of how the light propagated through the tissue. The estimated models are then used to perform the image reconstruction of the absorption parameter from an anomaly contained within a highly scattered medium.
Chapter 5 presents the extension of the ROM approach in the reconstruction of anomalies targeted with a fluorescent agent. The numerical model is trained to target the fluorescence from the marker contained within depth anomalies instead of the endogenous absorption parameters of the medium. It is demonstrated the imaging capabilities for reconstructing in a fraction of a time the anomalies embedded within a complex three-dimensional medium.
In Chapter 6 is presented the ROM reconstruction capabilities for the characterization of tissue using a spatial frequency modulated light source and the theory of virtual sensor when using a CCD camera instead of optical fibres. In this case, the numerical model is trained to consider several layers of tissue to further recover the optical properties from depth tissue volume. The target medium is the section of a human head consisting of skin, muscle, bone and then brain. In this case, the successful application of the ROM approach was achieved due to the use of the virtual sensor that further reduced the number of models to be trained.
Chapter 7 provides the conclusions for the thesis which summarizes the benefits that the proposed method has to offer within the Diffuse Optical Imaging field. Specifically its implementation within the NIRFAST package with application in Fluorescence Diffuse Optical Tomography and Spatial Frequency Domain Imaging.
1.8
Published articles and posters
Vidal-Rosas, A., Vidal-Rosas, E.E., Coca, D., Fluorescence image reconstruction of lung tumours in a mouse model, congress paper Innovation Match MX, 6-8 of April, 2016.
1.8. Published articles and posters
Vidal-Rosas, A., Vidal-Rosas, E.E., Coca, D., Fluorescence Diffuse Optical Tomography using Reduced Order Models. Poster for the ACSE symposium 16 of October, 2015.
Vidal-Rosas, A., Vidal-Rosas, E.E., Coca, D., Fluorescence Diffuse Optical Tomography using Reduced Order Models. Poster for the ACSE symposium 28 of November, 2014.
Vidal-Rosas, A., Vidal-Rosas, E.E., Coca, D. Real-time Fluorescence Diffuse Optical Tomography of brain haemodynamics. (In preparation, target journal: Journal of Biomedical Optics).
Chapter 2
Diffuse Optical Imaging instrumentation
2.1
Introduction
First clinical studies involving light transillumination were reported by Richard Bright in 1831 for hydrocephalus (build-up of fluid in the brain) and intra-ventricular haemorrhage studies. In 1843, Thomas B. Curling used the same transillumination principle and published a treatise of fluid in testis disease known as hydrocele [21].
Further transillumination studies were performed by Cutler in 1929 who observed breast lesions by projecting light from an electric lamp to the breast [66]. Although it was demonstrated the valuable aid light imaging could offer for clinical diagnosis, this technique was difficult to interpret and it caused overheating on the patient’s skin and was later abandoned [67].
Early in the 1970s, technological advances and the use of near-infrared illu-mination allowed the introduction of diaphanography (light scanning) for optical mammography studies [68]. Later in 1977, Jobsis published the paper that intro-duced near infrared spectroscopy to study brain oxygenation and haemodynamics [69], thus opening the road to the appearance of a variety of Diffuse Optical
Imaging techniques that ranged from the analysis to microscopic level to whole tissue examinations.
Several optical equipment started to be used for diagnosis and research applications during the 90s [70]. These offered non-invasive, easy examination and cost-effective instrumentation; however, technical limitations, poor resolution and the lack of physical models to describe and quantify light propagation, prevented these devices from reaching clinical practice. But those limitations didn’t stop the growing research community in attempting to take optical imaging equipment to clinical applications being mammography [71] and brain imaging [72] the main fields of interest.
Although clinical applications were severely limited, during this decade progresses made in both computational and near-infrared (NIR) technologies [73]. Improved light sources and detectors that enhanced the light generation and measurement process. In the same way, advanced computers gave to researchers the opportunity to implement more demanding algorithms [5, 31, 74].
Besides, researchers explored alternative solutions to simplify light propa-gation models by understanding the physics that govern the path followed by photons, as an example, Egger et. al., 2010 [75] proposed a set of coupled
diffusion equations to model fluorescence-tissue interaction that neglected the intrinsic fluorescence that a highly scattered medium presents, thus reducing the complexity of the light propagation model.
The above mentioned improvements on data collection, and the combination of computers with advanced mathematics and algorithms allowed great advances of Diffuse Optical Imaging (DOI) methods such as functional NIR spectroscopy (fNIRS) by enhancing the analyses wavelength to improve tissue
characteri-2.1. Introduction
zation [76], Diffuse Optical Tomography (DOT) allowing the study of more complex mediums [11] and Fluorescence Diffuse Optical Tomography (FDOT) by developing new fluorophores and instruments to precisely describe re-emission interactions [77, 78].
Figure 2.1: Data acquisition for continuous wave instrumentation.
In general, DOI instrumentation consists of an illumination source, a detection unit, an imaging platform, a hardware controller and a signal processor system, as shown in Fig. 2.1. It is widely accepted that the light source, the imaging platform and the detection unit are independent instruments [79]. The signal processor is a system with software capabilities for measurement filtering, calibration, light propagation modeling and image reconstruction algorithms. The hardware controller is either part of the computer or an independent specific instrument [80].
Other design consideration could be used to describe DOI instrumentation, but still the different modules described in Fig. 2.1 are potentially assumed to remain. For instance, if an external hardware controller or the signal processor are outside of the main computer, they still would require signals coming from the computer to match the operation required.
first class, referred as imaging domains, focuses on the type of illumination source and the corresponding detection method. The second class, defined as geometry measurements, considers the arrays of sources and detectors placed on a target medium regarding the illumination technology used [80].
2.2
Types of Diffuse Optical Imaging Systems
Depending on the type of sources and detectors used to produce intensity measurements and the type of processing applied to the information obtained, DOI instrumentation is classified in three domains: Continuous Wave (CW), Time Domain (TD) and Frequency Domain (FD) systems.
If a system is coupled with another medical imaging modality or is the result of the combination of two optical systems, the obtained instrumentation is called an hybrid optical system, which could offer several advantages but also is expected to increase the complexity and the costs of such implementation.
2.2.1
Continuous Wave systems
Continuous wave systems, or steady-state domain (SSD) systems, use a continu-ous light source to illuminate a target medium and then measure the transmitted or reflected light intensity. The detected light is attenuated by absorption and scattering events inside the medium. Figure (2.2) shows a schematic of the CW operation.
2.2. Types of Diffuse Optical Imaging Systems
CW instrumentation provides the highest data acquisition rate among DOI systems allowing real-time studies of haemodynamic changes in tissue with high temporal resolution [81]; it is widely used in clinical applications due to its simplicity in terms of its electronics, easier construction and the associated cost is lower, compared with the other two modalities [82, 83].
Limitations associated to CW measurement of intensities are [11]:
• Measurements are more sensitive for tissue immediately below the surface, making it difficult to reconstruct depth tissue, for example, brain image reconstructions are highly contaminated with skin systemic response and also affected by skull thickness and cerebrospinal fluid (CSF) [84, 85]. • Intensity measurements are affected by optode-tissue coupling effects from
the presence of hair, skin color variation, changes in position and pressure from the optode against the target medium [11], these two statements are also true for the Frequency Domain (FD) and Time Domain (TD), but due to the additional information it is possible to reduce these effects [86]. • Theoretical studies demonstrated that absorption and scattering
param-eters can’t be decoupled due to cross-talk effects [87], although Pei et.al.
[88] experimentally found that using a normalized-constraint algorithm and
a priori information it is possible to separate both coefficients using CW
measurements,
• One major limitation of CW instrumentation is the difficulty to perform fluorescence lifetime reconstruction [74], but several alternatives have been proposed such as the introduction of a normalization of the fluorescence with excitation measurements as suggested by Corlu et. al. [47].
Theoretical demonstration of the cross-talk effect showed that simultaneous reconstructions of absorption and scattering parameters were not possible using
only intensity information [87]. However, it was demonstrated by Peiet. al., 2001
[88] that this limitation could be overcome by the use of a normalized-constraint algorithm that used relative measurements based on the use of the normalized difference method [89]. The proposed method assumes that the anomalies are small anomalies close to the background values, thus limiting its application to larger anomalies. However, it offered several advantages when a single parameters is targeted, for example: the reconstruction is less sensitive to tissue-probe effects, minimize the impact of quality differences among measurements and inaccurate model considerations.
Despite the above mentioned limitations, CW systems became a powerful and widely used imaging modality, this due to computational advancements and improvements in the reconstruction algorithms such as the use of constrained solutions, incorporation of a priori information through regularization and normalization techniques [88]. Besides, its lower cost and reduced complexity allows the development of systems with numerous sources and detectors [90].
Figure 2.3: Data acquisition for time domain instrumentation.
2.2.2
Time-Domain systems
The temporal point spread function (TPSF) is the distribution of photons from a short duration pulse of light transmitted through a scattering medium [72]. Time-domain (TD) use pulsed light delivered to the medium in the order of picoseconds. After traveling deeper inside the tissue, the TPSF is broadened to
2.2. Types of Diffuse Optical Imaging Systems
a few nanoseconds before it is measured by the detectors as illustrated in Fig. 2.2.1 [10].
TD systems provide better depth sensitivity and a higher spatial resolution compared to CW systems, due to the capability of TD instrumentation to suppress early arriving photons allowing to exploit the late arriving photons with depth information, opposite to CW instrumentation that only measures the intensity of transmitted/reflected light [91].
By applying a Fourier transform, the TPSF can be converted into the frequency domain (FD), where the amplitude and the phase are the equivalent to intensity and photons time of flight. This conversion is useful in the implementation of simpler image reconstruction techniques due to data types and the FD diffusion equation [92]. However, FD platforms are limited by the number of modulation frequencies used, thus the full content of the time-domain system is not exploited. In consequence, by using the information of higher-order moments of the TPSF improve the quality over FD instruments [93].
Laser technology is frequently used in TD instrumentation because it gener-ates stable and narrow width pulses of light, but they are complex to implement and costly. More recently, the use of commercial high-performance LEDs have increased the interest and the applications of TD systems, due to the simplicity and low cost related to LED technology, compared with laser set-ups [80].
In both cases, the light is measured using a photon multiplier tube (PMT) or for more sensitive applications, multi-channel photon multiplier (MCH-PMT). PMTs/MCH-PMT provide high sensitivity, short rise time and excellent linearity, but also have a complex circuitry, bulky size and noticeable aging effects. Temperature control is required on applications that require PMT to reduce
"black noise" generated by the heat of the PMT and to increase the operation and life-time of the sensing elements.
An alternative to PMT is the avalanche photo-diode (APS), also known as solid-state PMT, which is mainly used in limited space and low power consumption applications, with a trade-off in the sensitivity obtained [80, 94]. Applications that require a high spatial resolution frequently make use of either an intensified coupled charge device (ICCD) or an electron-multiplication CCD (EMCCD) [94].
Time-domain applications that require a high spatial resolution frequently make use of either an intensified coupled charge device (ICCD) or an electron-multiplication CCD (EMCCD). Both ICCD and EMCCD basically consist of an amplification stage that intensifies the detected light that is later passed to a CCD camera which records the enhanced image [94].
First applications of TD systems were in the study of fluorescence reported by Hundley in 1967 [95]. Late in the 1980s, TD systems were used in spectroscopy to estimate concentrations of oxygenated haemoglobin (HbO2) and de-oxygenated haemoglobin (Hb) [96], also in the estimation of myoglobin by fitting the measured reflectance decay to the Beer-Lambert law [97]. An important contribution from TD systems was demonstrating that the diffusion equation accurate predicts light propagation in a scattering medium [98].
Time-domain systems clinical application include mammography and cancer studies [99, 71, 100], adult brain imaging [101, 102], study of functional infant brain activity [103], fluorescence DOT aiming to improve signal-to noise ratio by reconstructing the emitted time of flight of the fluorescent agent [104, 105, 106] and small animals research for the development of new TD hardware and
2.2. Types of Diffuse Optical Imaging Systems
algorithms [32]. These applications were related to the study of oxygenated and de-oxygenated blood, but other pilot experiments include the study of main tissue components such as lipid, bone and collagen [107].
The disadvantages related to TD systems are their elevated cost and complex implementation, compared with FD and CW domains [108]. In addition, TD measurements are noisier and exhibit chromatic aberration effects, which is a failure to focus all the light from the same point and is caused by the refractive index of the lens elements that varies with the wavelength. This effect results in further distortion of objects close to the boundaries [31], thus requiring extensive and careful calibrations to obtain accurate reconstructions [93].
Furthermore, PMTs require their own cooling and power supply system, making them cumbersome and increasing their cost. Another limitation is the low measurement speed due to the single-photon counting of photons that requires a large-area, low noise and efficient detectors. Thus limiting the number of clinical and real-time application [90].
2.2.3
Frequency-Domain systems
Frequency domain (FD) instrumentation is a variation of TD technology which acquires data using an amplitude modulated source, in the order of megahertz. Figure 2.4 shows the operation of FD instrumentation that exploits the effects produced by absorbers and scatterers in the amplitude and the phase from the transmitted light through a medium to obtain the optical property distribution.
Temporal resolution of FD reconstructions strongly depends on the frequency chosen, contrary to TD systems that achieve the highest resolution by considering all the available frequencies due to the photon counting capabilities of TD
instrumentation [109]. Whereas TD measurements can be equivalently expressed in the frequency domain, the latter has the advantage that sources and detector are less expensive [11].
Numerical models fitted using FD measurements have a better chance in determining global distributions of absorption and scattering than in a CW case. However, FD is less robust than CW due to its reduced signal-to-noise ratio (SNR) at high frequencies [110]. In the other hand, FD image reconstructions are more straightforward than TD, frequently requiring only one modulation frequency in the measurements for the image reconstruction [41].
Figure 2.4: Data acquisition for frequency domain instrumentation.
The development of FD instrumentation was possible due to the advances made on fluorescence spectrometers, known as fluorometers [111]. The progress of fluorometers towards tissue spectrometers came after the development of laser technology and techniques for signal processing, allowing the use of the Fast Fourier Transform (FFT) to analyses modulated measurements [112].
After the demonstration that the diffusion equation described light prop-agation in tissue accurately, analytical solutions in different geometries were obtained and optical properties were calculated by fitting the analytical solution to modulation and phase measurements from tissue-like models (phantoms) and in-vitro experiments [113, 114, 115].
2.2. Types of Diffuse Optical Imaging Systems
expensive lasers or arc lamps, LEDs offered a wide spectral distribution (from 500nm to 900nm), easy modulation, a stable output, safety (low optical power) and reduced cost [116]. A comparison in the performance of LEDs and lasers showed that both technologies produce similar results with small variations in their baseline and stability [117]. LED technology has revolutionized the way how light is generated and offer a low cost solution to DOI applications that can be rapidly constructed on lab conditions and further passed into a line production, different to laser technology that require certifications and permits that further limit is applicability.
Typically, a modulation frequency of 100 MHz is used in FD instruments, corresponding to the Fourier spectrum of time-domain measurements at one frequency. This operation limits the content information available in FD systems and reducing the quality of the image reconstruction. This limitation can be overcome by using several modulation frequencies, up to at least 1 GHz, which increase the information content of FD instrumentation and becoming comparable to TD systems [118].
Clinical applications of frequency-domain instrumentation include: planar and tomographic optical mammography that improve the visibility of vasculature and breast lesions [119, 120], functional brain imaging ranging from small animals to human adults [35, 121, 122] and fluorescence diffuse optical tomography where FD instrumentation aims to improve the image reconstruction resolution [56, 123, 124]. Frequency domain offer a trade-off between TD and CW instrumentation attracting researchers and commercial investors, but it is still required a high specialization to operate such equipment, also is expensive, compared with CW, thus FD systems are used as a reference more than a front-end application.
2.2.4
Hybrid systems
In order to enhance the capabilities of DOI instrumentation different groups created multi-modal or hybrid systems. These hybrid systems can make use of other imaging modalities such as MRI, X-ray, ultrasound or be a combination of the above DOI domains.
Examples of hybrid systems coupled to other imaging modalities are: fluorescent-ultrasound device used for prostate guided-biopsies [125, 126], fluorescent-MRI equipment developed for in vivo atherosclerosis studies, in vitro experiments
to characterize tissue and to perform small animals studies [127, 128, 129]. Fluorescence DOT has also presented some hybrid systems, as an example, the fluorescence-X-ray system proposed by Ale et. a. [130] used to target subcutaneous and lung tumors using high spatial sampling of photons over complete angle projections.
In contrast, examples of hybrid system which combine other domains are a frequency/continuous wave device used for three-dimensional breast imaging, such as the one proposed by Culver et. al. [131] that uses a CW system able to
operate as a frequency domain, thus adding the capabilities of FD or TD to the simplicity of a CW instrument [132]. Another examples is the FD-CW system proposed by Madsen et. al. that offered the capability to study the optical
properties of the uterus [133].
These hybrid systems, although more complex with respect to single optical imaging devices, offer the capability to experimentally exploit the physical limits that a single instrumentation or technique has to offer. The strongest use that the research community has with respect to these systems is when they are combined with other medical imaging modalities to obtain more information about tissue
2.3. Diffuse Optical Imaging geometries
under investigation in a single test, instead of performing separated studies that could change the expected results.
2.3
Diffuse Optical Imaging geometries
In this section, optical imaging is classified considering the source-detector measurement setup used to acquire data measurements referred as the imaging geometry. There are three main categories that can be used to generalize all the possible source-detector arrangements:
• point measurements, • Topographic mapping, • Tomographic imaging.
Figure 2.5: Diagram of a single-point measurements set-up in a scattering medium that produce a probability density function (PDF) with a distinctive "banana-shape" profile.
2.3.1
Single-point measurements
This is the simplest system design used to quantify changes in the underlying tissue and involves a single source-detector set-up. Because of the limited number of available measurements, this configuration can not determine the spatial distribution of optical parameters. Figure 2.5 presents a single source-detector pair and the sensitivity of intensity measurements to changes in the absorption coefficient of the medium.
The "banana-shape" structure presented in Fig. 2.5 is the result of changes in the states of photons that propagate through a scattering medium. The position and the likely outcome of these changes can be interpreted as a probability density function (PDF) for the light entering and exiting the medium [134].
Figure 2.6: Single-point measurement: a) reflectance and b) transmission methods with their corresponding banana-shape structures.
The banana profile strongly depends on the source-detector separation, the shape of the medium and the optical property coefficients. Increased absorption and scattering values, reduce both intensity measurements and penetration depth which affect the quality of a reconstructed image [109].
Single-point measurements are used in near-infrared spectroscopy (NIRS) for the estimation of oxy-haemoglobin and deoxy-haemoglobin concentrations in brain, limbs [17] and breast tissue characterization [15, 135]. In brain studies, the method is referred as functional near-infrared spectroscopy (fNIRS) because it is used for the functional monitoring of brain haemodynamics due to stimuli i.e., visual, motor or somatosensory stimulation [136].
Single point measurements are acquired either by reflection or transmission, as depicted in Fig. 2.6 [17], with a typical source-detector separation of 3cm that allows a light propagation within the tissue of approximately of 1.5cm, which is the half of the distance separation of the source and the detector [137].
2.3. Diffuse Optical Imaging geometries
In the case of fNIRS, it is recommended an inter-optode separation up to 4.5cm and no less than 2.5cm, this is because brain activity is about 2cm from the surface [136, 138]. Although shorter inter-optode distances have been reported for skin and subcutaneous studies [139].
2.3.2
Topographic mapping
By utilizing an array of multiple optodes in reflectance mode, the optical property distribution of the volume under this array can be mapped. This technique is known as optical topography (OT), or multichannel NIRS [140], because it projects the optical property distribution from multiple source-detector measurements, or channels, onto a two-dimensional (2D) plane.
OT offers a good temporal resolution due to the high data acquisition rate, also near-infrared light depth penetration is approximately the half of the source-detector distance separation [137]. Due to these capabilities, main clinical application are in the imaging of neonatal and adult brain activation [141, 140].
This technique has a low spatial resolution due to source-detector separation and the limited number of available channels [136]. To improve this limitation, different source-detector arrays have been proposed as shown in Fig. 2.7, which illustrates three source-detector configurations used for brain imaging.
Topographic measurements create better maps of optical properties in areas where activation is expected. The grid [142] and rectangular [137] arrays, shown in Fig. (2.7a) and Fig. (2.7b), respectively, have been used in the monitoring of visual, dorsal frontal and inferior frontal cortical areas. The circle arrangement in Fig. 2.7c was reported for imaging human cortex motor stimulation [143]. There exist other source-detector arrangements depending on the tissue under
investigation and the considerations that the research group takes into account for their experiments.
This technique is highly sensitive to optode-tissue coupling variations and requires the calibration of each individual detector. Additionally, problems arise depending on the acquisition protocol, i.e., serial acquisition (one source at a time, all detectors) can produce a spatially varying image and simultaneous acquisition (all sources on) requires information of each source contribution to each detected signal [109].
Figure 2.7: Examples of source-detector arrays used for optical topography [142, 143] .
2.3.3
Tomographic imaging
Tomographic techniques utilize source-detector arrays to measure the light that has traveled deep into a medium in order to obtain an image of the optical property distribution. Figure (2.8) presents two of the main tissue geometries used by research groups for producing tomographic images.
2.3. Diffuse Optical Imaging geometries
infinite half-space and is used for fast image reconstructions. Clinical applications using this geometry are breast diseased tissue characterization [144, 145, 146, 100], cardiovascular studies [147], functional brain imaging and tissue monitoring [148, 149, 84, 150].
Figure 2.8: Tissue geometries used for tomographic studies of breast and brain tissues.
True tomography, Fig. (2.8b), provides the best spatial resolution by the use of a dense array of probes and overlapping measurement combinations of the sample. However, they are experimentally complex requiring additional probe adjustments and quality assurance of the signals. Clinical applications include brain and breast imaging [151, 152, 153], finger joint studies and small animals research [154, 5, 39].
The accuracy of a tomographic reconstruction depends on the source-detector configuration used to acquire data measurements, despite of the selected geometry. For instance, slab geometries lack depth information from trans-illuminated photons, thus affecting the accuracy of the reconstructed image. Figure (2.9) illustrates the more common source-detector configurations used for both the slab and the tomographic geometries.
A comparison of the effects of these configurations and the quality of the reconstructions is presented in [155]. Systems that utilize all sources to illuminate
simultaneously the medium can acquire data in parallel allowing higher frame rates. However, attenuation effects for distances of 2.5 and 4.5 cm, also detectors require good dynamic range and low noise characteristics [35].
Figure 2.9: Schematic of the different source-detector configurations for the slab and the circle geometries. (a) Slab reflectance/transmission mimics x-ray mammography allowing the use of less sensitive and more stable detectors [131], but tissue characterization requires additional considerations due to lack of symmetry, (b) slab fan beam normally allows the use of CCD cameras which are highly stable and robust, thus providing image with a modest decrease of quality [72], (c) slab sub-surface reflectance is the simplest arrangement and allows the use of analytic reconstruction, but provides the lowest resolution [156], (d) circle reflectance/transmission provides the highest quality image reconstruction and is one of the most used configuration for tomographic imaging being used by several groups to imaging complex volumes [35, 39, 157, 158], (e) circle sub-surface reflectance which is simpler, robust and less expensive, it provides accurate images of tissue sections but has low resolution [82] and (f) circle fan beam is a simplified version of the full reflectance/transmission with a slightly decrease in image quality and has been normally used to experiments on small animals [154, 159, 160].
2.4. Conclusions
2.4
Conclusions
The range of diffuse optical imaging instrumentation currently available is a large array of imaging domains, geometries and source-detector configurations that have been successfully used in clinical applications for mammography, brain imaging, monitoring wounds recovery and also in the development of cancer treatments by studies carried out on small animals. Although several of these instruments are still under development, some DOI have reached commercial applications ranging from molecular to organ size studies.
Which system domain between CW, TD and FD is better, there is not a clear answer. CW systems are more affordable and easy to implement, but they lack the sensitivity and spatial resolution that FD and TD systems can provide. But due to the reduced complexity and lower cost that CW offers, this domain has been widely used and improved by using models that better describe light propagation or by being coupled with other imaging modalities. In contrast, TD instrumentation offers the richest information for tissue characterization, but is the more complex and expensive instrumentation to implement. In this sense, FD could be considered the trade-off between cost and information quality, but it is not as widely used as CW instrumentation. The selection of the correct DOI instrument depends on the application, with important consideration in the data type required, the target geometry, detection method, space constrains, reconstruction process, complexity construction and costs.
From the point of view of the author, Continuous Wave has the advantages over the other two modalities due to its simplicity and because the initial investment is not as high as the other two modalities, this modality allows to enthusiast researchers on the field of Diffuse Optical Imaging to have a real feel of
its potential applications. Besides, considering the progresses of the computers, optical devices and the capability to fuse CW with other modalities through software of hardware, improve the chances of further implementation among groups working with other imaging modalities or even research fields other than the clinical applications here mentioned.
Chapter 3
Light transport models and image
reconstruction
3.1
Introduction
The mathematical formulation for modeling light propagation is governed by spatial and time scales. The spatial scale goes from Maxwell equations at the microscopic scale, radiative transport equation in the mesoscopic level and the diffusion equation, that neglects the interference effects of wave propagation, at the macro-scale level [161].
To describe light absorption and scattering events in biological tissue is important to consider the main components that affect light propagation: chromophores such as haemoglobin, bilirubin, cytochrome and melanin pigments, porphyrins and exogenous chromophores such as photosensitive markers used for diagnostic and therapeutic trials [162, 163], resulting in that the tissue-light interaction is a complex that requires an correct application of multiple disciplines such as electronics, signal processing, data management, mathematical/statistical modeling and some knowledge of biomedical practices.
Another factor to consider for light propagation within tissue is the range of temporal responses that go from femto/picoseconds (normally studied by TD systems), through nanoseconds for diffuse photon waves (FD systems), to milliseconds (CW systems) that allow less demanding hardware and lower costs and also where most of the relevant physiological responses can be obtained [164].
This chapter provides an overview of the mathematical models used to describe light propagation through biological tissue. Theoretical and numerical methods used to solve the so called forward problem over two- and three-dimensional geometries are depicted. The chapter guides the reader to the main methods used to estimate light propagation and justifies the use of the Diffusion Equation which is solved using the Finite Element Method which is the base for the Reduced Order Models formulation.
3.2
Formulation of the forward problem
The forward problem involves the computation of the photon fluence function, Φ(r) ∈ Ω, over a domain of interest Ω and the corresponding measurements,
y(ξ) ∈ ∂Ω, on the boundary ∂Ω for a given distribution of optical parameters
u(r)and light sources s(ξ).
Considering S source positionssi ∈∂Ω (i= 1, ..., S)andD detector locations dj ∈ ∂Ω (j = 1, ..., D) that produce a total of yi,j measurements. Then, the forward problem is the relationship between the optical tissue properties and measurements for each source-detector configuration described by
~
y(i, j) =Pi,j(u(r)) (3.1) where P(·) :U →Y is the operator from the space of optical parametersU into the space of measurements Y [12]. A number of approaches have been used in the past to solve the forward problem given by equations Eq. (3.1) is described
![Figure 2.7: Examples of source-detector arrays used for optical topography [142, 143]](https://thumb-us.123doks.com/thumbv2/123dok_us/1869640.2772810/50.892.152.679.447.770/figure-examples-source-detector-arrays-used-optical-topography.webp)