Ameliorative missing value imputation for robust
biological knowledge inference
Muhammad Shoaib B. Sehgal
a,c, Iqbal Gondal
a,c,*, Laurence S. Dooley
a, Ross Coppel
b,c aFaculty of Information Technology, Monash University, Northways Road, Churchill, Vic. 3842, AustraliabDepartment of Microbiology, Monash University, Clayton, Vic. 3800, Australia c
Victorian Bioinformatics Consortium, Wellington Road, Clayton, Vic. 3800, Australia
Received 29 December 2006 Available online 31 December 2007
Abstract
Gene expression data is widely used in various post genomic analyses. The data is often probed using microarrays due to their ability to simultaneously measure the expressions of thousands of genes. The expression data, however, contains significant numbers of missing values, which can impact on subsequent biological analysis. To minimize the impact of these missing values, several imputation algo-rithms includingCollateral Missing Value Estimation(CMVE),Bayesian Principal Component Analysis(BPCA),Least Square Impute
(LSImpute),Local Least Square Impute(LLSImpute), andK-Nearest Neighbour(KNN) have been proposed. These algorithms, however, exploit either only the global or local correlation structure of the data, which normally can lead to higher estimation errors. This paper presents anAmeliorative Missing Value Imputation(AMVI) technique which has ability to exploit global/local and positive/negative cor-relations in a given dataset by automatic selection of the optimal number of predictor geneskusing a wrapper non-parametric method based on Monte Carlo simulations. The AMVI technique has CMVE strategy at its core because CMVE has demonstrated improved performance compared to both low variance methods like BPCA, LLSImpute, and high variance methods such as KNN and ZeroIm-pute, as CMVE exploits positive/negative correlations. The performance of AMVI is compared with CMVE, BPCA, LLSImZeroIm-pute, and KNN by randomly removing between 1% and 15% missing values in eight different ovarian, breast cancer and yeast datasets. Together with the standard NRMS error metric, theTrue Positive(TP) rate of the significant genes selection, biological significance of the selected genes and the statistical significance test results are presented to investigate the impact of missing values on subsequent biological anal-ysis. The enhanced performance of AMVI was demonstrated by its lower NRMS error, improved TP rate, bio significance of the selected genes and statistical significance test results, when compared with the aforementioned imputation methods across all the datasets. The results show that AMVI adapted to the latent correlation structure of the data and proved to be an effective and robust approach com-pared with the trial and error methodology for selectingk. The results confirmed that AMVI can be successfully applied to accurately impute missing values prior to any microarray data analysis.
Ó2007 Elsevier Inc. All rights reserved.
Keywords: Imputation; Microarrays; Gene expression data analysis; Missing value estimation; Non-negative least square; Optimization and significant gene selection
1. Introduction
Microarrays gene expression data are used in a wide range of biological applications from the study of human tumours[1,2]to yeast sporulation[3]because of their abil-ity to measure the gene expressions for many thousands of genes under a variety of conditions. This expression data are subsequently applied in a range of applications from diagnosis to drug discovery[4], all of which to some degree 1532-0464/$ - see front matterÓ2007 Elsevier Inc. All rights reserved.
doi:10.1016/j.jbi.2007.10.005 *
Corresponding author. Address: Faculty of Information Technology, Monash University, Northways Road, Churchill, Vic. 3842, Australia. Fax: +61 3 5122 6879.
E-mail addresses: [email protected] (M.S.B. Sehgal), [email protected] (I. Gondal), Laurence. [email protected](L.S. Dooley),[email protected].
edu.au (R. Coppel).
www.elsevier.com/locate/yjbin Journal of Biomedical Informatics 41 (2008) 499–514
involve analysis using stochastic, mathematical and machine learning methods [5–7] such as, class prediction [9,10], clustering[11], gene regulatory network reconstruc-tion [12], and data dimension reduction[8]. Despite wide usage, microarray data frequently contain at least 5% miss-ing values and in most datasets, at least 60% of genes have one or more missing values[13]. Once microarray images have been scanned, the problematic spots are identified as missing values with the reason for such occurrences include slide scratches, spotting problems, blemishes on the chip, hybridization error, image corruption or simply dust on the slide[14]. Sometimes for instance, a background color has a higher intensity than a foreground color due to bleed-ing from neighborbleed-ing spots, while background subtraction may also produce negative values which are subsequently marked as missing. It is important to highlight that the def-inition of missing values used in this paper is different from the present/absent flag in GeneChip data (Affymetrix soft-ware), which indicates whether or not genes are detectable at significant levels[15].
As previously alluded to, the missing values can seri-ously impact upon subsequent data analysis involving for example, significant class prediction, gene selection, gene regulatory network reconstruction[16]and clustering algo-rithms such as Support Vector Machines (SVM), Neural Networks (NN), t-test [17], and Hierarchical Clustering
[18,19]. Several approaches to impute missing values have been proposed with the simplest being either the repetition of the experiment, though this is often not feasible for eco-nomic reasons or ignoring samples containing missing val-ues, but again this is not recommended because there may only be a limited number of samples available. Other alter-natives include, row average/median impute (replacement by the corresponding row average/median) and zero impute (replace the missing values by zero) though these are high variance approaches as neither takes advantage of inherent data correlations, so leading to higher estima-tion errors[20]. A rational strategy is to accurately estimate the missing values, since if the latent correlations in the data are exploited then the missing value prediction errors will be significantly reduced [18,21,22]. This has been the catalyst for a myriad of imputation techniques including
Collateral Missing Value Imputation(CMVE)[23], K-Near-est Neighbor(KNN),Least Square Imputation(LSImpute) [22],Local LSImpute(LLSImpute)[10]andBayesian PCA
(BPCA) [14]. The resulting estimation errors can still be high, as certain algorithms chiefly focus only on global cor-relation (BPCA), while others exploit local corcor-relations in the data structure (KNN) by using a fixed number of pre-dictor genes. This provided the motivation for the develop-ment of new generic techniques that minimize prediction errors by optimizing the number of predictor genes. In addition, traditionally the comparative imputation perfor-mances of CMVE, BPCA, LSImpute, LLSImpute, and KNN have been evaluated using aNormalized Root Mean Square(NRMS) error measure, which does not fully eluci-date the impact of estimation on any subsequent analysis
like significant gene selection where a biological interpreta-tion of different genes for different diseases is mandated. So a more rigorous analysis of each gene affected by the miss-ing values is required.
This paper presentsAmeliorative Missing Value Imputa-tion(AMVI) algorithm that employs a combination of cor-related genes to estimate missing values by multiple imputation matrices. The basis of AMVI is the CMVE tech-nique that has proven both theoretically and empirically[23] to be a better estimator compared with established algo-rithms such as KNN, LLSImpute and BPCA. Like KNN, however, CMVE does not automatically determine the opti-mal number of predictor geneskfrom the dataset, which can lead to higher estimation errors. For data with a local corre-lation structure, if a largek-value is used then it may include genes which have no correlation with the gene that has miss-ing values. Similarly, if data has a global correlation struc-ture, then a small value of k ignores correlated genes in the prediction, again resulting in a higher estimation error, so it is highly desirable to calculate the best value ofkbased upon the underlying correlation structure of the data. LLSImpute automatically determinesk, though since this method is based on LS regression it provides coarser esti-mates and manifests in higher imputation errors. AMVI uses CMVE at its core and incorporates a wrapper non-parametric estimator based on Monte Carlo simulations [24] to automatically determine k, thereby combining the intrinsic benefits of CMVE with a strategy to automatically estimate the optimal number of predictor genes, as by LLSImpute. The reason to use this particular strategy to estimatekis explained in Section3.
The estimation performance of AMVI has been rigor-ously tested and compared with the aforementioned well-established and recently proposed, imputation techniques, namely CMVE, KNN, LLSImpute, and BPCA in predict-ing randomly introduced misspredict-ing values with probabilities ranging from 0.01 to 0.15 for eight different ovarian, breast cancer[3,25,26], and yeast saccharomyces cerevisiae data-sets[27]. In particular, the study compared the impact of estimation on significant gene selection usingBetween Sum of Squares to Within Sum of Squares(BSS/WSS) method, where AMVI demonstrated enhanced gene selection capa-bility for breast and ovarian cancer (Homo sapiens), and yeast (simple eukaryote) datasets. The biological analysis of the selected gene demonstrated that the AMVI selected many important expressed genes, which were ignored by the other imputation methods. In addition, the results were cross validated using non-parametric Wilcoxon Ranksum Significance test [28], where the results again, mandated the improved performance of AMVI. For completeness, results were also compared using the standard NRMS error [29] metric to quantitatively assess the estimation perfor-mance of each imputation method, with results once again demonstrated improved accuracy and robustness of AMVI over a wide range of missing values.
The remainder of the paper is organized as follows: Section 2 briefly reviews the main properties of existing
imputation techniques, while details of the new AMVI algo-rithm and its underlying theory are presented in Section3. A comprehensive discussion and analysis of the results, includ-ing their biological significance is presented in Section 4, with some conclusions are provided in Section5.
2. Review of existing imputation techniques
In describing various imputation techniques, the follow-ing nomenclature is adopted. Microarray gene expression matrix Y 2Rmn contains m genes and n samples. In Y,
every genei is represented bygi, so Yin nexperiments is arranged as Y ¼ ½g1. . .gmT 2Rmn. A missing value in geneifor samplejis expressed asYði;jÞ ¼giðjÞ ¼N.
The following paragraph provides a brief review of the main features of KNN, LLSImpute, BPCA and CMVE, which are the algorithms used in this paper to compare with the performance of AMVI.
KNN[20]estimates missing values by searching for the
knearest genes using the Euclidean distance function and then taking the weighted average. The method, however, does not consider negative correlations [21] and has the disadvantage of using a predetermined value ofkregardless of the dataset being used. Kim et al.[30]introducedLeast Square(LS) regression based algorithm called LLSImpute that automatically selects the number of estimator genesk
using an exhaustive search method. The method has shown to be having lower estimation error than other least square regression based estimation methods, such as LSImpute [30]. The BPCA [14] imputation technique uses Bayesian estimates and Principal Component Analysis to impute the missing values, though this technique only exploits glo-bal correlations within the data structure, which can lead to erroneous estimates if data possesses a strong local cor-relation [14]. The CMVE algorithm developed by Sehgal et al. [23] generates multiple estimation matrices using
Non-Negative Least Square(NNLS), Linear Programming
(LP) and LS regression techniques to approximate missing values. In spite of its enhanced estimation performance over other algorithms it still relies upon a preset parametric value ofk, which ultimately limits its applicability. While LLSImpute automatically determines k, it still has least square regression as its core resulting in higher estimation errors. This initiated a need for a suitable algorithm to automatically determine the best value ofk,directly from the correlation structure of the data while concomitantly providing low estimation errors. Next section presents the AMVI estimation technique, which combines both the enhanced estimation capability of CMVE with a new strategy for deriving the optimal value of k directly from the correlation structure of the data.
3. Non-parametric Ameliorative Missing Value Imputation (AMVI)
The AMVI algorithm, which is formally presented in Fig. 1, imputes missing values in three stages. Firstly, the
number of estimator geneskis computed using a wrapper non-parametric algorithm that exploits the correlation struc-ture of the data. Secondly, thekmost correlated genes with genegithat contains the missing value are selected for a given dataset, and finallygiis approximated using the CMVE ker-nel with NNLS, LP and LS regression at its core.
To select the number of estimator genesk,a set of vec-tors v from Y is selected using Monte Carlo Simulation with uniform distribution for the interval [m,n][24]where a statistical conservative value of selection probabil-ity = 0.05 is chosen [31] as v¼ ½v1. . .vn
T
2Rmn (Step 1, Fig. 1). This is followed by the selection of genesGwhich are present in v (Step 2), such as G¼ ½G1. . .Gn
T
2Rmn with these values ofGtreated as missing values and itera-tively estimated for a range of different kvalues (Step 3). Finally, the kvalue which produces the minimum NRMS error is designated as the optimal value (optk) and used in the actual estimation of missing valueYijof gene iand sample j, which involves three estimates U1, U2 and U3 being generated, and the final estimatevcomputed by their fusion using CMVE (Method Estimatein Fig. 1). To esti-mate the missing value, for any given data set, the absolute diagonal covarianceCis computed using(1)for a gene vec-torgi, which contains an actual missing value, where every gene except i is iteratively considered as a predictor gene (x) (Step 1.2 Estimate Method). The covariance function
Cis formally defined as: Cðgi;xÞ ¼ 1
ðn1Þ Xn
j¼1
ðgiðjÞ giÞðxjxÞ ð1Þ
Another option would have been to use Pearson Correla-tion, though the overall effect is exactly same for normally distributed data [32]. The genes are then ordered with re-spect to their covariance values and the first optk ranked covariategenesRoptkare selected, whose expression vectors have the closest similarity to gene ifrom Yin all samples except j (Step 1.4). The LS regression[33] is then applied to estimate valueU1) forYij(Step 1.5) as:
U1¼aþbRoptkþn ð2Þ
wherenis the error term that minimizes the variance in the LS model (parametersaandb). For a single regression, the estimate of a and b are, respectively, a¼gibRoptk and
b¼Ixy
Ixx where Ixy is the covariance between Roptk and gi computed using (1) and Ixx¼n11
Pn
j¼1ðRoptkðjÞRoptkÞ 2 is the variance ofRoptkwithRoptk ; wheregi being the
respec-tive means ofRoptkandgi, The two other missing value esti-matesU2 andU3 (Step 1.6) are, respectively, given by: U2¼ Xoptk i¼1 /þgX optk i¼1 n2 ð3Þ U3¼ Poptk i¼1ð/ T IÞ optk þg ð4Þ
whereuis the vector that minimizesn0in(5),gis the nor-mal residual and n is the actual residual. These three
parameters are obtained from the NNLS algorithm [33]. The objective is now to find a linear combination of models that best fitRoptkandgi. The objective function in NNLS minimizes the prediction errorn0using linear programming (LP) techniques, so that:
n;/;g¼minðn0Þ ð5Þ
minðn0Þis a function that locates the normal vectoruwith minimum prediction errorn0 and residual g. The value of n0in(5) is obtained from:
n0¼maxðSVðRoptk/giÞÞ ð6Þ
whereSVare the singular values of the difference vector be-tween the dot product ofRoptkand prediction coefficientsu with thegi. The tolerance used in the LP to compute vector uis given by:
Tol¼optknmaxðSVðRoptkÞÞ Nf ð7Þ
where optk is the number of predictor genes computed by the Non-parametric algorithm using Monte Carlo simulations, n the number of samples in the dataset and Fig. 1. The complete AMVI algorithm.
Nf is normalization factor. The final estimate v for Yij is formed by:
v¼qU1þDU2þKU3 ð8Þ
whereq¼D¼K¼0:33 ensures an equal weighting to the respective estimatesU1,U2andU3, which avoids bias being given towards one particular estimate as each is highly data dependent. The final fused valuevhas a lower NRMS error as the imputation matrix U1 uses LS regression, while matricesU2 andU3 useNon-NegativeLS (NNLS). 4. Analysis of results and discussion
4.1. Test data
To analyze and compare the performance of the pro-posed AMVI algorithm with CMVE, BPCA, LLSImpute, KNN, and ZeroImpute, eight microarray cancer and yeast datasets from different studies on breast, ovarian cancer tis-sues and yeast Saccharomyces cerevisiae were used. The rationale for selecting cancer datasets is that generally, can-cer data lack molecular homogeneity in tumour tissues, which can result in erroneous results when imputation methods are applied [15] while the choice of yeast data was made due to its wide usage by bioinformatics commu-nity. One of the possible reason of the wide usage of yeast data could be due its simplest genome in eukaryotic family (1.2107 base pairs) [34]. The locally correlated breast cancer dataset contained 7, 7, 8 samples of BRCA1, BRCA2, and sporadic mutations (neither BRCA1 nor BRCA2), respectively[26]. The globally correlated ovarian cancer dataset contained 16, 16, and 18 samples of BRCA1, BRCA2, sporadic mutations, respectively [25]. While the yeast data had six samples at different time stamps in each heat shock study. The heat shock response in yeast was measured at 30°C and 60°C. There were 3225, 6445, and 6130 genes in each sample of breast, ovarian and
yeast datasets, after the removal of gene expressions with more than 20% missing values.
4.2. Analysis of simulation results
This section provides rigorous analysis of empirical results, which includes validation of imputation strategies based on gene selection performance, biological signifi-cance of the selected genes, statistical signifisignifi-cance test and standard NRMS error.
4.2.1. Gene selection using BSS/WSS
To cross validate the performance of AMVI on gene selection BSS/WSS method was used.
The method identifies those genes which concomitantly have large inter-class variations and small intra-class vari-ations. For any geneiinY 2Rmn, BSS/WSS is calculated
as follows: BSSðiÞ=WSSðiÞ ¼ PT t¼1 PQ q¼1FðLt¼qÞðYqiYiÞ 2 PT t¼1 PQ q¼1FðLt¼qÞðYit YqiÞ2 ; ð9Þ
whereTis the training sample size,Qthe number of classes and F() is a Boolean function = 1 if the condition is TRUE and zero, otherwise.Yjdenotes the average
expres-sion level of geneiacross all samples andYqiis the average
expression level of gene i across all samples belonging to class q. Genes are then ranked by BSS/WSS ratios, from the highest to the lowest to form a significant gene expres-sion matrix #, where the firstp genes are selected for sub-sequent class prediction. To set a benchmark gene set a set of p genesGorg was selected from the original data Y using the BSS/WSS method.
To fully test the robustness of the AMVI algorithm, experiments were performed for missing values up to 15%, with values being iteratively removed from the origi-nal gene expression matrix Y. Missing values were then estimated using KNN, LLSImpute, BPCA, CMVE, and
True Positive Rate of Significant Genes in Breast Cancer Data
0 100 200 300 400 500 600 700 800 900 1000 1 5 10 15 % Missing Values T rue Positi v e Rate KNN LLSImpute BPCA CMVE AMVI 2 3 4
AMVI to form Yest, before respective sets of p genes Gs were selected using the BSS/WSS method for each esti-mated matrix. These selected genes were then compared withGorgto compute theTrue Positive(TP) rate.
Fig. 2plots the TP rate for first 1000 significant genes in breast cancer, from which it is clear that AMVI outper-formed all other comparative methods in terms of estima-tion quality. The localized correlaestima-tion structure of this dataset is confirmed by the generally lower TP rate for BPCA, which is characterized by exploiting only global correlation performed worse than a high variance method such as KNN. CMVE despite using a fixed number (k= 10) of predictor genes exhibited good performance as it exploited the underlying local correlation structure
of the data. Fig. 3 confirms the consistent performance improvement of AMVI in terms of TP rate for the ovarian cancer dataset, especially for higher numbers of missing values, compared to the other estimation methods, with interestingly BPCA due to its emphasis on global correla-tion of the data demonstrated lower error than KNN and CMVE. The impact of imputation on gene selection was evaluated by varying the number of significance genes where the results demonstrated similar performance trends. For example,Figs. 4 and 5show the accumulated TP rate for the first 50 genes selected for imputation by AMVI, CMVE, BPCA, LLSImpute, KNN, and ZeroImpute in seven specific cases, namely: 1%, 2%, 3%, 4%, 5%, 10%, and 15% missing values in both the breast and ovarian
can-True Positive Rate of Significant Genes in Ovarian Cancer Data
0 100 200 300 400 500 600 700 800 900 1000 1 5 10 15 % Missing Values
True Positive Rate
KNN LLS Impute BPCA CMVE AMVI 2 3 4
Fig. 3. True positive rate of genes selection in ovarian cancer.
Frequency Plot: TP Rate of Significant Genes in Breast Cancer Data
0 1 2 3 4 5 6 7 1 5 9 11 13 15 17 19 21 23 25 27 29 31 33 35 37 39 41 43 45 47 49 Gene ID
Gene Selection Frequenc
y KNN LLSImpute BPCA CMVE AMVI 3 7
cer datasets, with results again highlighting the improved performance of AMVI.
The experimental results on yeast data inFig. 6 demon-strate that AMVI showed higher TP rate than CMVE, LLSImpute and KNN. Interestingly, BPCA had lower error for higher percentage of missing values than AMVI, though it was not retained for the aforementioned ovarian and breast cancer data (Figs. 2 and 3). The AMVI, how-ever, inculcation consistently showed acceptable perfor-mance for the complete range of missing values in all the datasets which underpins that AMVI can be used to esti-mate missing values in gene expression data prior to any biological analysis.
As mentioned in Section1that it is important to study the selected genes therefore, the study was undertaken on
cancer data. For the purposes of clarity, the overall trend of gene selection is shown in Figs. 7 and 8, which both reveal that certain genes are more affected by missing val-ues and the subsequent impact of imputation than others, due to both the location of missing values and differing variances. For example, Gene ID 28 in Fig. 7 has a low TP rate being selected only 17 times out of 42 (40% selec-tion rate) by all imputaselec-tion techniques other than AMVI, which had a success rate for this particular gene of 100% (Fig. 4) compared to 57%, 57%, 28%, 0%, and 0% for CMVE, LLSImpute, BPCA, KNN and ZeroImpute, respectively (Fig. 4). Similarly, Gene 6 inFig. 8 has selec-tion rate of only 38% and yet was always correctly selected by AMVI (Fig. 5) due to its better estimation ability. The same gene had respective TP rates of 57%, 43%, 29%,
Frequency Plot: TP Rate of Significant Genes in Ovarian Cancer Data
0 1 2 3 4 5 6 7 1 11 13 15 17 19 21 23 25 27 29 31 33 35 37 39 41 43 45 47 49 Gene ID
Gene Selection Frequency
KNN LSImpute LLSImpute BPCA AMVI 3 5 7 9
Fig. 5. Accumulated TP rate of the first 50 significant genes for 1%, 2%, 3%, 4%, 5%, 10% and 15% missing values in the ovarian cancer dataset.
True Positive Rate of Significant Genes in Yeast Data
0 100 200 300 400 500 600 700 800 900 1000 1 5 10 15 % Missing Values
True Positive Rate
KNN LLSImpute BPCA CMVE AMVI 2 3 4
14% and 0% for LLSImpute, BPCA, LSImpute, CMVE and KNN (Fig. 5).
4.2.2. Biological significance of selected genes
In examining different datasets, AMVI identified a num-ber of genes overlooked by all the other algorithms [35], which alter expressions in tumor lines and so could be important in oncogenesis. This set of genes has not only been selected by BSS/WSS algorithm but has been revali-dated using the modified t-test with greedy pairs method [36]. The revalidation minimizes the bias of the gene selec-tion strategy towards either a particular imputaselec-tion tech-nique or a set of genes.
For example, as the results in Table 1 reveal, the KIAA1025 protein was not selected when values were imputed using KNN, LLSImpute, BPCA, CMVE and ZeroImpute, but had been identified when gene selection was preceded by AMVI imputation. This is an important protein which is co-regulated with estrogen receptors for
bothin vivoand clinical data, and is expressed in more than 66% of human breast tumors[37]. Another gene selected by AMVI across the range of missing values is plakophilin 2 (PKP2) which is a common protein and exhibits a dual role, appearing as both a constitutive karyoplasmic protein and a desmosomal plaque component for all the desmo-Frequency of Significant Genes Selection in Breast Cancer
0 5 10 15 20 25 30 1 5 9 11 13 15 17 19 21 23 25 27 29 31 33 35 37 39 41 43 45 47 49 Gene ID Frequency 3 7
Fig. 7. Frequency plot for the first 50 significant genes for 1–15% missing values in the breast cancer data.
Frequency of Significant Genes Selection in Ovarian Cancer
0 5 10 15 20 25 1 3 5 7 9 11 13 15 17 19 21 23 25 27 29 31 33 35 37 39 41 43 45 47 49 Gene ID Frequency
Fig. 8. Frequency plot for the first 50 significant genes for 1–15% missing values in the ovarian cancer data.
Table 1
KIAA1025 (KIAA) and Plakophilin2 (PKP2) selection in breast cancer dataset across the range of missing values
%MV AMVI CMVE LLSImpute BPCA KNN ZeroImpute
1 KIAA KIAA KIAA KIAA
PKP2 PKP2
5 KIAA KIAA KIAA KIAA
PKP2 PKP2
10 KIAA KIAA
PKP2 PKP2
15 KIAA KIAA
some-possessing tissues and cell culture lines. The gene is found in breast carcinoma cell lines[38] and furthermore, because of its significance it can serve as a marker for the identification and characterisation of carcinomas derived either from or corresponding, to simple or complex epithe-lia[39](seeTable 1).
Similar observations can be made in the study of signif-icant genes in the ovarian cancer dataset. For instance, MHC Class II = DQ alpha (MHCa) and MHC Class II = DQ beta (MHCb) genes are linked to the immune sys-tem and have been shown to be down-regulated for ovary syndrome[40]. Also, the allele gene is present at a higher frequency in patients with malignant melanoma than in Caucasian controls. These genes help in particular to diag-nose melanoma patients in the relatively advanced stages of the disease and/or patients who are more likely to have a recurrence [41]. The results reveal that these genes have been correctly identified by AMVI while being consistently missed by other imputation methods, especially for higher numbers of missing values (seeTable 2).
4.2.3. Significance test
This section provides the results of two-sidedWilcoxon Rank Sum Statistical Significancetest. The significance test was undertaken, to prove the validity of the estimation
accuracy achieved by different imputation methods, with statistically conservative significance level of 0.05 [28]. The rationale behind using this test was that it does not mandate the data to have equal variances, which is vital given the variances of data can be disturbed due to errone-ous estimation, especially in case of ZeroImpute. The null hypothesisH0YYest whereYandYestare the actual and estimated matrices, respectively, theP-value of the hypoth-esis is calculated as:
H0;P-value¼2PrðR>yrÞ ð10Þ
whereyris the sum of the ranks of observations forYand
Ris the corresponding random variable.
AMVI demonstrated best performance for all the three cases of breast cancer data (BRCA1, BRCA2 and spo-radic). It is noteworthy that the (1P) (the null hypothesis rejection probabilities) values are plotted inFigs. 9–11for the sake of clarity. Therefore, the higher (1P) value rep-resents more accurate estimation than lower (1P) values. The results were significant for higher percentage of miss-ing values where the comparative methods had higher error rate for large number of missing values. For instance, LLSImpute had varied performances for different range of missing values and could not maintain it for higher percentage of missing values (Figs. 9–11). Similarly,
Table 2
MHC Class II = DQ alpha (MHCa) and MHC Class II = DQ beta (MHCb) selection in ovarian cancer across the range of missing values
%MV AMVI CMVE LLSImpute BPCA KNN ZeroImpute
1 MHCa MHCa MHCa MHCa MHCa MHCa
MHCb 5 MHCa MHCb MHCb 10 MHCa MHCb 15 MHCa MHCb
Significance Test Results for BRCA1-Breast Cancer Data
0 0.1 0.2 0.3 0.4 0.5 0.6 0.7 0.8 0.9 1 1 3 5 10 15 % Misssing Values
P-Value of Similarity Between Actual
and Estimated Data
AMVI CMVE LLSImpute BPCA KNN ZeroImpute 2 4
Significance Test Results for BRCA2-Breast Cancer Data 0 0.1 0.2 0.3 0.4 0.5 0.6 0.7 0.8 0.9 1 1 3 5 10 % Misssing Values 15
P-Value of Similarity Between Actual
and Estimated Data
AMVI CMVE LLSImpute BPCA KNN ZeroImpute 2 4
Fig. 10. Significance of similarity between actual BRCA2-breast cancer and estimated data.
Significance Test Results for Sporadic-Breast Cancer Data
0 0.1 0.2 0.3 0.4 0.5 0.6 0.7 0.8 0.9 1 1 3 5 10 15 % Misssing Values
P-Value of Similarity Between Actual
and Estimated Data
AMVI CMVE LLSImpute BPCA KNN ZeroImpute 2 4
Fig. 11. Significance of similarity between actual sporadic-breast cancer and estimated data.
Significance Test Results for BRCA1-Ovarian Cancer Data
0 0.1 0.2 0.3 0.4 0.5 0.6 0.7 0.8 0.9 1 1 3 5 10 15 % Misssing Values
P-Value of Similarity Between Actual
and Estimated Data
AMVI CMVE LLSImpute BPCA KNN ZeroImpute 2 4
understandably the ZeroImpute method showed highest error rate, across the range of missing values, highlighting
the need of more accurate estimation methods than simple strategies. The similar performance improvement was
Significance Test Results for BRCA2-Ovarian Cancer Data
0 0.1 0.2 0.3 0.4 0.5 0.6 0.7 0.8 0.9 1 1 2 5 7 % Misssing Values
P-Value of Similarity Between Actual
and Estimated Data
AMVI CMVE LLSImpute BPCA KNN ZeroImpute 3 4 6
Fig. 13. Significance of similarity between actual BRCA2-ovarian cancer and estimated data.
Significance Test Results for Sporadic-Ovarian Cancer Data
0 0.1 0.2 0.3 0.4 0.5 0.6 0.7 0.8 0.9 1 1 2 5 7 % Misssing Values
P-Value of Similarity Between Actual
and Estimated Data
AMVI CMVE LLSImpute BPCA KNN ZeroImpute 3 4 6
Fig. 14. Significance of similarity between actual sporadic-ovarian cancer and estimated data.
Significance Test Results for Yeast Heat Shock 30 Data
0 0.1 0.2 0.3 0.4 0.5 0.6 0.7 0.8 0.9 1 1 3 5 10 15 % Misssing Values
P-Value of Similarity Between Actual
and Estimated Data
AMVI CMVE LLSImpute BPCA KNN ZeroImpute 2 4
observed when AMVI and comparative methods were applied to ovarian cancer data (Figs. 12–14).Figs. 15, 16 show the significance results of two yeast datasets. The AMVI method showed lower error than LLSImpute, KNN and ZeroImpute. As it was observed in case of gene selection BPCA performed better than AMVI for some percentage of missing values. BPCA, however, could not exhibit the same performance for all the other datasets. The AMVI technique demonstrated stable performance for all the datasets while again highlighting the need of fully exploiting the correlation structure of the data for estimation.
For the sake of completeness, the algorithms were also compared based on the standard NRMS error. The next section provides analysis of NRMS error in detail:
4.2.4. Calculation of normalized root mean square error
The missing value estimation techniques were also eval-uated by randomly removing between 1% and 15% values from the datasets and then computing the imputation error in terms of the NRMS errorH:
H¼RMSðY YestÞ
RMSðYÞ ð11Þ
whereYis the original data matrix andYestis the estimated matrix using AMVI, CMVE, BPCA, LLSImpute, and KNN, respectively. This particular measure has been used by Tuikkala et al.[13] and Sehgal et al. [23,29] for error estimation becauseH= 1 for zero imputation.
To compare the performance of CMVE, KNN, BPCA and LLSImpute with AMVI algorithm, k= 10 was used throughout the experiments. As Troyanskaya et al. [20]
Significance Test Results for Yeast Heat Shock 60 Data
0 0.1 0.2 0.3 0.4 0.5 0.6 0.7 0.8 0.9 1 1 3 5 10 15 % Misssing Values
P-Value of Similarity Between Actual
and Estimated Data
AMVI CMVE LLSImpute BPCA KNN ZeroImpute 2 4
Fig. 16. Significance test results of yeast heat shocked at 60°C.
AMVI CMVE BPCA LLSImpute KNN
0 0.1 0.2 0.3 0.4 0.5 0.6 0.7 0.8 0.9 1 NRMS Error Imputation Method NRMS Error for Breast Cancer Data
observed, KNN is insensitive to the values of k in the range 10–20 and the best estimation results are achieved in this interval. Similarly, we used k= 10 for CMVE due to the reason described in [23]. In contrast, LLSIm-pute determines the value ofk using correlation structure of the data, while AMVI automatically determines the
optimal value ofoptkusing wrapper non-parametric algo-rithm (see Fig. 1), which exploits the underlying correla-tion structure of the data due to the reasons underlined in Section 1.
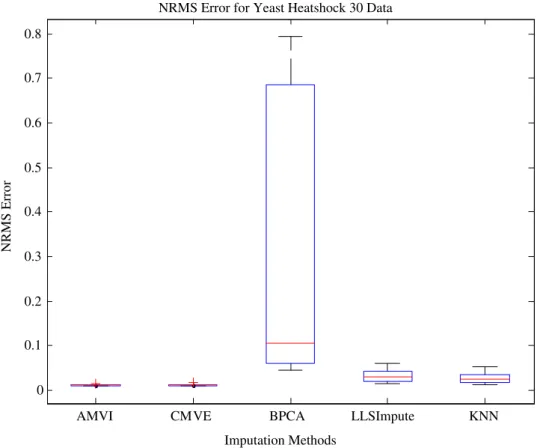
Figs. 17–20 demonstrate box plots of the NRMS error for 1–15% missing values for breast, ovarian cancer, and
AMVI CMVE BPCA LLSImpute KNN
0 0.05 0.1 0.15 0.2 0.25 0.3 0.35 0.4 0.45 0.5 NRMS Error Imputation Method NRMS Error for Ovarian Cancer Data
Fig. 18. NRMS error in BRCA1 ovarian cancer dataset for 1–15% missing valued data.
AMVI CMVE BPCA LLSImpute KNN
0 0.1 0.2 0.3 0.4 0.5 0.6 0.7 0.8 NRMS Error Imputation Methods
NRMS Error for Yeast Heatshock 30 Data
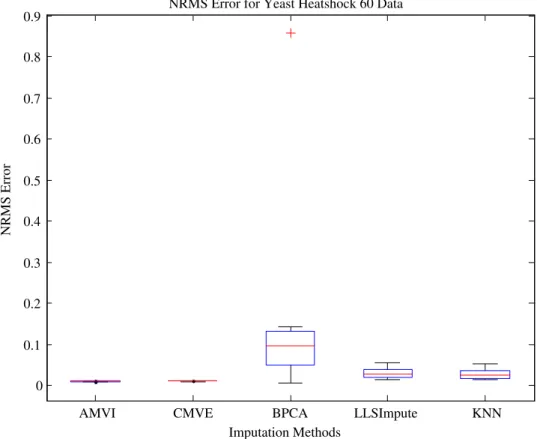
yeast data with results confirming the superior perfor-mance of AMVI in estimating missing values for all types of experimental data, across the range of missing values. The imputation results also revealed some interesting issues. Since, BPCA exploits only global correlation in the data; all other algorithms had a lower NRMS error in the case of the BRCA1, a locally correlated breast can-cer data (Fig. 17), though conversely, when it was used to estimate the missing values for the datasets possessing global correlation structure, it performed better than both KNN and LLSImpute (Fig. 18). The performance of AMVI was further evaluated on yeast data where the results again demonstrated that AMVI has lower estima-tion error rate in terms of NRMS error compared to the aforementioned imputation strategies (Figs. 19 and 20).
As mentioned earlier, it is highly important that tion methods should be able to demonstrate lower estima-tion errors across the range of datasets. For instance, BPCA method had lower imputation error for ovarian can-cer (Fig. 17) but showed largest disparity for yeast dataset (Fig. 19). Similarly, LLSImpute exhibited lower NRMS error for cancer datasets but could not maintain the same performance for both yeast datasets (Figs. 19 and 20) and the error rate was comparable to KNN. The CMVE (Fig. 17) exhibited lower NRMS error for both types of cancer data; but it did not maintain this performance when determining significant genes in the ovarian cancer data (Fig. 3) due to global correlation structure possessed by the dataset. In contrast, AMVI adapted to the correlation
structure of the data and showed improved performance for all types of datasets, so endorsing the strategy to com-pute the optimal number of predictor genes based on the correlation structure of the data, rather than using a fixed value.
5. Conclusions
This paper has presented a new Ameliorative Missing Value Imputation(AMVI) algorithm based on the concept of automatic estimation of the optimal number of predic-tor genes for the fusion of multiple imputation matrices. AMVI has demonstrated a capability to adapt to any type of data correlation, with experimental results including the True Positive rate of significant genes selection, bio-logical significance analysis of the selected genes, statisti-cal significance test and normalized root mean square error, proving this algorithm provided lower estimation error compared with other comparative missing value imputation techniques, namely CMVE, LLSImpute, BPCA, KNN, and ZeroImpute. The impact of this improvement was especially highlighted when significant genes were selected prior to imputation. The reason for this superior performance is that AMVI combines the exploitation of global and local correlations in a given dataset with the automatic selection of the optimal num-ber of predictor genes k by a wrapper non-parametric method based on Monte Carlo simulation. This consis-tently proved to be an effective and robust strategy
AMVI CMVE BPCA LLSImpute KNN
0 0.1 0.2 0.3 0.4 0.5 0.6 0.7 0.8 0.9 NRMS Error Imputation Methods
NRMS Error for Yeast Heatshock 60 Data
compared with the trial and error approaches adopted by CMVE and KNN for selecting k and confirmed that AMVI can be successfully applied to accurately impute missing values prior in any microarray data experiment.
Acknowledgments
The authors acknowledge the Victorian Partnership for Advanced Computing (VPAC) for providing computing facilities. The authors also formally thank the anonymous reviewers for their constructive suggestions.
References
[1] Lavine BK, Davidson CE, Rayens WS. Machine learning based pattern recognition applied to microarray data. Comb Chem High Throughput Screening 2004;7:115–31.
[2] Sehgal MSB, Gondal I, Dooley L. A collimator neural network model for the classification of genetic data. Adv Bioinform Appl World Sci 2004;8:229–39.
[3] Spellman PT, Sherlock G, Zhang MQ, Iyer VR, Anders K, Eisen M, et al. Comprehensive identification of cell cycle-regulated genes of the yeast Saccharomyces cerevisiae by microarray hybridization. Mol Biol Cell 1998;9:3273–97.
[4] Furey TS, Cristianini N, Duffy N, Bednarski DW, Schummer M, Haussler D. Support vector machine classification and validation of cancer tissue samples using microarray expression data. Bioinfor-matics 2000;16(10):906–14.
[5] Shipp MA, Ross KN, Tamayo P, Weng AP, Kutok JL, Aguiar RC, et al. Diffuse large B-cell lymphoma outcome prediction by gene expression profiling and supervised machine learning. Nat Med 2002;8(1):68–74.
[6] Gustavo B, Monard CM. An analysis of four missing data treatment methods for supervised learning. Appl Artif Int 2003;17(5–6):519–33.
[7] Ramaswamy S, Tamayo P, Rifkin R, Mukherjee S, Yeang CH, Angelo M, et al. Multiclass cancer diagnosis using tumour gene expression signatures. Proc Natl Acad Sci USA 2001;98(26): 15149–54.
[8] Sehgal MSB, Gondal I, Dooley L. Statistical neural networks and support vector machine for the classification of genetic mutations in ovarian cancer. In: IEEE symposium on computational intelligence in bioinformatics and computational biology (CIBCB)’04, USA; 2004. p. 140–6.
[9] Sehgal MSB, Gondal I, Dooley L. Communal neural network for ovarian cancer mutation classification. In: Complex’04, Cairns, Australia; 2004. p. 749–58.
[10] Golub TR, Slonim DK, Tamayo P, Huard C, Gaasen-beek M, Mesirov JP, et al. Molecular classification of cancer: class discovery and class prediction by gene expression monitoring. Science 1999;286(5439):531–7.
[11] Munagala K, Tibshiran R, Brown PO. Cancer characterization and feature set extraction by discriminative margin clustering. BMC Bioinform 2004;5:21.
[12] Sehgal MSB, Dooley L, Gondal I, Coppel R. Coalesce gene regulatory network reconstruction: a cross-platform transcriptional gene network fusion framework. IEEE-TENCON 2006:1–4. [13] Tuikkala J, Elo L, Nevalainen OS, Aittokallio T. Improving missing
value estimation in microarray data with gene ontology. Bioinfor-matics, 2005.doi:10.1093/bioinformatics/btk019.
[14] Oba S, Sato MA, Takemasa I, Monden M, Matsubara K, Ishii S. A Bayesian missing value estimation method for gene expression profile data. Bioinformatics 2003;19:2088–96.
[15] Jornsten R, Wang H-Y, Welsh WJ, Ouyang M. DNA microarray data imputation and significance analysis of differential expression. Bioinformatics 2005;21:4155–61. doi:10.1093/bioinformatics/bti638.
[16] Sehgal MSB, Gondal I, Dooley L. CF-GeNe: fuzzy framework for robust gene regulatory network inference. J Comp 2006;7:1–8.
[17] Eschrich S, Yeatman TJ. DNA microarrays and data analysis: an overview. Surgery 2004;136:500–3.
[18] Sehgal MSB, Gondal I, Dooley L. K-ranked covariance based missing values estimation for microarray data classification. IEEE Hybrid Intell Syst (HIS)’04, Japan 2004:274–9.
[19] Acuna E, Rodriguez C. The treatment of missing values and its effect in the classifier accuracy. Class Cluster Data Mining Appl 2004:639–48.
[20] Troyanskaya O, Cantor M, Sherlock G, Brown P, Hastie T, Tibshirani R, et al. Missing value estimation methods for DNA microarrays. Bioinformatics 2001;17:520–5.
[21] Sehgal MSB, Gondal I, Dooley L. A collateral missing value estimation algorithm for DNA microarrays. In: IEEE international conference on acoustics, speech, and signal processing (ICASSP), USA; 2005. p. 377–80.
[22] BøTH, Dysvik B, Jonassen I. LSimpute: accurate estimation of missing values in microarray data with least squares methods. Nucleic Acids Res 2004;32(3):e34.
[23] Sehgal MSB, Gondal I, Dooley L. Collateral missing value imputa-tion: a new robust missing value estimation algorithm for microarray data. Bioinformatics 2005;21(10):2417–23.
[24] Casella G, Robert CP. Monte Carlo statistical methods. Springer; 2005.
[25] Amir AJ, Yee CJ, Sotiriou C, Brantley KR, Boyd J, Liu ET. Gene expression profiles of BRCA1-linked, BRCA2-linked, and sporadic ovarian cancers. J Nat Cancer Inst 2002;94(13). [26] Hedenfalk I, Duggan D, Chen Y, Radmacher M, Bittner M, Simon
R, et al. Gene-expression profiles in hereditary breast cancer. N Engl J Med 2001;344(8):539–48 [p. 22].
[27] Matsumoto R, Akama K, Rakwal R, Iwahashi H. The stress response against denatured proteins in the deletion of cytosolic chaperones SSA1/2 is different from heat-shock response in
Saccharomyces cerevisiae. BMC Genomics 2005;6:141.
[28] Sidak Z, Sen PK, Hajek J. Theory of rank tests (probability and mathematical statistics). Academic Press; 1999.
[29] Ouyang M, Welsh WJ, Georgopoulos P. Gaussian mixture clustering and imputation of microarray data. Bioinformatics 2004;20(6):917–23.
[30] Kim H, Golub GH, Park H. Missing value estimation for DNA microarray gene expression data: local least squares imputation. Bioinformatics 2005;21:187–98. doi:10.1093/bioinformatics/bth499.
[31] Abelson RP. Statistics as principled argument. Lawrence Erlbaum Associates; 1995.
[32] Chen PY, Popovich PM. Correlation: parametric and nonparametric measures. 1st ed. SAGE Publications; 2002.
[33] Harvey M, Arthur C. Fitting models to biological data using linear and nonlinear regression. Oxford University Press; 2004.
[34] Cooper GM, Hausman RE. The cell: a molecular approach. 4th ed. ASM Press and Sinauer Associates, Inc.; 2006.
[35] Salceda S, Drumright C, DiEgidio A, Liang B, Hu P, Sun Y, et al. Identification of differentially expressed genes in breast cancer. Nat Genet 2001;27:83–4.
[36] Bø TH, Jonassen I. New feature subset selection procedures for classification of expression profiles. Genome Biol 2002;3(4). [research0017.1-research0017.11].
[37] Harvell DME, Richer JK, Allred DC, Sartorius CA, Horwitz KB. Estradiol regulates different genes in human breast tumor xenografts compared with the identical cells in culture. Endocrinology 2006;147:700–13. doi:10.1210/en.2005-0617.
[38] Mertens C, Kuhn C, Franke W. Plakophilins 2a and 2b: constitutive proteins of dual location in the karyoplasm and the desmosomal plaque. J Cell Biol 1996;135:1009–25. doi:10.1083/jcb.135.4.1009.
[39] Mertens C, Kuhn C, Moll R, Schwetlick I, Franke WW. Desmo-somal plakophilin 2 as a differentiation marker in normal and malignant tissues. Differentiation 1999;64:277–90. doi: 10.1046/j.1432-0436.1999.6450277.x.
[40] Jansen E, Laven JSE, Dommerholt HBR, Polman J, van Rijt C, van den Hurk C, et al. Abnormal gene expression profiles in human
ovaries from polycystic ovary syndrome patients. Mol Endocrinol 2004;18:3050–63. doi:10.1210/me.2004-0074.
[41] Lu M, Thompson WA, Lawlor DA, Reveille JD, Lee JE. Rapid direct determination of HLA-DQB1*0301 in the whole blood of normal individuals and cancer patients by specific polymerase chain reaction amplification. J Immunol Methods 1996;199:61–8.