Vol. 18, No. 4, August 2020, pp. 2027~2034
ISSN: 1693-6930, accredited First Grade by Kemenristekdikti, Decree No: 21/E/KPT/2018
DOI: 10.12928/TELKOMNIKA.v18i4.13968 2027
Green coffee beans feature extractor using image processing
Edwin R. Arboleda1, Arnel C. Fajardo2, Ruji P. Medina3
1Department of Computer and Electronics Engineering, College of Engineering and Information Technology, Cavite State University, Philippines
2Manuel L. Quezon University, Philippines 3Technological Institute of the Philippines, Philippines
Article Info ABSTRACT
Article history: Received Aug 24, 2019 Revised Mar 10, 2020 Accepted Mar 28, 2020
This study offers a novel solution to deal with the low signal-to-noise ratio and slow execution rate of the first derivative edge detection algorithms namely, Roberts, Prewitt and Sobel algorithms. Since the two problems are brought about by the complex mathematical operations being used by the algorithms, these were replaced by a discriminant. The developed discriminant, equivalent to the product of total difference and intensity divided by the normalization values, is based on the “pixel pair formation” that produces optimal peak signal to noise ratio. Results of the study applying the discriminant for the edge detection of green coffee beans shows improvement in terms of peak signal to noise ratio (PSNR), mean square error (MSE), and execution time. It was determined that accuracy level varied according to the total difference of pixel values, intensity, and normalization values. Using the developed edge detection technique led to improvements in the PSNR of 2.091%, 1.16 %, and 2.47% over Sobel, Prewitt, and Roberts respectively. Meanwhile, improvement in the MSE was measured to be 13.06%, 7.48 %, and 15.31% over the three algorithms. Likewise, improvement in execution time was also achieved at values of 69.02%, 67.40 %, and 65.46% over Sobel, Prewitt, and Roberts respectively.
Keywords: Image processing
New edge detection algorithm Prewitt
Roberts Sobel
This is an open access article under the CC BY-SA license.
Corresponding Author: Edwin R. Arboleda,
Department of Computer and Electronics Engineering, College of Engineering and Information Technology, Cavite State University, Indang, Cavite, Philippine. Email: [email protected]
1. INTRODUCTION
Coffee has achieved notable status in the world market and is a major influencer on culture and economy of many nations [1]. In the current world ranking, coffee is ranked second to water as the most consumed food product [2] and the second most in-demand product next only to petroleum [3]. Despite this, there is not a single, unified coffee bean grading standard accepted and adopted by all coffee exporting countries [4]. Each nation either follows an existing standard or has created its own standards [5]. Before green coffee beans can be classified and graded, their features must first be extracted [6]. Many kinds of research have been done in green coffee beans feature extraction which includes the use of chemicals [7, 8], different types of spectroscopy such as fluorescence [9], near infrared (NIRS) [10, 11], Fourier transform [12], and Raman [13, 14], electronic tongue [15], electronic nose (16), and image processing [17, 18].
The main disadvantage of using chemicals for feature extraction is the disposal of chemicals after use which are oftentimes hazardous to the environment [19]. The main drawback of the use of different
types of spectroscopy is it requires costly machines [20]. Electronic nose and electronic tongue also require complicated sensors that are not very easy to set-up and used [21-23]. Aside from these major disadvantages, the above methods also need to destroy the beans as they require grinding, require rigorous sample preparation, and has lengthy feature extraction in terms of time [24]. A notable exception is the use of near-infrared spectroscopy which does not need to destroy samples, requires very simple sample preparation, and has short span of time for feature extraction. Nevertheless, NIRS machines are expensive [25].
Image processing is one of the most promising techniques to extract green coffee bean features because it does not require complicated sensors and highly technical electronics [26, 27]. It only needs a camera, a lighting mechanism, a computer or a microcontroller and a good algorithm for feature extraction [28, 29]. A principal operation in image processing is the detection of edges [30]. Edges are the borderline in the image revealed by pixels exhibiting disruption in grey level to adjoining pixels [31]. To sustain the arrangement of an object while avoiding loss of information for another image processing is the primary objective of using edge detection [32].
The detection of the green coffee features using image processing require edge detection algorithms. This can be done using a variety of techniques of which first-order derivative-based algorithms such as Sobel, Prewitt, and Roberts are the simplest and most commonly used. However, these algorithms are susceptible to noise due to diverse modes of differential operations [33, 34]. At the same time, the computational complexity of the three algorithms has also resulted to large execution times [35-37]. As such, there is a need to address the susceptibility to noise of the first-order derivative-based algorithms as well as their slow execution times and test their applicability towards the edge detection and feature extraction of green coffee beans.
2. RESEARCH METHODS
2.1. Design considerations
The major considerations for the study are the type of hardware and software to use to achieve the objectives of the study. It was decided that the suitable software to use is the Python because of the Open CV which has many libraries in image processing. Since the Raspberry Pi uses Python, it was the hardware of choice. The Raspberry Pi camera module was not used because an ordinary webcam can be used for the same result of the Raspberry Pi camera. The cost was also considered as the A4 tech webcam is half the price of a Raspberry Pi Camera.
2.2. The developed new edge detection algorithm
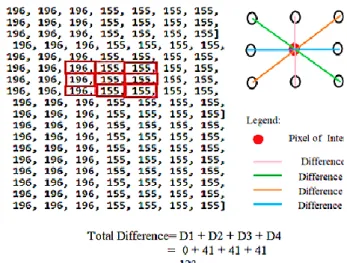
In this study, the differences between pixels surrounding the pixel of interest as shown in Figure 1 was computed. The pixel of interest is the pixel in the middle or the pixel that is surrounded by 8 other pixels, namely the upper left, left, lower left, top, bottom, upper right, right and lower right. To calculate the total difference, (1) was used.
Total Difference = (Top Pixel Value-Bottom Pixel Value)+ (1)
(Upper Left Pixel Value-Lower Right Pixel Value)+
(Left Pixel Value-Right Pixel Value) + (Lower left Pixel Value-Upper Right Pixel value)
The sample computation of total difference where the pixel of interest is an edge is shown in Figure 2. Using formula number 1, all values of the total difference greater than zero is considered as an edge, while non-edge will have a value of zero. The discriminant for the new edge detection algorithm is the total difference multiplied by intensity and divided by normalization value as shown in (2).
New Edge Detection Discriminant = Total Difference ∗ Intensity
Normalization (2)
The pseudocode for edge detection is shown in Table 1. Using the program shown as pseudocode in Table 1, experiments were made to determine which possible combinations of pixel differences between pixel values of top and bottom, left and right, top_left and top_right bottom_left and bottom_right yielded the best edge detection. The best combination based on the output produced is the total difference of top pixel minus bottom pixel plus left pixel minus right pixel that is the reason why other differences were not included in the pseudocode.
Figure 1. Differences of pixel value was
computed to classify pixel of interest Figure 2. Sample computation of the total difference Table 1. The pseudocode for the new edge detection algorithm
Algorithm # program start
Import OpenCV library
start
# input section
define the normal value for x
x value to be divided by 500
define the new edge algorithm parameters - image and intensity define height I and width j of an image
define the edge # processing section
for all height i and width j pixels in range extract pixel values of
top and bottom left and right
top_left and top_right
bottom_left and bottom_right
extract differences
difference 1 = top minus bottom difference 2 = left minus right extract total difference
total difference = difference 1 + difference 2 total difference = normal (total difference) * intensity
extract pixels of the image image_pix = image [i , j] extract edge_image
edge_image [ i , j] = image_pix * total difference # output section
display input image
display input image converted to gray scale display detected edge
end
#eop
A normalizing value is a ratio, which means that for any value of total difference, it is divided by 500. The normalized value is then multiplied to the intensity which was given a value of 10. Without the normalizing value and intensity value, the edge that was produced by using only the total difference is not continuous. In the pseudocode shown in Table 1, the normalized value is 1/500 and x is the total difference. The program flowchart of the system is shown in Figure 3.
The green coffee beans samples were arranged manually by hand to the sample feeder. The whole program was written in Python for the prototype. The start of the program is by setting up the slider button so that the user can set-up the Normalize value. Then the image is captured by the camera and edge is detected
using the newly developed algorithm. The edge is necessary to determine if the object is a coffee bean or not. If the object has an edge, therefore, it is a coffee, the contour will be determined and a bounding box will fence the coffee beans. The bounding box is the region of interest.
2.3. The developed hardware for the prototype
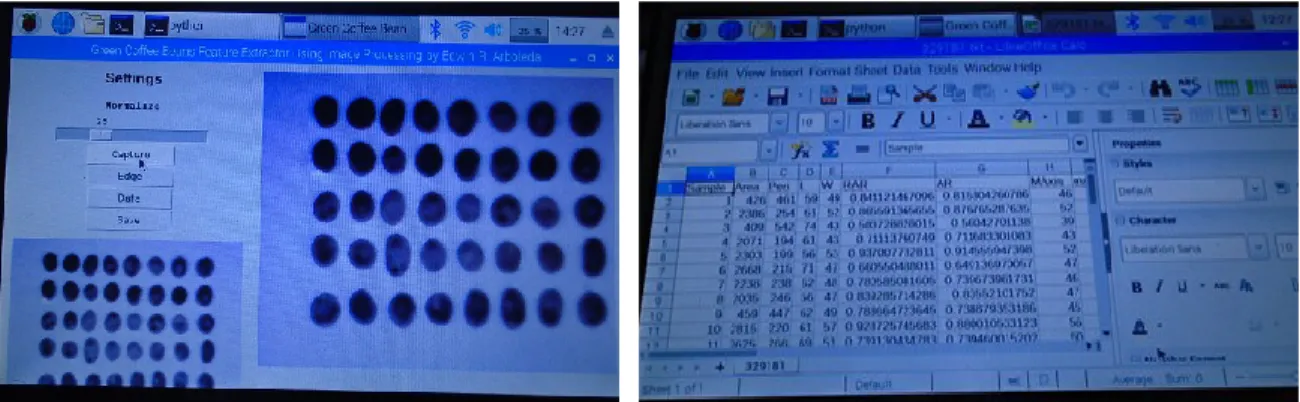
The user can access the prototype through the graphical user interface shown in Figure 4. The graphical user interface (GUI) of the prototype has 5 buttons corresponding to different functions, namely normalize, capture, edge, data, and save. The Normalize button is a slider button where the value can be adjusted from 0 to 100. The Capture button is for taking the images of the coffee beans. In Figure 4 there are two images captured by the prototype, the sizes of these images are 300x300 pixels and 800x600 pixels respectively. Edge button is for showing the edge detected by the developed algorithm. The Data button is for extracting the features of the coffee beans. When the edge is detected, the program then determines the contour inside the edge. A rectangular bounding box indicates that the edge and contour have been detected and inside the bounding box the morphology, color, and texture will be extracted. The save button is for saving the extracted features in the USB flash drive. The files can be viewed using the Libre Office Calc in the spreadsheet format as shown in Figure 5.
Figure 3. The program flowchart for the system
Figure 4. The graphical user interface Figure 5. The extracted features viewed using the Libre Office Calc
The first column of the Libre Calc Office spreadsheet shown in Figure 5 is the sample number of the coffee bean and the rest of the columns are the 21 extracted features from that bean. The bottom view of
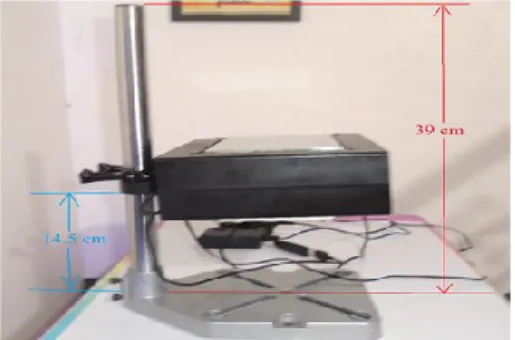
the prototype is shown in Figure 6. The LED strip powered by 12 V DC adapter serves as the lighting mechanism of the prototype shown in Figure 6. Because of the major advantage of the developed algorithm wherein, the image parameters can be adjusted using the Normalized button, the device can function even without the LED strip ON as long as there is ample light in the surrounding area or in the room. In the center of Figure 6 is the A4tech webcam PK -835G, it is a low-cost camera suitable for the prototype because there is an adjustment where parameters of the image can be manipulated. The developed prototype in this study is shown in Figure 7.
Figure 6. Prototype bottom view showing the LED strip and webcam
Figure 7. The prototype with the height adjustment set-up
The design of the prototype was based on a microscope wherein the height of the camera can be adjusted. For most of the testing done in the prototype, the camera module stopper was set-up at 14.5 cm. At this height, the camera can take 40 beans at a time. The lighting was optimum at this height without producing any shadows. More beans can be captured at higher set-up, but the additional lighting needs to be added. The based is from an old electronic drill used for drilling printed circuit board.
3. RESULTS AND DISCUSSION
3.1. The list of features that can be extracted by the prototype
More than 2000 Robusta green coffee beans were used for testing and evaluation of the prototype. The green coffee beans are from Indang, Cavite from which morphology, color and texture features were extracted. Table 2 shows the list of features that can be extracted by the program. There are a total of 21 features that can be extracted by the program. It is composed of 11 morphological features, 6 color features and 4 texture features.
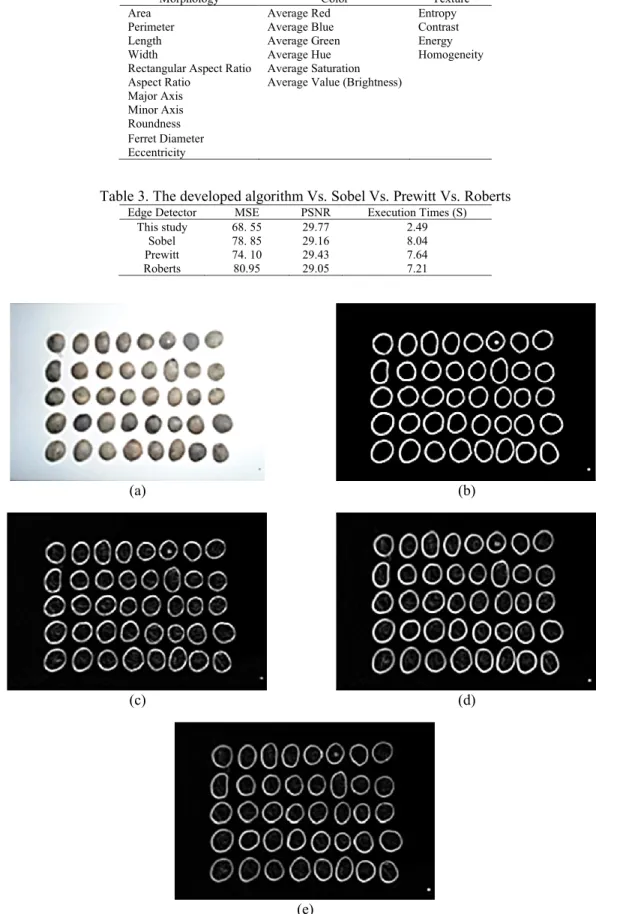
3.2. Comparison of the developed algorithm with the Sobel, Prewitt, and Roberts edge detection algorithm The developed edge detection algorithm was loaded in a computer and its performance was compared to Sobel, Prewitt and Roberts Edge algorithm as shown in Figure 8. Using visual observation on Figure 8, and it can be seen that the developed algorithm is better in detecting edges as compared to Sobel, Prewitt, and Roberts algorithm. The images in Figure 8 were compared using the mean squared error (MSE), peak signal to noise ratio (PSNR) and execution times. All the images are made same size, because the Python program functions only if they are of different sizes. Execution times of the newly developed algorithm and the three first order edge detection algorithms were independently timed, measured and compared. The result of the evaluation is shown in Table 3.
The developed algorithm has lower mean square error compared to Sobel, Prewitt and Roberts edge detection algorithm which means that the difference between the original image and the image with the detected edge is lowest as compared to the other three algorithms. The developed algorithm got the higher PSNR, this confirms the visual inspection which means that the peak signal is higher in the developed algorithm as compared to noise. Also, execution times in the developed algorithm is faster than all three first degree derivative algorithms.
Better performance of the developed algorithm as compared to other three conventional algorithms can be attributed to the adjustments done by normalization to the image. In Sobel, Prewitt and Roberts edge detection shown in Figure 8, the noise inside the edge of the coffee beans can be clearly seen, whereas in using the newly developed edge detection these noises were eliminated. Also, the execution time of the newly developed algorithm is 2.49 seconds which is faster than all three conventional first degree
Table 2. Features that can be extracted by the program
Morphology Color Texture
Area Average Red Entropy
Perimeter Average Blue Contrast
Length Average Green Energy
Width Average Hue Homogeneity
Rectangular Aspect Ratio Average Saturation Aspect Ratio Average Value (Brightness) Major Axis
Minor Axis Roundness Ferret Diameter Eccentricity
Table 3. The developed algorithm Vs. Sobel Vs. Prewitt Vs. Roberts
Edge Detector MSE PSNR Execution Times (S)
This study 68. 55 29.77 2.49 Sobel 78. 85 29.16 8.04 Prewitt 74. 10 29.43 7.64 Roberts 80.95 29.05 7.21 (a) (b) (c) (d) (e)
Figure 8. Original image and the different edges derive using different algorithms; (a) original image, (b) newly developed edge detection algorithm, (c) Sobel edge detection algorithm,
4. CONCLUSIONS
Based on the results of the different tests conducted in this study, the following conclusions are drawn: A discriminant for edge detection was developed as defined as
New Edge Detection Discriminant = Total Difference ∗ Intensity
Normalization
As applied to coffee beans, the optimal values are 10 for intensity; and 25 to 40 for normalization and dependent on image. The pixel pair formation that produces optimal peak signal to noise ratio is the sum of the difference of top pixel and bottom pixel and difference of left pixel and right pixel.The improvement of the developed edge detection algorithm over Sobel, Prewitt, and Roberts are: 2.091%, 1.16%, and 2.47% in terms of PSNR, respectively; 13.06%, 7.48%, and 15.31% in terms of MSE, respectively; 69.02%, 67.40%, and 65.46% in terms of execution time, respectively. The coffee bean features extracted by the prototype are: area, perimeter, length, width, rectangular aspect ratio, aspect ratio, major axis, minor axis, roundness, ferret diameter, eccentricity for morphology; average red, average blue, average green, average hue, average saturation, average values for color; and entropy, contrast, energy, and homogeneity for texture.
Overall, it can be claimed that the general objective of this study which is to develop a new edge detection approach for green coffee beans feature has been achieved. The main objective has been achieved by using the heuristic approach in calculating the right values for the discriminant and finding the best pixel formation that produces the optimal PSNR. The newly developed edge detection algorithm was proven better than Roberts, Prewitt and Sobel algorithm in terms of PSNR, MSE and execution times. Upon integrating the newly developed algorithm in a Raspberry Pi microcomputer, the developed hardware was able to extract the morphological, color and texture features of the green coffee beans.
REFERENCES
[1] Cao E. P., Constantino-Santos D. M., Anjela L., Ramos P., Santos B. S., Quilang J. P., et al., "Molecular and morphological differentiation among Coffea (Rubiaceae) varieties grown in the farms of Cavite Province, Philippines," Philipp Sci Lett, Vol. 387, No. 2, 2014. [cited 2017 Jun 3] [Internet]. Available from: http://philsciletters.org/2014/PSL 2014-vol07-no02-p387-397 Cao.pdf
[2] Farah A., Ferreira T., "The Coffee Plant and Beans: An Introduction," In: Preedy VR, editor. Coffee in Health and Disease Prevention. Academic Press., pp. 5-10, 2015.
[3] Nair K. P. P., "6-Coffee," In: The Agronomy and Economy of Important Tree Crops of the Developing World. Elsevier, pp. 181-208, 2010.
[4] Datov A., Lin Y.-C., "Classification and Grading of Green Coffee Beans in Asia," 2019. [Internet]. Available from: http://ap.fftc.agnet.org/ap_db.php?id=992&print=1
[5] "International Coffee Organization. Grading and Classification of Green Coffee," 2018 [cited 2018 Sep 23]. [Internet]. Available from: http://www.ico.org/projects/Good-Hygiene-Practices/cnt/cnt_en/sec_3/docs_3.3/Grading & class.pdf
[6] Franca A. S., Oliveira L. S., Mendonc J. C. F., Silva A., "Physical and chemical attributes of defective crude and roasted coffee beans," Food Chem. Vol. 90, pp. 89-94, 2005.
[7] Barbosa R. M., Batista B. L., Varrique R. M., Coelho V. A., Campiglia A. D., Barbosa F., "The use of advanced chemometric techniques and trace element levels for controlling the authenticity of organic coffee," Food Res Int.
Vol. 61, pp. 246-251, 2014.
[8] Calvini R., Ulrici A., Manuel J., "Chemometrics and Intelligent Laboratory Systems Practical comparison of sparse methods for classi fi cation of Arabica and Robusta coffee species using near infrared hyperspectral imaging," Chemom Intell Lab Syst, Vol. 146, pp. 503-511, 2015. [Internet]. Available from: http://dx.doi.org/10.1016/ j.chemolab.2015.07.010
[9] Borisova E., Yulia M., Asnaning A. R., Suhandy D., Yulia M., Suhandy D., "Discrimination of several Indonesian specialty coffees using Fluorescence Spectroscopy combined with SIMCA method Discrimination of several Indonesian specialty coffees using Fluorescence Spectroscopy combined with SIMCA method," In: 3rd ICChFSA 2017. IOP Conference Series: Materials Science and Engineering, pp. 1-7, 2018.
[10] Abidin S. Z., Kamil W. A., Juliano P., "Portable near infrared spectroscopy applied to quality control of Brazilian coffee," Food Biosci. 2016.
[11] Páscoa R. N. M. J., Sarraguça M. C., Magalhães L. M., Santos J. R., Rangel A. O. S. S., Lopes J. A., "Use of Near-Infrared Spectroscopy for Coffee Beans Quality Assessment," In: Coffee in Health and Disease Prevention, pp. 933-942, 2015. [Internet] Available from: http://dx.doi.org/10.1016/B978-0-12-409517-5.00103-0
[12] Craig A. P., Franca A. S., Oliveira L. S., "Evaluation of the potential of FTIR and chemometrics for separation between defective and non-defective coffees," Food Chem. Vol. 132, No. 3, pp. 1368-1374, 2012.
[13] El-Abassy R. M., Donfack P., Materny A., "Discrimination between Arabica and Robusta green coffee using visible micro Raman spectroscopy and chemometric analysis," Food Chem., Vol. 126, No. 3, pp. 1443-1448, 2011. [14] Keidel A., Von Stetten D., Rodrigues C., Máguas C., Hildebrandt P., "Discrimination of green arabica and Robusta
[15] Lopetcharat K., Kulapichitr F., Suppavorasatit I., Chodjarusawad T., Phatthara-Aneksin A., Pratontep S., et al., "Relationship between overall difference decision and electronic tongue: Discrimination of civet coffee," J Food Eng., Vol. 180, pp. 60-68, 2016. [Internet] Available from: http://dx.doi.org/10.1016/j.jfoodeng.2016.02.011 [16] Ongo E., Falasconi M., Sberveglieri G., Antonelli A., Montevecchi G., "Chemometric Discrimination of Philippine
Civet Coffee Using Electronic Nose and Gas Chromatography Mass Spectrometry," In: Procedia Engineering. Elsevier B.V., pp. 977-980, 2012. [Internet]Available from: http://dx.doi.org/10.1016/j.proeng.2012.09.310 [17] Hendrawan Y., Widyaningtyas S., Sucipto S., "Computer vision for purity , phenol , and pH detection of Luwak
Coffee green bean," TELKOMNIKA Telecommunication Computing Electronics and Control, Vol. 17, No. 6, pp. 3073-3085, 2019.
[18] Mengistu A. D., "The Effects of Segmentation Techniques in Digital Image Based Identification of Ethiopian Coffee Variety," TELKOMNIKA Telecommunication Computing Electronics and Control, Vol. 16, No. 2, pp. 713-721, 2018. [19] Williams P., "Near-Infrared Technology : Getting the Best Out of Light. Lawrence S, Warburton P, editors.,"
Value Added Wheat CRC, Limited, 2004.
[20] Williams P., "Near-Infrared Technology : In the Agricultural and Food Industries 2nd Edition. 2nd ed. Norris K, editor.," American Association of Cereal Chemists; 2001.
[21] Dong W., Zhao J., Hu R., Dong Y., Tan L., "Differentiation of Chinese robusta coffees according to species, using a com-bined electronic nose and tongue, with the aid of chemometrics," Food Chem. 2017.
[22] Gunawan B., Alfarisi S., Satrio G., Sudarmaji A., "MOS gas sensor of meat freshness analysis on E-nose,"
TELKOMNIKA Telecommunication Computing Electronics and Control, Vol. 17, No. 2, pp. 771-780, 2019. [23] Sarno R., Wijaya D. R., "Recent development in electronic nose data processing for beef quality assessment,"
TELKOMNIKA Telecommunication Computing Electronics and Control, Vol. 17, No. 1, pp. 337-348, 2019. [24] Ongo E., Falasconi M., Sberveglieri G., Antonelli A., Montevecchi G., Sberveglieri V., et al., "Chemometric
discrimination of philippine civet coffee using electronic nose and gas chromatography mass spectrometry," Procedia Eng., Vol. 47, No. 9, pp. 977-980, 2012.
[25] Arboleda E. R., "Discrimination of civet coffee using near infrared spectroscopy and artificial neural network," Int J Adv Comput Res., Vol. 8, No. 39, pp. 324-34, 2018.
[26] Arboleda E. R., Fajardo A. C., Medina R. P., "Classification of Coffee Bean Species Using Image Processing, Artificial Neural Network and K Nearest Neighbors," 2018 IEEE Int Conf Innov Res Dev., pp. 1-5, May 2018. [27] Arboleda E. R., Fajardo A. C., Medina R. P., "An Image Processing Technique for Coffee Black Beans
Identification," In: 2018 IEEE International Conference on Innovative Research and Development (ICIRD).
IEEE; pp. 1-5, 2018.
[28] Oliveira E. M. De, Leme D. S., Groenner B. H., Rodarte M. P., Gualberto R., Alvarenga F., "A computer VISION system for coffee beans classification based on computational intelligence techniques," J Food Eng., 2015; [29] Faridah, Gea O. F. Parikesit F., "Coffee Bean Grade Determination Based on Image Parameter," TELKOMNIKA
Telecommunication Computing Electronics and Control, Vol. 9, No. 3, pp. 547-54, 2011.
[30] Nagasankar T., Ankaryarkanni B., "Performance Analysis of Edge Detection Algorithms on Various Image Types," Indian J Sciemce Technol., Vol. 9, June 2016.
[31] Sujatha P., Sudha K. K., "Performance Analysis of Different Edge Detection Techniques for Image Segmentation,"
Indian J Sci Technol,. 8, July 2015.
[32] Gupta M., Tazi S. N., Jain A., "Edge Detection Using Modified Firefly Algorithm," In: 2014 Sixth International Conference on Computational Intelligence and Communication Networks Edge," 2014.
[33] El-sayed M. A., Sennari H. A. M., "Multi-Threshold Algorithm Based on Havrda and Charvat Entropy for Edge Detection in Satellite Grayscale Images," J Softw Eng Appl., pp. 42-52, January 2014.
[34] El-sayed M. A., Khfagy M. A., "Using Renyi’s Entropy for Edge Detection in Level Images," Int J Intell Comput Inf. Sci., Vol. 2, July 2011.
[35] Goyal A., Li Z., Kimm H., "Comparative Study on Edge Detection Algorithms using OpenACC and OpenMPI on Multicore Systems," In: 2017 IEEE 11th International Symposium on Embedded Multicore/Many-core Systems-on-Chip Comparative," 2017.
[36] Sponton H., Cardelino J., "A Review of Classic Edge Detectors Algorithms Based on the First Derivative," Image Process Line, Vol. 5, pp. 90-123, 2015.
[37] Ray M. K., Mitra D., Saha S., "Simplified Novel Method for Edge Detection in Digital Images," In: Proceedings of 2011 International Conference on Signal Processing, Communication, Computing and Networking Technologies (ICSCCN 2011), pp. 197-202, 2011.