A New Unsupervised Feature Selection Method for Text
Clustering Based on Genetic Algorithms
Pirooz Shamsinejadbabki, Mohammad Saraee*
Abstract: Nowadays a vast amount of textual information is collected and stored in various databases around the world, including the Internet as the largest database of all. This rapidly increasing growth of published text means that even the most avid reader cannot hope to keep up with all the reading in a field and consequently the nuggets of insight or new knowledge are at risk of languishing undiscovered in the literature. Text mining offers a solution to this problem by replacing or supplementing the human reader with automatic systems undeterred by the text explosion. It involves analyzing a large collection of documents to discover previously unknown information. Text clustering is one of the most important areas in text mining, which includes text preprocessing, dimension reduction by selecting some terms (features) and finally clustering using selected terms. Feature selection appears to be the most important step in the process. Conventional unsupervised feature selection methods define a measure of the discriminating power of terms to select proper terms from corpus. However up to now the valuation of terms in groups has not been investigated in reported works.
In this paper a new and robust unsupervised feature selection approach is proposed that evaluates terms in groups. In addition a new Modified Term Variance measuring method is proposed for evaluating groups of terms. Furthermore a genetic based algorithm is designed and implemented for finding the most valuable groups of terms based on the new measure. These terms then will be utilized to generate the final feature vector for the clustering process . In order to evaluate and justify our approach the proposed method and also a conventional term variance method are implemented and tested using corpus collection Reuters-21578. For a more accurate comparison, methods have been tested on three corpuses and for each corpus clustering task has been done ten times and results are averaged. Results of comparing these two methods are very promising and show that our method produces better average accuracy and F1-measure than the conventional term variance method.
Keywords Text clustering. Unsupervised feature selection. Genetic algorithm
1 Introduction
Up to the year 2000 it has been reported that well over one thousand petabaytes of data were accumulated and stored in mainframes, servers and client PCs not including Internet data. A significant portion of this vast amount of data is in text format (Sullivan 2001) and cannot be explored by humans unaided. Automatic tools for extracting useful knowledge from text are needed. Text has more complex structure than numeric data stored in database tables and therefore working with text requires more elaborate tools and techniques. Up to now, many applications of text mining are reported in the literature. Text mining is used in medical domains to find unknown relations between diseases and drugs. In the business world, text mining is utilized to extract useful knowledge from the web for better decision making. Furthermore to prevent threats against national security, Text Mining can be powerful tool for finding malicious patterns in texts that are exchanged between people. Text mining covers many areas, including Information Retrieval (IR), Information Extraction (IE), Text Classification and Text Clustering. The last two are more significant due to their particular applications and
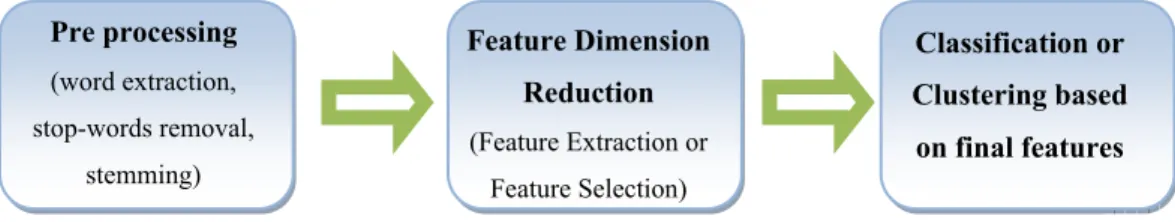
normally are used as a subtask of other applications like IE and IR. Text classification means defining some common features between documents and then grouping them based on feature similarity (Miller 2005). The basic difference between text classification and text clustering is that in text classification, groups are predefined in spite of text clustering. Up to now many methods have been proposed in the field of text clustering including (Basu et al. 2002; Buddeewong and Worapoj 2005; Jain et al. 2004; Lee et al. 2006; Shang et al. 2006; Sun and Sun 2005; Wang and Zhang 2005; XU and Wang 2004). Some Text Classification methods also can be found in (Hung and Wermter 2003; Massey 2005; Song and Park 2006). Both text clustering and text classification include three phases as shown in Figure 1.
The second phase of text clustering is feature dimension reduction. Since the dimension of a corpus usually is very large, text classification and clustering are prone to error and there is a need to reduce corpus dimension. Feature extraction and feature selection are two commonly used methods for reducing the dimension of corpus. It’s important to notice that in text mining literature features usually are terms.
Feature extraction is the process of extracting new features from the set of all features by means of some functional mapping (Liu et al. 2005). Many works have been reported on feature extraction including those in (Bao et al. 2003; Kuntraruk and Pottenger 2001). The important shortcoming of feature extraction methods is that features which are created by these methods have no meaning and therefore it is hard to interpret the results (Liu et al. 2005). Feature selection methods on the other hand select some of the existing terms based on some measures and generate the final feature vector (Liu et al. 2005). Feature selection methods divide into two categories: supervised and unsupervised. Supervised methods need training data, unlike unsupervised methods. The work that is presented here is a new unsupervised feature selection method.
Up to now, many unsupervised feature selection methods have been reported in the literature. The most popular ones are Document Frequency (DF), Term Frequency Inverse Document Frequency (TFIDF), Term Contribution (TC), Term Variance (TV) (Liu et al. 2005; Yang and Pedersen 1997), Information Gain (IG), Mutual Information (MI),
χ
2, Relative Document Frequency (RDF), Relative Information Gain (RIG) and Relative Mutual Information (RMI) (Prabowo and Thelwall 2006; Yang et al. 2002; Yang and Pedersen 1997). All the methods mentioned work in three major steps:1. Define a formula for measuring the discriminative power of a term. 2. Sort the terms based on the value of defined measurement.
3. Choose a number of the terms from top of the list.
As indicated above the discriminative power is the sign of the quality of a term for clustering or classification task.
In all traditional feature selection methods, the measure is defined for single terms only. The focal point of this work is to devise a new measurement for investigating discriminative power of a number of terms combined
Pre processing (word extraction, stop-words removal, stemming) Feature Dimension Reduction (Feature Extraction or Feature Selection) Classification or Clustering based on final features
together as one and in relation with each other. The aim is to find and select terms with high discriminative power in the corpus even though they have low values in existing measurements. A GA method to compute the new measurement for terms is also presented.
The organization of the rest of this paper is as follows: section 2 introduces TV feature selection method. Our proposed feature selection method and Modified Term Variance measure (MTV) are presented in section 3. A genetic algorithm is designed for the new feature selection methods and is presented in section 4. In section 5 experimental results of implementation of the new method and the traditional TV method on the reuters-21578 corpus are reported. Finally in section 6 we conclude the paper by outlining a few future extensions to this work.
2 Term Variance Feature Selection Method
This method computes the variance for all terms in documents and uses it as a measure for feature selection. The Term Variance method tries to find terms that have two criteria: 1- high document frequency and 2- nonuniform distribution among documents. Let ti be ith term of corpus, fij frequency of ti in jth document and fi average frequency of term ti in the corpus, then Term Variance is computed by this formula:
∑
=−
=
N j i ij if
f
t
v
1 2]
[
)
(
As shown above if term frequency is large but near to the average value among all documents, its variance decreases and the term has no chance of being selected.
3 Proposed Feature Selection Method
The proposed method is an unsupervised feature selection method and evaluates the discriminative power of terms in group form. The motivation behind this approach is that it is probable that some terms have low discriminative power for clustering but when they form a group, they may have good discriminative power. The reason is that when some correlated terms form a group together they represent a concept and this is what we are looking for in a clustering task. In addition we will solve the polysemy and synonymy problems with this method.
For example term “draft” has different meaning in the following categories: 1- document, proposal, white paper
2- conscription, military, war 3- withdrawal, cheque
Although “draft” may have quite high TV in the corpus, it has several different meanings and so can mislead the clustering process. On the other hand terms like “document” or “war” may have low TV and therefore are not chosen. The main point of this work is to discover terms like “war” or “document” in addition to “draft”. Considering “draft” and “war” together in the feature vector can increase clustering accuracy because the term “war” distances documents that contain “draft” with the “proposal” meaning from documents that contain “draft” with the “war” meaning.
3.1 Vector Feature and Feature Vector
In our new method we consider a vector of terms and evaluate its discriminative power combined together as a single feature; this group of terms is called vector feature. It’s worth mentioning that vector feature is different from feature vector as used commonly in data mining literature. The feature vector is the final result of the dimension reduction phase in the Data Mining process but a vector feature is a type of feature that has more than one term. In our selection method first we find some vector features and combine them to form the final feature vector. Note that although they have the same format (i.e. group of terms) but their meanings are different.
3.2 Modified Term Variance
Since in the proposed method we intend to concentrate on groups of terms and evaluate their discriminative power, therefore the term variance measure is modified and adjusted to be employed by a vector feature. The Modified Term Variance (MTV) is computed using the following formula:
∑
=−
=
N j th i th ij ith
vf
vf
t
v
1 2 , ,]
[
)
,
(
r
Where ti r : ith vector featureth
: “contain threshold” th ijvf , : frequency of tri in jth document where “contain threshold” is
th
th i
vf , : average frequency of ti r
in corpus where “contain threshold” is
th
The “contain threshold” shows the percentage of number of vector feature terms that must be in a document for vector feature to be considered as contained in that document.
th ij vf , defines as follows: 1 , ( , , ) 0 m kj j i k ij th f if contains d t th vf otherwise = =
∑
rWhere
f
kj: frequency ofk
th term of ti rin document
d
jm: number of terms in tri
( , , )j i
contains d t thr is a logical function that examines the presence of vector feature tri in document
d
j with contain thresholdth
. If the percentage of terms of tir
that are in document
d
jbe equal or larger thanth
this function returns true and otherwise returns false.Simply defined, the frequency of a vector feature in a document is the sum of the frequencies of its terms if the percentage of number of its terms presented in that document is at least equal to
th
and is zero otherwise. Average frequency for vector features is arithmetic mean of its terms.Now we can use the MTV measure to find the most effective vector features for clustering. The problem here is that the number of possible vector features in a corpus is too many. The following example shows how this number may get too large. In a corpus with 100 documents where each document has 10 distinct terms, the number of possible vector feature will be 127400. It is worth noting that in our computation we didn’t count
possible vector features that can be made by terms from different documents while we need to consider all of them for obtaining acceptable results. Therefore we couldn’t use exhaustive searches for finding proper vector features. The GA which is described in the following section is a very well known approach to tackling this problem.
4 Designed Genetic Algorithm
GA is a learning method inspired by biological evolution. It tries to find the optimum or almost optimum points in search space without exploring all of it. Up to now some work has been done on using GA for text clustering. For example in (Song and Park 2006) GA is used in the clustering phase of the TC process shown in fig. 1 to finding the optimal number of clusters. Song and Park also have used a GA (Song and Park 2009) to devise a Latent Semantic Indexing method for an information retrieval task. In this work we exploit GA techniques for finding vector features with the most MTV value in the corpus.
4.1 Search Space
Each distinct term in the corpus is a dimension of search space. For example a corpus with 100 documents where each document has 10 distinct terms makes a search space with dimension of 1000.
4.2 Chromosomes
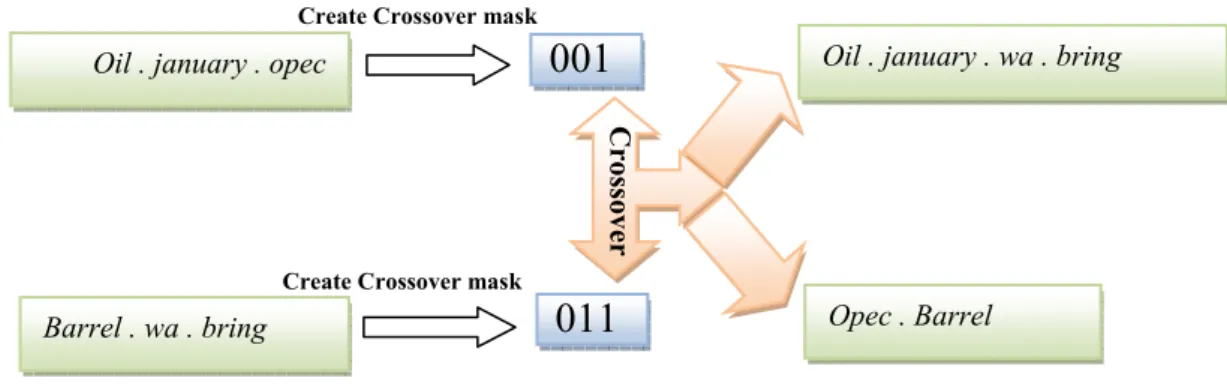
In this work each vector feature is a chromosome. Because of the large dimension of the search space, use of binary encoding for chromosomes makes them too long and sparse (containing many 0s and a few 1s). The chromosomes are illustrated as a set of terms, where each gene is a term. For example one chromosome could be like this: Oil . january . opec
4.3 Initial population
Each GA evolution starts with a population of initial chromosomes that form some initial solution to the problem. Here we first compute the number of chromosomes that will be generated from terms of each document using the following formula:
j j l noc = L×p j
l
: length of jth documentL
: length of corpusp
: size of populationThen for each chromosome a random length will be generated and finally terms will be randomly selected from the document and form the chromosome.
4.4 Fitness
Here we defined fitness function as follows:
(
i)
(
i, ) ln(
(
i) 1)
In this fo the case It’s worth traditiona The subtl the evolu terms co-2 for an e 4.5 Sele In the de wheel sel GA appli 4.6 Cro Crossove one by c plain ran two chro finally jo Where ormula, value of chromosom h noting that al methods bu le point to no ution phase to -occur in docu empirical expe ection esigned GA fo lection metho ications and th ossover ope er is one of th combining two dom search. T mosomes by t oins their parts
(
i, )
mtv ch th
(
length c
‘1’ is added mes with leng in our new m ut also groups tice here is th o grow drama uments goes d eriment. Figure 2: re or selecting c od (Goldberg 1 he emphasis is ration e most import o chromosom The crossover the roulette w s in crossover)
: modified te)
ich
: number to the length gth one, since method it is d of terms that hat the propose atically, becaudown and con
elation betwee
hromosomes 1989; Coley 1 s on extraction
tant operation mes from the c
operation use wheel selection fashion. This erm variance o r of genes(term of chromosom e we do not w esirable to fin can generate v ed fitness fun use when a ch nsequently its en vector feat
from the pop 1999; Mitchell n in the search ns in a GA tha current genera ed here is like n method and operation is s of
ch
iwith “c ms) in chromo me. This is to want to lose si nd not only si vector feature nction might n hromosome be fitness will d ture length a pulation to add l 1997) is use h space more t at tries to reac ation. This op a traditional then breaks th shown in figur ontain thresho osomech
i o avoid the resingle terms w ingle terms w es with high M not cause the s ecomes long, decline. This p
and its fitness
d to the next d. This metho than explorati ch a fitter gene peration make single point c hem at random re 3. old”
th
sult of ln bein with high term with high varia MTV. size of chromo the probabili point is shown generation th od is common ion. eration than th es GA differe rossover. It fi m places unifo ng zero in variance. ance as in osomes in ty that its n in figure he roulette ly used in he current ent from a rst selects ormly and4.7 Mutation Operation
Unlike the process of crossover, the role of mutation is to explore the search space. In other words this operation encourages the search process to go to unknown regions of search space. In this work we have used a traditional mutation operation (Coley 1999; Mitchell 1997). Mutation operation replaces a term of the feature vector that is randomly selected with another randomly selected term from the corpus as shown in figure 4.
4.8 Niche Diversity
In natural ecosystems, there are different niches for different species. These diverse niches are like optimum points in multimodal fitness functions (Beasley et al. 1993). In our feature selection method, the fitness function is multimodal and has some local optimum points. Each vector feature with relatively high MTV value is a local optimum point in the fitness function. There are some solutions for this problem that can be found in (Beasley et al. 1993). Here we have used the “sequential niche” solution. This method involves multiple runs of a GA and in each run a peak is found, selected and then remove from the search space (Beasley et al. 1993). Designed GA has been outlined in algorithm 1.
Figure 4: designed Mutation operation
Oil . Opec . wa . Barrel Select term Oil . Opec . wa . Barrel
Select term from corpus Corpus Price M utation
Oil . Opec . Price . Barrel
Figure 3: designed Crossover operation
Oil . january . opec
Barrel . wa . bring
Create Crossover mask Create Crossover mask
001
011
Cros
so
ver
Oil . january . wa . bring
5 Experimental Results
Our proposed approach has been designed, implemented and tested on Reuters-21578 text collection distribution 1.0 (Reuters 2007). For the preprocessing phase of text clustering, we first extracted words from text and then removed stop words from it. For the stemming task the Porter algorithm has been used (Porter 2007).
FS_GA(Corpus,fitness_th,p,r,m,noi,max_t,FV_length,contain_th,min_l,max_l)
Corpus: Document repository
Fitness_th: Fitness Threshold
p: Population size
r: Crossover rate
m: Mutation rate
noi: number of iterations
max_t: maximum time for evolution phase
FV_length: feature vector length
contain_th: contain threshold
min_l: minimum vector feature length in initial population
max_l: maximum vector feature length in initial population
FeatureV final feature vector
FeatureV = null
While ( Length( FeatureV) < FV_length ) Do {
population = GenerateInitialPopulation(Corpus,p,min_l,max_l) ComputeFitness( population, contain_th )
I = 0
ElapsedTime = 0
While( (Max_Fitness(population)< Fitness_th) AND (ElapsedTime < max_t) AND ( I< noi ) ) {
Select (1-r)*p members of population by roulletewheel selection and Add to newPopulation
Select (r*p)/2 pairs of members of population by roulette wheel selection, apply CrossOver on each pair and add two resulting offsprings to newPopulation
Select m percent of the members of newPopulation with uniform probability and Mutate them. population = newPopualtion ComputeFitness( population ) I = I + 1 Update( ElapsedTime ) } vf = MaxFitnessVectorialFeature( population ) Add to FeatureV All terms in vf.
Delete from Corpus All terms in vf. }
Return FeatureV
In this paper we have compared the traditional TV method and Document Frequency with our GA based method. It is shown in (Liu et al. 2005) that the TV method accuracy is as good as all other traditional unsupervised feature selection methods. We have used a combination of K-means and K-nearest neighbor methods for clustering. Clustering starts with the K-means method; then after clustering some predefined percent of documents (20% in this case) the K-nearest neighbor method is used for the remaining documents. The value of K in the KNN method also increases adaptively based on the percentage of clustered documents. It is worth noticing that the presented clustering methods are used for all feature selection methods and therefore had no impact on comparison. In addition because the k-means method is sensitive to its start point therefore the start point for both text clustering methods is made equal in each experiment. The clustering phase is repeated 10 times for each feature selection method and an average of results is computed to provide a more precise comparison. To evaluate clustering performance we must count how many documents with the same topics are in the same cluster and also how many documents with different topics are in different clusters. For each pair of documents one of these states may hold (Liu et al. 2005):
ss: in our clusters and in the corpus both documents are placed in the same clusters.
sd: in our clusters both documents are placed in the same clusters but in corpus are in different clusters. ds: in our clusters documents placed in different clusters but in the corpus are in the same clusters. dd: in our clusters and in the corpus both documents placed in different clusters.
If the numbers of document pairs in the ss state are represented by a, sd by b, ds by c and dd by d then the average accuracy for Clustering is defined as follows:
1 ( ) 2 a d AverageAccuracy a c b d = × + + +
Another measure for evaluating clustering is the F1-measure with the formula: 2 1 p r F Measure p r × × = + Where p=a ba+ a r a c = +
The maximum values of average accuracy and F1-measure are .5 and 1 respectively. These values could occur when all documents are clustered correctly.
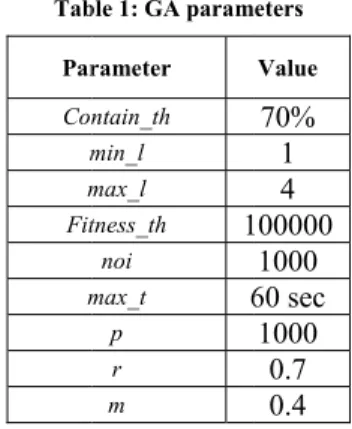
Three methods including Term Variance, Document Frequency and our Modified Term Variance method were implemented and tested on three corpus of Reuters-21578 text collection. DF has been added because it is one of the basic methods. For a more accurate comparison each clustering task was performed 10 times and the results are averaged. The GA parameters have been learnt from experience as is shown in Table 1.
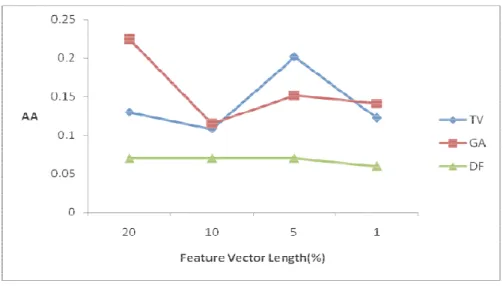
Figure 5 corpus re and Figur As shown ( 20%,10 method f because i
shows the res eut2_001 relat re 9 and Figur
n in Figure 5 0% and 5% o for feature vec it doesn’t cons
sults for corpu tive to F1-mea re 10 shows th
Figure5: our proposed of the length o
ctor with the sider the varia
Figure Tab Par Con m m Fit m us reut2_001 r asure. Similar he results for c Comparison method has b of corpus) on length of 1% ance of terms. e6: Comparis ble 1: GA param rameter ntain_th min_l max_l tness_th 1 noi max_t 6 p r m relative to ave rly Figure 7 an corpus reut2_ of Average A better average n dataset reut2 . It is shown son of F1-Me meters Value 70% 1 4 100000 1000 60 sec 1000 0.7 0.4 rage accuracy nd Figure 8 sh _003. Accuracy on accuracy for 2_001, althou that DF meth easure on reu y. Also Figure how the result
reut2_001 three differen ugh the TV m hod is the wor
ut2_001 e 6 shows the r ts for corpus r nt feature vecto method outperf rse method as results for reut2_002 or lengths forms our s expected
Figure 6 doesn’t t negative our meth Figure7 accuracy vector len However Adding t frequenci Figure8 average a true nega also confirm take into acco
cases) and th hod is more po shows the co y on dataset reu ngth changes. r, the frequenc these terms t ies. Conseque shows that th accuracy. Thi ative cases. In ms the result o ount the num herefore there owerful in find Figure7: omparison of ut2_002. As i . The reason m cies of these t to feature ve ently, with no Figure he F1-Measur is comes from addition, DF of Figure 5 in mber of docum is a slight dif ding true nega
Comparison our proposed it is shown, av may be as foll
terms in the c ector may dis training data e8: Comparis e difference b m the differen method result n terms of F1 ment pairs tha
fference betw ative cases tha
of Average A d method wit verage accurac
ows: some ter corpus are clo srupt the clus calculating th
son of F1-Me between the n nce between F ts are very low
-Measure. Un at are correct
een the two m an the TV meth
Accuracy on th the TV an cy of GA and rms do not de ose to the freq stering task. he optimum len
easure on reu new method a F1-Measure a w but less sen
nlike average tly placed in measures. This hod. reut2_002 d DF method d TV method f efinitely belon quencies of so These terms ngth of featur ut2_002 and the TV m and average a sitive to lengt accuracy, F1 different clus s difference s ds in terms o fluctuates as th ng to a specific ome significan have all the re vector is im method is less accuracy in co th of feature v 1-Measure sters (true hows that of average he feature c concept. nce terms. e possible mpossible. s than the onsidering vector.
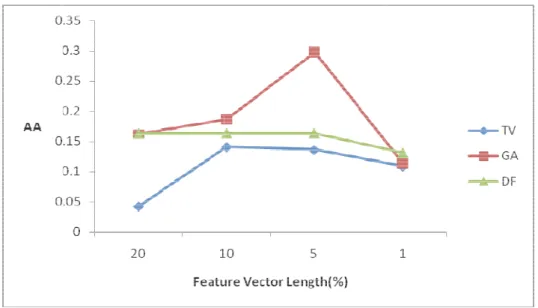
Figure 9 proposed method o feature v In Figure method a worth no though th true nega computat In almost misleads shows the re d method attai outperforms t ector. e10 F1-Measu and TV metho oticing that the he DF method ative cases o tion. t all comparis on terms that Figure9: esult of comp ined the best the conventio
Figure ure of all meth
od have perfo e DF method d has better av on dataset reu sons the DF m t are frequent Comparison arison of the average accu onal TV meth e10: Compari hods are comp ormances near gives a poor verage accura ut2_003 than method got the and at the sam
of Average A three method uracy of all fo hod in terms
ison of F1-Me pared for data
r to each othe F1-Measure r acy. This indic the TV meth e worst result me time spread Accuracy on ds on data set or almost all of average a easure on reu aset reut2_003 er except for result especial cates that the hod but these ts. This is pred d uniformly be reut2_003 t reut2_003. A feature vector accuracy for a ut2_003 3. The results one feature v lly in compari DF method c e cases are i dictable becau etween docum As it is shown r lengths. Als all different l
show that the vector length ison to the TV ould detect m gnored in F1 use DF metho ments
.
n the new so the DF lengths of e new GA (5%). It’s V method, much more 1-Measure od usuallyIt is shown that the new method can reach better average accuracy and F1-Measure than TV and DF method in almost all points, although for a few feature vector lengths, the TV method outperformed our method. We have repeated the experiments 10 times and for three different corpuses; so that although the difference between our method and the TV method may not seem great, it proves that our method overall can reach better results than the TV method which is one of the most powerful methods in clustering as it is declared in (Liu et al. 2005). The other interesting finding is that on average, half of the terms in feature vectors that were acquired by the new method and the TV method were different from each other. This shows that the new method can find and select new terms that are overlooked by the TV method. These terms have low term variance but when placed near another terms make vector features with high variances - and that it was our major motivation for devising this method.
As we expected any vector feature that came out from the GA contained terms belonged to the same concept. An example of a vector feature could be:
(Bank,USA, billion,loan,sale,hongkong,earn,store,expect)
In other words our method handles polysemy and synonymy automatically by grouping all terms belong to a concept.
The major weakness of the proposed method is that it is time-consuming. Using a GA for finding the most fit groups of terms is a time-consuming task. Finding feature vectors for clustering usually is an offline task, therefore the additional time imposed by the proposed method is not prohibitive. It is worth noticing that our method will automatically converge to the conventional TV method by finding one-term groups if TV can gain better results; but it will take much time for the GA and in our empirical results we have placed a time limit on GA.
6 Conclusions and Future works
In this paper a new method is presented based on using a GA for the unsupervised feature selection phase in a text clustering task. In our approach groups of terms are processed while in existing traditional methods each term is processed individually. We also presented a new Modified Term Variance measure for evaluating groups of terms in vector feature form. A GA based technique has been designed and implemented for finding vector features with high MTV and a sequential niche method combined with GA used for generating a final feature vector.
The result was that our method can find some terms neglected by the traditional TV method that can improve the clustering result. By comparing our proposed method with TV and DF methods on three corpus of Reuters-21578 text collection it has been shown that our method outperforms existing methods on average accuracy and F1-Measure for almost all feature vector lengths. This proves that the feature selection method presented can find terms with higher discriminative power than the TV method.
The future work will be:
1. As is shown in the experiments, the accuracy of the methods are not similar for different feature vector lengths. This fact holds for all feature selection methods. We can find some feature vectors with different length in our method and then do text clustering based on those feature vectors separately and finally make a voting between results for each document. This solution can resolve the overfitting problem and at the same time maintain accuracy.
2. We have used a concept called “contain Threshold” for defining the presence of a vector feature in a text. It indicates what percentage of terms of a vector feature must be in a document for it to be considered in that document. If this threshold is defined based on fuzzy sets theory, we may see better results.
Acknowledgements
We thank Pete Blindell for proofreading the manuscript.
References
Bao J, Shen J, Liu X, Song Q (2003) A new text feature extraction model and its application in document copy detection. In: Proceedings of the second international conference on machine learning and cybernetics. IEEE. pp 82-87
Basu A, Watters C, Shepherd M (2002) Support vector machines for text categorization. In: Proceedings of the 36th Hawaii international conference on system sciences. IEEE
Beasley D, Bull D, Martin R (1993) A sequential niche technique for multimodal function optimization. Evolutionary Computation Journal. pp 101-105
Buddeewong S,Worapoj K (2005) A new association rule-based text classifier algorithm. In: Proceedings of the 17th IEEE international conference on tools with artificial intelligence. pp 684-685
Coley D (1999) An introduction to genetic algorithms for scientists and engineers. World scientific.
Goldberg D (1989) Genetic Algorithms in Search, Optimization and Machine Learning. Kluwer Academic Publishers.
Hung C, Wermter S (2003) A dynamic adaptive self-organising hybrid model for text clustering. In: Proceedings of the third IEEE international conference on data mining (ICDM’03). pp 75-83
Jain G, Ginwala A, Aslandogan Y (2004) An approach to text classification using dimensionality reduction and combination of classifiers. In: Proceedings of the IEEE international conference on information reuse and integration (IRI). pp 564-569
Kuntraruk J, Pottenger M (2001) Massively parallel distributed feature extraction in textual data mining using HDDI. In: Proceedings of the 10th IEEE international symposium on high performance distributed computing. pp 363-370
Lee C, Yang H, Ma S (2006) A novel multilingual text categorization system using latent semantic indexing. In: Proceedings of the first international conference on innovative computing, information and control. IEEE Liu L, Kang J, YU J, Wang Z (2005) A comparative study on unsupervised feature selection methods for text
Clustering. In: Proceeding of NLP-KE. Vol. 9, pp 597-601
Massey L (2005) Real-world text clustering with adaptive resonance theory neural networks. In: Proceedings of IEEE international joint conference on neural networks (IJCNN’05) 5:2748-2753
Miller T (2005), Data and text mining a business applications approach. Prentice Hall, New York. Mitchell T (1997) Machine Learning. McGraw-Hill, Washington
Prabowo R, Thelwall M (2006) A comparison of feature selection methods for an evolving RSS feed corpus. In: Information processing and management J 42:1491-1512
Porter algorithm, http://tartarus.org/~martin/PorterStemmer, cited on 2007
Reuters-21578 text collection, http://kdd.ics.uci.edu/databases/reuters21578/reuters21578.html, cited on 2007 Shang W, Qu Y, Haiban Z, Houkuan H, Yongmin L, Hongbin D (2006) An adaptive fuzzy knn text classifier
based on gini index weight. In: Proceedings of the 11th IEEE international symposium computers and computers and communications (ISCC’06)
Song W, Park S (2006) Genetic algorithm-based text clustering technique: automatic evolution of clusters with high efficiency. In: Proceedings of the seventh international conference on Web-Age information management workshops (WAIMW). pp 17-25
Song, W, Park S (2009) Genetic algorithm for text clustering based on latent semantic indexing. Computers & Mathematics with Applications, 57(11-12): pp 1901-1907.
Sullivan, D., Document warehousing and text Mining, John Wiley, New York, 2001.
Sun F,Sun M (2005) A new transductive support vector machine approach to text categorization. In: Proceedings of NLP-KE. IEEE, pp 631-635
Wang B, Zhang S (2005) A novel text classification algorithm based on naïve bayes and KL-divergence. In: Proceedings of the sixth international conference on parallel and distributed computing, applications and technologies (PDCAT’05). IEEE
XU J, Wang Z (2004) A new method of text categorization based on PA and kohonen network. In: Proceedings of third international conference on machine learning and cybernetics, Shanghai, pp 1324-1328
Yang S, Wu X, Deng Z, Zhang M, Yang D (2002) Relative term-frequency based feature selection for text categorization. In: Proceedings of the first international conference on machine learning and cybernetics, Beijing. IEEE. pp 1432-1436
Yang Y, Pedersen J (1997) A comparative study on feature selection in text categorization. In: Proceedings of ICML-97, 14th international conference on machine learning. pp 412-420