ISSN: 2088-8708, DOI: 10.11591/ijece.v9i5.pp3872-3879 3872
Student risk identification learning model
using machine learning approach
Susheelamma K H, K M RavikumarS J C Institute of Technology, India
Article Info ABSTRACT
Article history: Received Nov 19, 2018 Revised Apr 12, 2019 Accepted Apr 25, 2019
Several challenges are associated with online based learning systems, the most important of which is the lack of student motivation in various course materials and for various course activities. Further, it is important to identify student who are at risk of failing to complete the course on time. The existing models applied machine learning approach for solving it. However, these models are not efficient as they are trained using legacy data and also failed to address imbalanced data issues for both training and testing the classification approach. Further, they are not efficient for classifying new courses. For overcoming these research challenges, this work presented a novel design by training the learning model for identifying risk using current courses. Further, we present an XGBoost classification algorithm that can classify risk for new courses. Experiments are conducted to evaluate performance of proposed model. The outcome shows the proposed model attain significant performance over stat-of-art model in terms of ROC, F-measure, Precision and Recall.
Keywords: Classification Imbalanced data Machine learning
Virtual learning environment
Copyright © 2019Institute of Advanced Engineering and Science. All rights reserved. Corresponding Author:
Susheelamma K H,
Department of Information science and Engineering, S J C Institute of Technology,
Chickballapur-562101, India. Email: [email protected]
1. INTRODUCTION
Online based learning system has become generic platform in education and can take many forms, from learning management system (LMS) to virtual learning environment (VLE) and massive open online courses (MOOCs). In MOOCs, students can learn anytime and from any location [1]. MOOCs offers an innovative way to train students, change the state-of-art method to learning, and attract students from around the globe. The well-known platforms are Coursera, Harvard, and Edx. Moreover, MOOCs have contributed to higher education [2]. In MOOCs and other online based learning systems, students often enroll themselves to download materials and videos but do not finish the complete course. As a result, the total number of activities a student engages in falls below the recommended threshold [3]. Therefore, teachers must understand the engagement of their students.
In the state-of-art method to education, trainers take various measures to assess students’ levels of performance, motivation, and engagement [4], such as checking student attendance, conducting exams, and monitoring studying via CCTV cameras. However, in online based learning system there are no face-to-face meetings, and it is challenging to determine student engagement levels in online activities such as watching videos or participating in discussion forums. Therefore, in online based learning systems, student data represent the only source of information through which trainers can assess student performance and engagement. Due to the absence of face-to-face meetings, online based learning systems face some challenges that need to be addressed. The first and most important is course drop out. Student dropout is an important problem across various levels such primary school, higher secondary, graduation level and the scenario is
much worse in MOOCs. As per the research conducted in [5, 6], the number of student not completing graduation in USA is 20% and in Europe it is around 20% to 50% fail to finish their studies on time [7]. For online or distance education, these statistics are even worse with 78% of students not completing the graduation [8]. Further, it gets even worse for student who gets registered with MOOCs, the percentage of student who enrolled and successfully finished the course is only 5% as reported in [9] or 15% as reported in [10]. The issues of identifying student that are expected to fail the course has been extensively analyzed across various research community in recent times [11-13]. It was also a major subject of the KDD'CUP 2015 competition that mainly aimed on forecasting student withdrawing from online courses.
Establishing student, who are at chance or risk of withdrawing or failing from their respective course, is the initial step towards provisioning them with remedial (material) support. Generally, supportive measures are carried out by instructor/professor, who obtains the information/outcome of forecasting [11, 12]. In other way, the forecasting model may build email messages that communicate directly to the student [14]. The preliminary objective is to enhance the student learning, to keep student engaged in course, and aid them completing the research or study programs.
In distance or online courses, most materials are delivered through Virtual Learning Environment (VLE). In VLE each action are recorder and stored. Along with, student information such as assessment, task results, and demographic information, etc. are also kept. These data are cleansed and ML is applied to build a forecasting/predictive model. These models are then used to offer online course provider to forecast student at-risk of completing it on time. A generic way of building a predictive model is to train the models using legacy data from a history or previous task submitted information of the course [12]. Further, it is applied to the present presentation. However, adopting these methods will not be efficient when applied to new type of courses that has no history. For such case, it is important to find new solution.
From extensive survey carried out by MOOCs [15] and Higher Education (HE) courses [12] shows that the highest amount of dropout occurs during first year’s courses, and many student dropout even within a month/first few weeks of the course presentation. The cause may be also due to fee payment toward courses. Therefore, the objective is to establish or find student who are at-risk of dropping out or failing to complete on time as early as possible. It must also be noted that the same behavior or pattern may not be same across different university/education institution or course design, rapid student dropping out of course may also arise in late stage of course [13].
Further, number of Machine learning based technique is widely applied and used across various state-of-art models [16-25] for identifying risk of student failing to complete course on time. The basic conception is to utilize legacy data to learn the forecasting models and to utilize these approaches to perform forecasting on current courses. The data can aid the course provider who is aiming to address or build policies to enhance the student performance (student retention rate) and student dropping out of courses or failing to finish on time. In [16], the approaches for finding failure or success of student were trained using data of their prior study result. It can be seen that forecasting failure for the first term of courses is very important, since the dropout rate is generally higher but with suitable policies or strategies (help) many student can be saved [23]. Behavior of students [24, 25] in the VLE can be used to construct forecasting models for online courses. These could be just simple summary statistics [19]. When neither the students virtual learning environment activities nor the student prior study results are available, demographic information can be used as the major foundation of information [20].
Many approached [11, 26, 27] for solving problem of classification with presence of imbalanced data in forecasting or identifying student at-risk of failing. However, they neglected student who haven’t shown any interest in performing tasks and only focused on active students. For overcoming research challenges this work, this work aimed at designing a forecasting model that identify student at-risk of failing or completing course on time by presenting a novel XGBoost classification model.
The proposed learning model is constructed using state-of-art models at the OU [17, 21-23]. Initially, using decision tree that is trained using data labeling student behavior in the virtual learning environment complemented by the scores of the past assessments/tasks [21]. Further, [22] used demographic features for enriching the input data for training model. The significant discovery in [23] was the prominence of the early establishment or finding of students at risk, even prior to the first task/assessment in the course. The students who do not submit or fail to complete the assessment are very likely to fail or withdraw the entire course. Further, the primary reasons to use this algorithm are its accuracy, efficiency, and feasibility. It’s a linear model and a tree learningalgorithm that does parallel computations on a single machine. It also has extra features for doing cross validation and computing feature importance. Below are some of the main features of the model:
− Sparsity: It accepts sparse input for tree booster and linear booster. − Customization: It supports customized objective and evaluation functions.
The contribution of work is as follows
− Presenting an XGBoost classification model for identifying student risk of failure. − The XGBoost can be used as both binary classifier as well as multi-level classifier.
− The proposed model addresses imbalanced data issue and also can forecast risk for new course that have no history.
− Our model attains good speed and accuracy performance when compared with state-of-art model. − Experiment outcome shows good performance in terms of ROC, F-measure, and precision and recall.
The paper is organized as follows: In section 2 the proposed student risk identification model using XGBoost algorithm is presented. Experimental studies are discussed in section 3. Finally section 4 the paper is concluded and future work of research is described.
2. RESEARCH METHOD – STUDENT RISK IDENTIFICATION LEARNING MODEL USING XGBOOST CLASSIFICATION ALGORITHM
This paper present a novel learning design that use data from running presentation for training forecasting model. The fundamental objectives is to use the information of students who have already completed and submitted the future task and analyze the behavior pattern of the students who are at risk of failing to submit the assignment. It is assumed that the behavior pattern of student who are about to submit are expected to follow identical behavior pattern as those who already completed and submitted the task similarly, the behavior pattern will different for student who don’t complete or submit their task. Number of machine learning based classification model is available to utilize and attain efficient learning model. However, in this work, we present a classification model as a binary classification problem. However, it can work even for solving multi-label classification problem. That is, for a given day (present), which is 𝑘 days before deadline data, the objective of this work is to build a binary classification algorithm that forecast whether the student will submit the assignment or not on/before time (i.e., within the future 𝑘 days). If 𝑘 = 0, forecasting are done on the deadline day. Only students that are enrolled in course and haven’t finished the task yet are considered for the forecasting.
2.1. System model
Let’s consider the deadline data and the date when the forecasting is done, which is 𝑘 days prior to the deadline day, as forecasting date. For able to construct a forecasting model for period [forecasting date; deadline date] such that 𝑑 deadline date is equal to forecasting date. The 𝑘 forecasting date and 𝑑 deadline day can be established as a template forecasting and deadline days, respectively. Here, the deadline is within three days from the present day and we want to forecast if set of student submit their assessment or task either today or within next 5 days. The information for the present day are inaccessible, so the training data will come from the days [presentation initilaizaed+5] = 10 with the labels of submission in [present+4; present + 1] = [9; 6]. It shows the virtual view of the days for training and testing data, day=0 depicts the present day, negative keys shows to known information and positive keys to new/unknown data. This aids, that we have more days vacant when applying the forecasting model, some previous/older days cannot be utilized as they were not present in training stage.
2.2. Window tradeoff and feature selection model for learning
Based on system model described, using long-term history means the window sampling for labels is growing. The more days prior to the deadline date, the more days is required for training labels. The condition for the present day being 0 to 5 days prior to the deadline date. For 𝑘 days prior to the deadline, the size of the window for both training and testing labels will be 𝑘 + 1. The data available for efficient learning is composed of information such as activities and demographics in the virtual learning environment. For extensive analysis this work carried out, it can be seen the demographic data is static in nature, it is important to carryout transformation of these information, such as standardization for numerical data and vectorization of categorical data. Similarly, the virtual learning environment data are generally are composed of very rich information such as daily click events clustered by precise action, i.e., student 𝑋 has viewed 15 times a particular document or presentation research material. All the events/actions are clustered into actions types such as video, resources, blogs, etc. For a given day (present) when the algorithm (model) is learned, the virtual learning environment features are aligned in reverse with respect to time on particular days, i.e., day 0 is the present day, day 1 is depicted as yesterday and so on. The oldest day utilized for training is the day that the course is initialized. In addition to virtual learning environment daily counts, it’s likely to obtain various statistical information of student behavior pattern in the virtual learning environment, such as the how long (days) a student is active in the virtual learning environment (i.e., when a person (student) has last accessed or has logged in).
2.3. Addressing Imbalanced data problem in classification
The Machine Learning (ML) algorithms are generally modelled to learn objective parameter from data when the classes in the training information are balanced. However, considering real-world environment, the data are generally imbalanced (i.e., some classes data will have significantly less data than other classes). As a result, the state-of-art algorithm [28-32] performs very poor in identifying probability of risk of failure of student that has been modelled so far [14]. For addressing the problem of imbalanced data the following two stages must be considered such as: a) Algorithm stage: on-class or linear classification models, cost-sensitive learning, and various kind of ensemble algorithm model are some of the designs that are generally used; b) Data stage: by applying sampling window for modifying the class label distribution in such way the training data becomes more balanced. The key functionality of cost-sensitive based learning model is to penalize the cost parameter error on marginal class variable during training stage, which is done by using a cost matrix. However, for attaining fine-grained binary classification model it is better to fix the weight parameter for minority classes (i.e., by considering weight of majority class will be 1). Further, number of approached [11, 26], and [27] for solving problem of classification with presence of imbalanced data in forecasting or identifying student at-risk of failing. However, they neglected student who haven’t shown any interest in performing tasks and only focused on active students.
2.4. Forecasting using XGBoost learning model
For training the learning algorithms and for evaluation of our model, this work conducted survey of various exiting machine learning based classification models such as logistic regression, Naive Bayes, Support Vector Machine, Tree Boosting, Random Forest and so on. However, these models are not efficient when the data is linearly non-separable. As a result, incur degradation in accuracy of classification performance. Further, very few algorithm provision probabilistic forecasting. As this aids in ordering students based on their likeliness to fail, and then use the resources constraint.
For overcoming research challenges, this work present XGBoost classification algorithm for identifying student that fail to complete the course on time. XGBoost is robust and scalable ML model for tree boosting that is developed in [35]. Gradient boosting is the base learning models of XGBoost classification algorithm, which combines weaker base learning model into a stronger learning model in an iterative manner [36]. For each iteration step of gradient boosting, the residual will be utilized to optimize the preceding forecaster that the defined loss parameter can be optimized. Further, for enhancing performance, regularization function is added to loss function to obtain the objective outcome in XGBoost. Measuring the algorithm performance can be obtained as follows
𝐾(𝒜) = 𝑀(𝒜) + 𝛽(𝒜) (1)
The variable trained from input dataset are depicted as 𝒜, 𝑀 is the training loss parameter, such as logistic or square loss, which measure how good the algorithm fits for particular training dataset, and 𝛽 is the regularization parameter, that measure the complexity of the algorithm. Naiver model is expected to have better outcome against overfitting as the base model is decision tree. The outcome of algorithm 𝑧̅𝑗 is averaged
or voted collection of 𝐺 of 𝑙 trees, which can be expressed as follows 𝑧̅𝑗= ∑𝑙 𝑔𝑙(𝑦𝑗), 𝑔𝑙∈ 𝐺.
𝑗=1 (2)
Objective parameter at 𝑢𝑡ℎ instance iteration can be established into
𝐾(𝑢)= ∑ 𝑀(𝑦
𝑗, 𝑧̅𝑗) + ∑𝑢𝑙=1𝛽(𝑔𝑙), 𝑜
𝑗=1 (3)
Where 𝑜 is the amount of forecasting. In this work, the 𝑧̅𝑗(𝑢) can be expressed as follows
𝑧̅𝑗(𝑢)= ∑𝑢𝑙=1𝑔𝑙(𝑦𝑗) =𝑧̅𝑗(𝑢−1)+ 𝑔𝑢(𝑦𝑗). (4)
As described in [35], the regularization parameter 𝛽(𝑔𝑙) for any DT is described as follows 𝛽(𝑔𝑙) = 𝛼𝑈 +1
2𝜇 ∑ 𝑥𝑘 2, 𝑈
𝑘=1 (5)
Where 𝛼 depicts complexity of each and every leaf, 𝜇 is a variable to increase penalty, and 𝑈 is the amount of leaves in a Decision Tree (DT), and 𝑥 is the vector of scores on each leaf. Then, it uses second-order Taylor expansion, rather than first-second-order in gradient boosting, which is used as a loss parameter in
XGBoost. Further, it is considered that the loss parameter is mean square error, the objective strategy can be expressed as follows 𝐾(𝑢)≈ ∑ [ℎ 𝑗𝑥𝑟(𝑦𝑗)+ 𝑖𝑗𝑥𝑟(𝑦𝑗) 2 ] + 𝛼𝑈 + 𝑜 𝑗=1 1 2𝜇 ∑ 𝑥𝑘 2, 𝑈 𝑘=1 (6)
By removing the constant the 𝑟(. ) is a function that assign data point with respect to leaf, ℎ𝑗 is the first derivative of mean square error loss function and 𝑖𝑗 is the second derivative of mean square error loss function. In above equation (6), the loss function is computed by summing the loss of each data features. This is done as each data feature corresponds to only one leaf node at a time. Therefore, the loss function is computed as a sum of loss of each and every leaf node as follows
𝐾(𝑢)≈ ∑ [(∑ ℎ 𝑗 𝑗∈𝐽𝑘 )𝑤𝑘+ 1 2(∑𝑗∈𝐽𝑘𝑖𝑗+𝜇)𝑥𝑘 2] + 𝛼𝑈. 𝑈 𝑗=1 (7)
According to above equation (7), 𝐻𝑘 can be computed as follows
𝐻𝑘= ∑𝑗∈𝐽𝑘ℎ𝑗, (8)
Similarly using Eq. (7), 𝐼𝑘 can be computed as follows
𝐼𝑘 = ∑𝑗∈𝐽𝑘𝑖𝑗 (9)
Where 𝐼𝑘 depicts entire data feature sets in leaf node 𝑘. Therefore, the optimization of objective strategy can be optimized into a problem of establishing minimum of a quadratic function. In other way, post completion splitting of certain node in DT, the optimization of algorithm outcome can be computed using objective strategy. If the DT algorithm outcome is improved post completion of splitting the node, this optimization will be used. Or else, the splitting process will be terminated. Along with, when performing optimization, the objective strategy, a forecasting classification model can be trained against overfitting due to regularization. The proposed classifier attain a significant classification performance when compared with state-of-art model which is experimentally proved in next section below.
3. RESULTS AND DISCUSSIONS
This section evaluates performance evaluation of proposed student risk identification learning model over state-of-art models [29, 33, 34]. For experiment analysis various experiment are considered and data used for experiments are publically available. The experiment is conducted using windows 10 operating system, Intel I-5 class 64 bit processor, 16 GB RAM, 4GB Nvidia CUDA enabled GPU. For experiment analysis this work used publicly available dataset obtained from OULAD [33, 34] which composed of different courses with student enrollment around 1200 to 2500. The objective of this work is to forecast the submission of first assessment of a particular course within deadline time around 20 to 30 days. The course is composed of wide variety of fields such as maths, history, engineering and so on. For completing the course, the student has to attain some minimum scores for a given task or assessment and then pass the final exam. The proposed student risk learning model for forecasting dropout has been aimed at attaining following objectives, Firstly, carryout analysis daily using ML algorithm to evaluate classification model. Secondly, analyses and identifies the effects and problems of imbalanced data. Then, compare our proposed model over state-of-art model trained using legacy data. Fourthly, experiment is conducted for different 𝑘 and courses and evaluate performance attained by proposed model over existing model in terms of precision, recall, F-measure, and ROC. Experiment are conducted to evaluate ROC performance attained by proposed XGBoost over exiting Support Vector Machine (SVM) as shown in Fig. 1. The outcome shows XGBoost attain an ROC performance improvement of 35.33% over SVM. Further, Figure 2 shows F-measure attained by both proposed and existing model. The overall result attained shows proposed learning model improves F-measure score by 24.45%, 26.65%, and 18.96% over existing learning model. An average improvement of 23.35% is attained by proposed learning model over existing model.
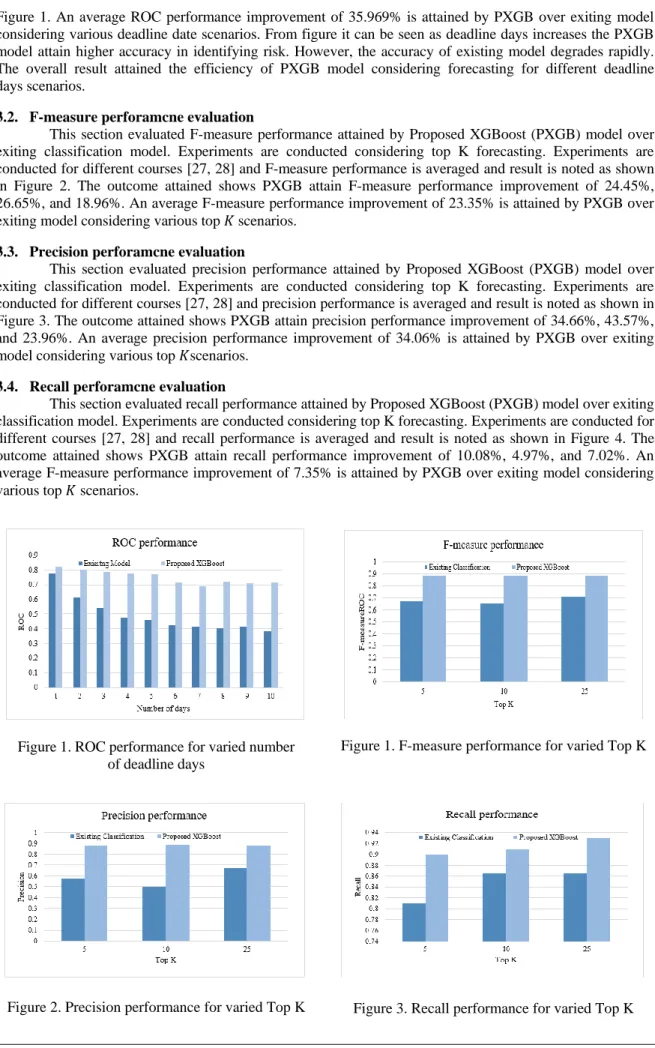
3.1. ROC perforamcne evaluation
This section evaluated ROC performance attained by Proposed XGBoost (PXGB) model over exiting classification model. Experiments are conducted considering different deadline days. Experiments are conducted for different course [27, 28] and ROC performance is averaged and result is noted as shown in
Figure 1. An average ROC performance improvement of 35.969% is attained by PXGB over exiting model considering various deadline date scenarios. From figure it can be seen as deadline days increases the PXGB model attain higher accuracy in identifying risk. However, the accuracy of existing model degrades rapidly. The overall result attained the efficiency of PXGB model considering forecasting for different deadline days scenarios.
3.2. F-measure perforamcne evaluation
This section evaluated F-measure performance attained by Proposed XGBoost (PXGB) model over exiting classification model. Experiments are conducted considering top K forecasting. Experiments are conducted for different courses [27, 28] and F-measure performance is averaged and result is noted as shown in Figure 2. The outcome attained shows PXGB attain F-measure performance improvement of 24.45%, 26.65%, and 18.96%. An average F-measure performance improvement of 23.35% is attained by PXGB over exiting model considering various top 𝐾 scenarios.
3.3. Precision perforamcne evaluation
This section evaluated precision performance attained by Proposed XGBoost (PXGB) model over exiting classification model. Experiments are conducted considering top K forecasting. Experiments are conducted for different courses [27, 28] and precision performance is averaged and result is noted as shown in Figure 3. The outcome attained shows PXGB attain precision performance improvement of 34.66%, 43.57%, and 23.96%. An average precision performance improvement of 34.06% is attained by PXGB over exiting model considering various top 𝐾scenarios.
3.4. Recall perforamcne evaluation
This section evaluated recall performance attained by Proposed XGBoost (PXGB) model over exiting classification model. Experiments are conducted considering top K forecasting. Experiments are conducted for different courses [27, 28] and recall performance is averaged and result is noted as shown in Figure 4. The outcome attained shows PXGB attain recall performance improvement of 10.08%, 4.97%, and 7.02%. An average F-measure performance improvement of 7.35% is attained by PXGB over exiting model considering various top 𝐾 scenarios.
Figure 1. ROC performance for varied number of deadline days
Figure 1. F-measure performance for varied Top K
4. CONCLUSION
This manuscript introduced a novel design for early finding of student who are at risk of failing or completing the course on time without using legacy data. The proposed model uses the significance factor of first task being important factor in the progress of course work. The best way is to extract the student behaviour who already submitted their task and learn its pattern. This work defines the problem as a binary classification task with objective to learn and forecast daily using forecasting window. The proposed model is evaluated using publicly available OULAD dataset. The outcome shows the proposed model predicts accurately even for early day (i.e. for 0 and 1 days), also predicts efficiently for later days of course completion, and attain better outcome than training using legacy data. From overall experiment analysis, it can be seen feature selection VLE is important for forecasting student at risk of failing. The proposed XGBoost based classification model attains good recall, precision, ROC and F-measure performance. An average ROC performance improvement of 35.97% is attained by PXGB over existing model. Further, an average F-measure performance improvement of 23.35% is attained by PXGB model over existing model. Then, an average precision and recall performance improvement of 34.06%, and 7.35% is attained by PXGB model over existing model, respectively. The overall result attained shows the proposed model efficiency of PXGB model considering forecasting for different deadline days and Top 𝐾scenarios.The future work we would consider experiment analysis considering different dataset and also consider enhancing forecasting model.
REFERENCES
[1] Fetty FitriyantiLubis, YusepRosmansyah, Suhono H. Supangkat, “Topic discovery of online course reviews using LDA with leveraging reviews helpfulness”, International Journal of Electrical and Computer Engineering (IJECE) Vol. 9, No. 1, pp. 426-438,pp. 426-438, 2019.
[2] M. I. Olazabalaga, C. C. Garrido, and G. U. Ruiz, “Research on MOOCs: trends and methodologies,” Porta Linguarum, pp. 87–98, 2016.
[3] C. Ye and G. Biswas, “Early prediction of student dropout and performance in MOOCs using higher granularity temporal information,” Journal of Learning Analytics, vol. 1, no. 3, pp. 169–172, 2014.
[4] J. Mutahi, A. Kinai, N. Bore, A. Diriye, and K. Weldemariam, “Studying engagement and performance with learning technology in an African classroom,” in Proceedings of Seventh International Learning Analytics & Knowledge Conference, pp. 148–152, Vancouver, BC, Canada, March 2017.
[5] Peter J. Quinn. “Drop-out and completion in higher education in europe among students from under-represented groups.”Technical report, European Commission, Oct 2013.
[6] H. Vossensteyn, A. Kottmann, B. Jongbloed, and F. “Kaiser. Drop-out and completion in higher education in europe executive summary”. Technical report, European Commission, 2015.
[7] G. Kena, J. W. X. R. A. Musu-Gillette, Laurenand Robinson, J. Zhang, S. Wilkinson-Flicker, A. Barmer, and E. D. V. Velez. “The condition of education” 2015. Technical Report 2015-144, NCES, May 2015.
[8] O. Simpson. 22% - “can we do better?” In The CWP Retention Literature Review, 47, 2010.
[9] K. Jordan. Mooc completion rates: The data. http://www.katyjordan.com/MOOCproject.html, 2015. Accessed: 2017-10-10.
[10] D. Koller, A. Ng, C. Do, and Z. Chen. “Retention and intention in massive open online courses: In depth.” EDUCAUSE, http://www.educause.edu/ero/article/retention-and-intention-massive-open-online-courses-depth-0, Jun 2013.
[11] S. M. Jayaprakash, E. W. Moody, E. J. M. Lauria, J. R. Regan, and J. D. Baron. “Early Alert of Academically At-Risk Students: An Open Source Analytics Initiative.”Journal of Learning Analytics, vol 1, no. 1, pp. 6-47, 2014. [12] A. Wol_, Z. Zdrahal, D. Herrmannova, J. Kuzilek, and M. Hlosta. “Developing predictive models for early
detection of at-risk students on distance learning modules.” In Machine Learning and Learning Analytics workshop at LAK14, 24-28 March 2014, Indianapolis, Indiana, USA, 4, 2014.
[13] H. He and E. A. Garcia. “Learning from imbalanced data.”IEEE Trans. on Knowl. and Data Eng., vol 21, no. 9, pp. 1263-1284, Sep 2009.
[14] M. Kloft, F. Stiehler, Z. Zheng, and N. Pinkwart. “Predicting mooc dropout over weeks using machine learning methods.” In Proceedings of the EMNLP 2014 Workshop on Analysis of Large Scale Social Interaction in MOOCs, pp. 60-65, 2014.
[15] C. Taylor, K. Veeramachaneni, and U. O'Reilly. “Likely to stop? predicting stopout in massive open online courses”. CoRR, abs/1408.3382, 2014.
[16] Md. Armanur Rahman1, J. Hossen2, Venkataseshaiah C3, CK Ho4, Tan Kim Geok5, Aziza Sultana6, Jesmeen M. Z. H.7, Ferdous Hossain8, “A Survey of Machine Learning Techniques for Self-tuning Hadoop Performance,” International Journal of Electrical and Computer Engineering (IJECE), Vol. 8, No. 3, pp. 1854-1862, 2018. [17] Hlosta M. et al., 2014. “Modelling student online behaviour in a virtual learning environment. Indianapolis,” LAK
2014.
[18] Pandey M. & Sharma V. K.,“A Decision Tree Algorithm Pertaining to the Student Performance. Analysis and Prediction.”International Journal of Computer Applications, vol 61, no. 13, pp. 1-5, 2013.
[19] Romero, C., López, M., Luna, J. & Ventura, S.,. “Predicting students' final performance from participation in on-line discussion forums.”Computers & Educaton, Issue 68, pp. 458-472, 2013.
[20] Wladis, C., Hachey, A. C. & Conway, K., 2014. “An investigation of course-level factors as predictors of online STEM course outcomes.”Computers & Education, Issue 77, pp. 145-150.
[21] Wolff, A., Zdrahal, Z., Nikolov, A. & Pantucek, M., 2013. “Improving retention: predicting at-risk students by analysing behaviour in a virtual learning environment.” s.l., LAK 2013.
[22] Wolff, A., Zdrahal, Z., Herrmannova, D. & Knoth, P., 2013. “Predicting student performance from combined data sources. In: A. Peña-Ayala, ed. Educational Data Mining: Applications and Trends.”Verlag: Springer International Publishing, pp. 175-202.
[23] Wolff, A. et al., 2014. “Developing predictive models for early detection of at-risk students on distance learning modules.” Indianapolis, LAK 2014.
[24] Wang, Rui & Chen, Fanglin & Chen, Zhenyu & Li, Tianxing & Harari, Gabriella & Tignor, Stefanie & Zhou, Xia & Ben-Zeev, Dror & T. Campbell, Andrew. “StudentLife: Assessing mental health, academic performance and behavioral trends of college students using smartphones.”UbiComp 2014 - Proceedings of the 2014 ACM International Joint Conference on Pervasive and Ubiquitous Computing. 10.1145/2632048.2632054, 2014. [25] Wang, Rui & Chen, Fanglin & Chen, Zhenyu & Li, Tianxing & Harari, Gabriella & Tignor, Stefanie & Zhou, Xia
& Ben-Zeev, Dror & T. Campbell, Andrew. “StudentLife: Using Smartphones to Assess Mental Health and Academic Performance of College Students.” 7-33. 10.1007/978-3-319-51394-2_2, 2017.
[26] J. He, J. Bailey, B. I. Rubinstein, and R. Zhang. “Identifying at-risk students in massive open online courses,” In AAAI, 1749-1755, 2015.
[27] N. Thai-Nghe, A. Busche, and L. Schmidt-Thieme. “Improving academic performance prediction by dealing with class imbalance.” In Ninth International Conference on Intelligent Systems Design and Applications, ISDA 2009, Pisa, Italy, November 30-December 2, 2009, 878-883, 2009.
[28] C. Ye and G. Biswas. “Early prediction of student dropout and performance in moocs using higher granularity temporal information.”Journal of Learning Analytics, vol. 1, no. 3, pp. 169-172, 2014.
[29] H. Lakkaraju, E. Aguiar, C. Shan, D. Miller, N. Bhanpuri, R. Ghani, and K. L. Addison. “A machine learning framework to identify students at risk of adverse academic outcomes.” 1909-1918, 2015.
[30] E. Aguiar, H. Lakkaraju, N. Bhanpuri, D. Miller, B. Yuhas, and K. L. Addison. “Who, when, and why: A machine learning approach to prioritizing students at risk of not graduating high school on time.” In LAK '15, 93-102, New York, NY, USA, 2015. ACM.
[31] J. Bainbridge, J. Melitski, A. Zahradnik, E. Lauria a, S. M. Jayaprakash, and J. Baron. “Using Learning Analytics to Predict At-Risk Students in Online Graduate Public Affairs and Administration Education.”The JPAE Messenger, vol. 21, no. 2, pp. 247-262, 2015.
[32] S. Jiang, M. Warschauer, A. E. Williams, D. ODowd, and K. Schenke. “Predicting mooc performance with week 1 behavior.” In EDM14, 273-275, 2014.
[33] Kuzilek, M. Hlosta, and Z. Zdrahal. “Open university learning analytics dataset.” In Data literacy for Learning Analytics workshop at LAK16, 26th April 2016, Edinburgh, UK, 9, 2016.
[34] Kuzilek, Jakub; Hlosta, Martin and Zdráhal, Zdenek. (2017). “Open University Learning Analytics dataset.”ScientificData. 4. 170171. 10.1038/sdata.2017.171.
[35] T.Q. Chen, C. Guestrin, “XGBoost: a scalable tree boosting system”, Proceedings of the 22nd ACM SIGKDD International Conference on Knowledge Discovery and Data Mining, pp. 785-794, 2016.
[36] J. H. Friedman, “Greedy function approximation: a gradient boosting machine,” Annals of statistics, pp. 1189-1232, 2001.