by
Henintsoa Onivola Minoarivelo
Thesis presented in partial fullment of the requirements for
the degree of Master of Science at Stellenbosch University
Department of Mathematical Sciences, Computer Science Division,
University of Stellenbosch,
Private Bag X1, Matieland 7602, South Africa.
Supervisor:
Prof Konrad Sheer
Co-Supervisor:Dr Cang Hui
Declaration
By submitting this thesis electronically, I declare that the entirety of the work contained therein is my own, original work, that I am the owner of the copyright thereof (unless to the extent explicitly otherwise stated) and that I have not previously in its entirety or in part submitted it for obtaining any qualication.
Signature: . . . . H. O. Minoarivelo
September 15, 2011
Date: . . . .
Copyright © 2011 Stellenbosch University All rights reserved.
Abstract
Probabilistic Modelling of the Evolution of Ecological Interaction
Networks
H. O. Minoarivelo
Department of Mathematical Sciences, Computer Science Division,
University of Stellenbosch,
Private Bag X1, Matieland 7602, South Africa.
Thesis: MSc September 2011
In any ecological system, organisms need to interact with each other for their survival. Such interactions form ecological networks which are usually very complex. Nevertheless, they exhibit well dened patterns; these regularities are often interpreted as products of mean-ingful ecological processes. As the networks are evolving through time, biological evolution is one of the factors that aects ecological network architecture. In this work, we develop a mathematical model that represents the evolution through time of such ecological interaction networks. The problem is approached by modelling network evolution as a continuous time Markov process, in such a way that the interactions in which a parent species is involved are potentially inherited by its descendant species. This approach allows us to infer eco-logical parameters and ecoeco-logical network histories from real-world network data, as well as to simulate ecological networks under our model. While ecologists have long been aware of the inuence of evolutionary processes in shaping ecological networks, we are now able to evaluate the importance of such inuence.
Uittreksel
Probabilistic Modelling of the Evolution of Ecological Interaction
Networks
(Probabilistiese Modellering van die Ewolusie van Ekologiese
Interaksienetwerke )
H. O. Minoarivelo
Departement Wiskundige Wetenskappe, Afdeling Rekenaarwetenskap, Universiteit van Stellenbosch,
Privaatsak X1, Matieland 7602, Suid Afrika.
Tesis: MSc September 2011
In enige ekologiese stelsel benodig organismes wisselwerkings met mekaar ten einde te oor-leef. Sulke interaksies vorm ekologiese netwerke wat gewoonlik baie kompleks is maar nogtans goed-gedenieerde patrone vertoon. Hierdie patrone word dikwels geïnterpreteer as die pro-duk van betekenisvolle ekologiese prosesse. Aangesien die netwerke met die verloop van tyd ontwikkel, is biologiese ewolusie een van die faktore wat ekologiese netwerkargitektuur beïnvloed. In hierdie studie ontwikkel ons 'n wiskundige model wat die ewolusie van sulke ekologiese interaksienetwerke voorstel. Die probleem word benader deur netwerkewolusie as 'n kontinue-tyd Markov-proses te modelleer, op so 'n manier dat die interaksies waarin 'n voorouerspesie betrokke is potensieel oorerf kan word deur die afstammelingspesies. Hierdie benadering laat ons toe om ekologiese parameters en ekologiese netwerkgeskiedenisse vanuit regte-wêreld data af te lei, sowel as om ekologiese netwerke onder ons model te simuleer. Alhoewel ekoloë al lank reeds bewus is van die invloed wat ewolusionêre prosesse het op
die vorming van ekologiese netwerke, is ons nou in staat om die belangrikheid van hierdie invloed te evalueer.
Acknowledgements
I thank God, My Heavenly Father, for His guidance and love, making this thesis possible. My deepest acknowledgment goes to Prof Konrad Sheer for his diligent and patient guid-ance, his invaluable feedback throughout this thesis, and his help in so many aspects of this thesis. I am also very grateful to him for having translated the abstract into Afrikaans. I owe a special debt to Dr Cang Hui and Dr John Terblanche for those enjoyable and inspir-ing sessions of discussion and idea exploration, and to Prof Sergei Kosakovsky Pond for his help with the model implementation.
My thanks also go to all my friends and colleagues for their support and encouragement. A heartily appreciation goes to my family for their prayers and loyal support during the good and the hard times. I am exceptionally grateful to Ando for his devoted support and help throughout the accomplishment of this thesis.
Finally, the nancial assistance of the Faculty of Science of the University of Stellenbosch, the African Institute for Mathematical Sciences (AIMS) and the Center of Excellence for Invasion Biology (CIB) is hereby acknowledged.
Dedications
To my parents
Contents
Declaration i Abstract ii Uittreksel iii Acknowledgements v Dedications vi Contents vii List of Figures ix List of Tables xi 1 Introduction 11.1 Introduction to the Problem . . . 1
1.2 Thesis Layout . . . 2
2 Literature Review 3 2.1 On the Structure of Complex Networks . . . 3
2.2 Evolving Network Models: an Overview . . . 5
2.3 Ecological Interaction Networks . . . 9
2.4 Conclusion . . . 22
3 Phylogenetic Analysis 23 3.1 Molecular Evolution Models . . . 23
3.2 Phylogenetic Trees . . . 27
3.3 HyPhy . . . 31 vii
3.4 Conclusion . . . 31 4 Model Construction 33 4.1 Model Overview . . . 33 4.2 Model Formalization . . . 35 4.3 Experimentation . . . 40 4.4 Conclusion . . . 49 5 Model Outcomes 51 5.1 Likelihood Comparison . . . 51
5.2 Node Degree Distribution . . . 54
5.3 Nestedness Values . . . 60
5.4 Parameter Estimates . . . 65
5.5 Discussion . . . 67
6 Conclusion 71 6.1 Summary . . . 71
6.2 Recommendations and Perspectives . . . 72
A Dataset 74
References 76
List of Figures
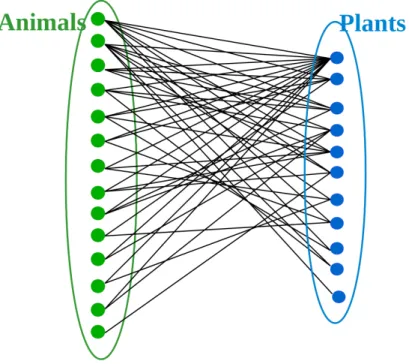
4.1 A seed dispersal interaction network between communities of birds and berries in
Great Britain in 1988 . . . 34
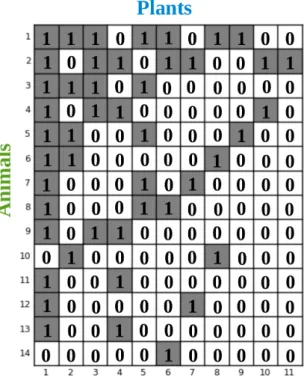
4.2 Adjacency matrix associated with the network in gure 4.1 . . . 35
4.3 The model aims to reconstruct the network at any time in the past . . . 36
4.4 Example of a combination of two phylogenetic trees . . . 37
4.5 (a) A perfectly nested matrix with NODF value=100. (b) A frugivory network in Southern Spanish Mediterranean shrublands; cells lled in grey represent a presence of interaction; species are arranged from the most generalist to the most specialist; NODF value=79.75 . . . 47
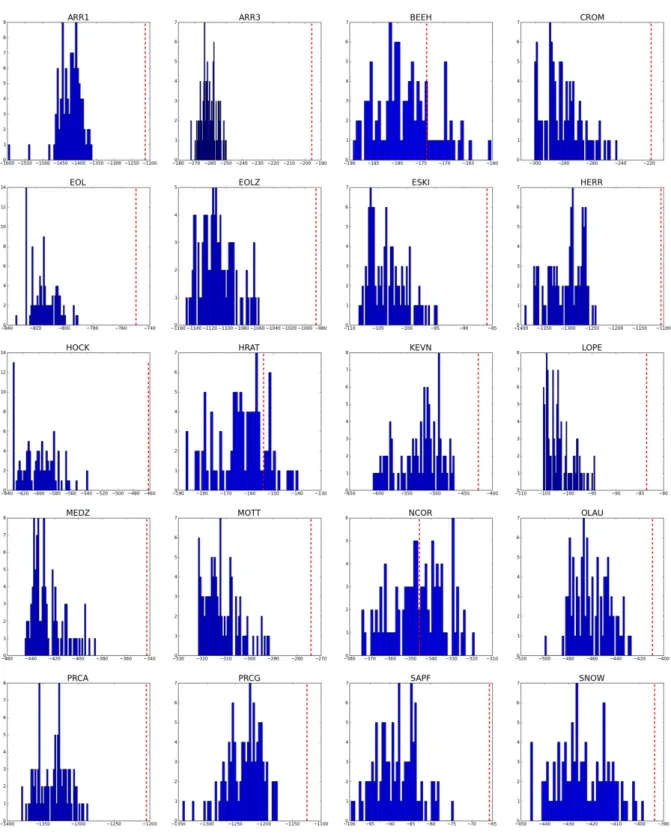
5.1 Likelihood histogram of the analysis of dierent networks. In each network, likeli-hood values when using random phylogenies are represented by the blue bars; the red broken line indicates the value of the likelihood when using the real phylogenies 53 5.2 Log-log plot of the complementary cumulative distribution of the connectivities of examples of a frugivory network (MOTT) and a pollination network (MONT); when plants and animals are tted together, the degree distribution in the fru-givory network is best tted by a truncated power-law and the degree distribution in the pollination network by our model. . . 56
5.3 Average NODF values of networks simulated under our model (a) and of net-works simulated under the null model (b) vs NODF values of empirical netnet-works. Continuous lines are the best ts to the data, the broken lines represent x=y. Networks which discard the null hypotheses (our model or the null model for (a) or (b) respectively) are represented by empty circles. Otherwise, they are represented by solid circles. . . 62
5.4 Log-log plot of the complementary cumulative distribution of the connectivities of an example of pollination network. In contrast to the inference using intermediate branch lengths, using too large branch lengths result in a random behaviour of the network while using too short branch lengths result in a poor t to the data. The random networks (red triangle) were generated from the null model for the degree distribution study. . . 69
List of Tables
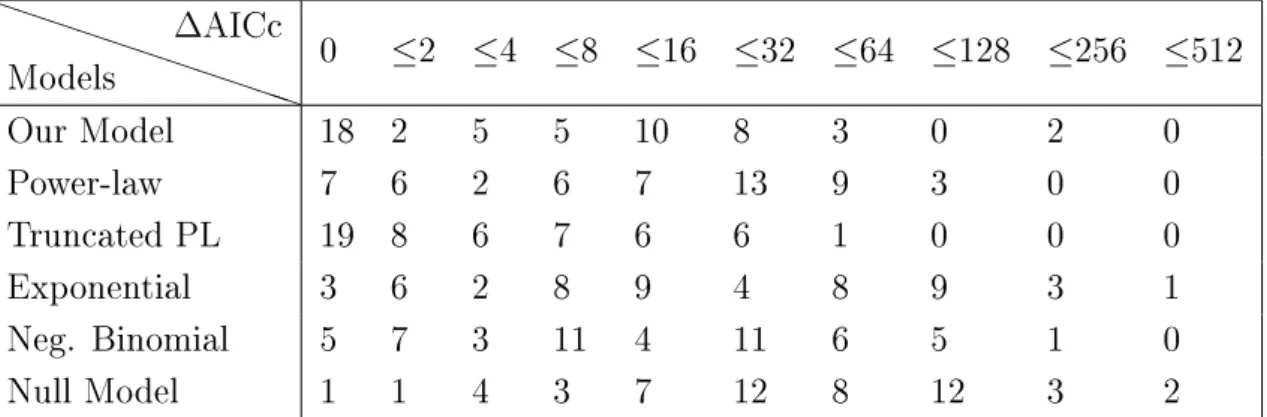
2.1 Classication of ecological interactions . . . 11 5.1 AICc scores of each model of degree distribution (for both animals and plants) . 57 5.2 Repartition of the networks according to the ∆AICc scores of each degree
distri-bution model for animals and plants . . . 58 5.3 Repartition of the networks according to the ∆AICc scores of each degree
distri-bution model for animals . . . 58 5.4 Repartition of the networks according to the ∆AICc scores of each degree
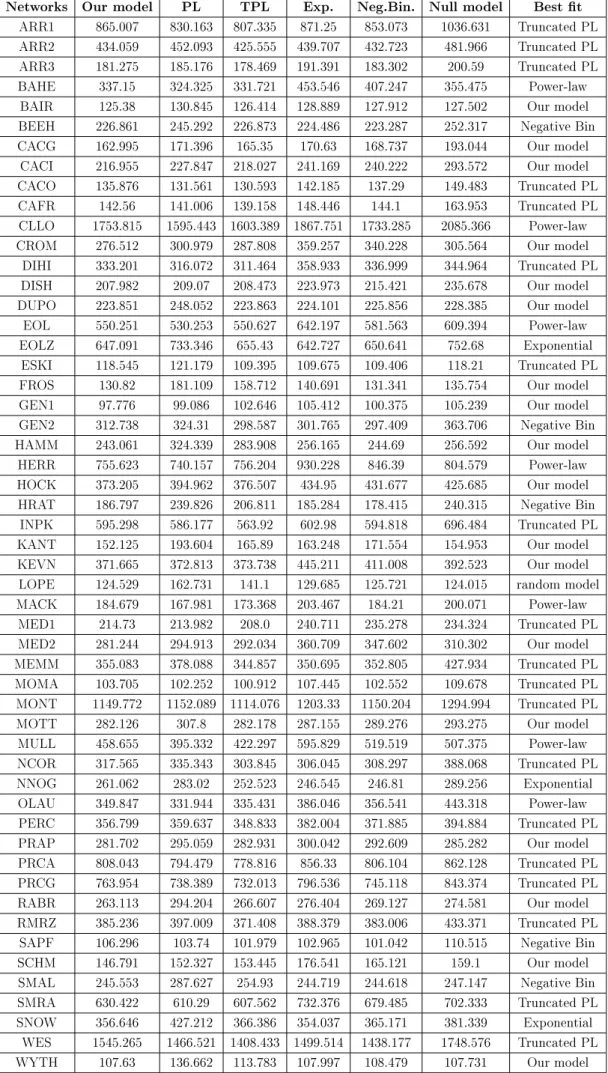
distri-bution model for plants . . . 58 5.5 Absolute nestedness degrees . . . 63 5.6 Relative nestedness degrees . . . 64 5.7 Maximum likelihood estimates of parameters in our stationary reversible model 66 A.1 Details of each studied network . . . 74
Chapter 1
Introduction
1.1 Introduction to the Problem
As a rule, natural systems are very complex. Understanding their functioning may sometimes require more than empirical observations. The use of theoretical and analytical tools in solving problems in ecology has existed for a long time, but only recently has there been an explosion in the eld due to the acquirement of very large datasets and the recent increase in computational power allowing large scale calculations and simulations. Theory is not only about a representation of the real but it also gives a framework for analyses and predictions. The study of interactions between organisms holds an important place in ecology because the survival of species depends largely on their interactions with their environment. Networks formed by those interactions evolve through time: while new species become involved in the network, other species may no longer be a network participant. The absence or the presence of a species in the interaction may primarily depend on the evolution of that species.
In this thesis, we propose to mathematically model the evolution of such ecological networks through time. For this purpose, we make use of a probabilistic approach in which species gain or lose interactions at a xed rate through evolutionary time. We assume that when a parent species gives rise to a pair of descendant species, the descendant species inherit the interactions of the parent. This makes sense because shared morphological and physiological traits between parents and their descendants ensure a high propensity for them to interact with the same partner.
Most ecological network studies focus on exploring the structure of the networks. This structure depends on many factors. One of them is the past evolutionary history of the
species involved in the networks. Although the fact that the structure of ecological networks is inuenced by evolutionary history has already been acknowledged in the eld of ecology, few works have been done in quantifying this inuence. By building an ecological network model that incorporates the process of evolution itself, we aim to quantify the extent to which ecological network structure is governed by evolution, and this will be done by means of simulations under our model. Our model is an attempt to use mathematical, computational and phylogenetic tools towards solving a problem in evolutionary ecology.
1.2 Thesis Layout
In addition to this introductory chapter, this thesis comprises 5 further chapters. Chapter 2 puts the reader in the context of the thesis. It gives a global view of complex networks with a focus on ecological networks. We will also list, to the best of our knowledge, works already done on network models which are related to our model.
Chapter 3 aims to give information on how to perform a standard phylogenetic inference, because some of the phylogenetic tools described in this chapter will be used in building our model.
The model itself will be described in chapter 4. We will explain how we constructed our model by detailing the method we used. We will also describe how we performed simulations under the model. Those simulations were performed in order to look at the eect of the phylogenetic history of the species on ecological network structure.
In chapter 5, we will state the results we obtained from simulations. By interpreting those results, we will also try to give answers to fundamental questions raised in this thesis. Finally, the thesis closes with a summary of the contributions we made as well as recommen-dations one has to be aware of when using our model. Indication of possible future avenues which deserve to be investigated will also be given.
Chapter 2
Literature Review
In a society and in nature, there is a large range of systems that do not present a trivial structure. They are often modelled by complex networks and form a eld of study of their own. Complex network studies have always been associated with the eld of graph theory which allows an abstract representation of networks by nodes linked (or not) by edges. The word `network' normally invokes interactions between the entities forming the network. Da Fontoura Costa et al. [2011] present a survey of the applications of complex networks in a diversity of domains such as biological networks, social networks, ecological networks and the Internet. They gave an overview of the observed structure of networks as well as a description of models used in each of these domains.
In the centre of interaction network studies is the analysis of their characteristics and their dynamics. Interaction network characteristics have been the main focus in the eld, but the latter, describing the evolution of the networks over time, also deserves attention since it can give explanations for the former. The rst section of this chapter will discuss the structure of complex networks. It will be followed by a section on models of evolving networks where both structural models and models of evolution will be discussed. Since ecological networks are our central concern, the nal section will be devoted to them.
2.1 On the Structure of Complex Networks
In order to characterize complex networks, they rst need to be measured. We start by listing the most commonly used measurements of complex networks in the eld of graph theory.
2.1.1 Measurements
Node degreeThe degree of a node is the total number of connections shared by the node. The average node degree in a network gives the connectivity of the network. Another measurement related to the connectivity is the node degree distribution that gives the probabilityP(k)of a uniformly chosen node to have a degreek.
Clustering Coecient
The clustering coecient is a measure of how the nodes in the network tend to cluster together. Given that the neighbours of a node are the nodes directly connected to that node, the clustering coecient of a node is the ratio between the number of connections among the neighbours of the node and the maximum possible number of connections among these neighbours. Usually, to characterize the entire network, the average over all the nodes of the clustering coecients is computed.
Path Length
The length of a path connecting two nodes is the total number of edges along the path. The shortest path is usually considered as a measurement of the distance between two nodes. The whole network can be characterized by the average path length, which is the average value of the shortest path lengths between all pairs of nodes in the network.
Strength
Sometimes, instead of just considering the presence or the absence of a link between two nodes, a weight is assigned to each edge, forming a weighted network. The strength of a node is the sum of the weights of the edges that connect the node.
Assortativity
Assortativity refers to the fact that similar nodes are connected. The similarity of the nodes can be evaluated in terms of any measurement on the nodes. Commonly used approaches are assortativity in degree and assortativity in strength. Assortativity in degree is measured
by examining the correlation between the degree of each node and the average degree of the the neighbours of the node. A positive correlation indicates an assortativity while a negative correlation indicates a disassortativity.
2.1.2 Characteristics
Several real-world networks, such as some technological, social or biological networks, possess the small-world feature [Watts and Strogatz, 1998]. A small-world network is characterized by the fact that most nodes are connected by a short path. These networks have intermediate properties between a randomly structured network and a network with a regular structure. They exhibit a high clustering coecient which denotes a dense connectivity between neigh-bours of a given node forming a module and sparser external connections to other modules. They also exhibit a small average path length like random graphs.
The exploration of several large databases describing the structure of real-world networks spanning diversied elds such as the World Wide Web (WWW) or the citation patterns in science allowed Barabási and Albert [1999] to report a scale-free power-law in the node degree distribution. That is to say, P(k)∝ k−γ for large values of k. The exponent γ often
lies in the range 2≤γ ≤4.
In addition to the scale-free feature observed in the degree distribution, both the connection weights and the strength of nodes in many real-world complex networks also obey a power-law distribution [Li and Chen, 2004].
In particular, many real biological networks, such as gene regulatory, proteprotein in-teraction and metabolic networks are known to have a hierarchical structure of modules. This property is highlighted by the fact that if we plot the clustering coecient of each node against the degree of the node, a power-law behaviour is observed. Several biological networks also exhibit a disassortativity in degree [Takemoto and Oosawa, 2006].
2.2 Evolving Network Models: an Overview
Almost all real-world networks evolve through time: some nodes and connections may disap-pear while new nodes and links may apdisap-pear. While some evolving network models emphasize the modelling of the dynamics of networks, some models are built in order to nd plausible explanations of the empirically observed structures of complex networks. We rst discuss structural models, followed by models that are similar to ours in that they explicitly incor-porate evolution.
2.2.1 Models Based on Structure
The main purpose of evolving network models based on network structures is to have rules governing the network dynamics that will result in networks that have the empirically ob-served structure.
Scale-free Network Models
The rst network model able to reproduce the scale-free property of node degree distribution was proposed by Barabási and Albert [1999]. They explained that this scale-free behaviour is a consequence of two features of real-life networks: the growth rule and the preferential attachment rule. In fact, real networks are observed to grow through time by addition of new nodes. These new nodes are connected to already existing nodes according to a preferential connectivity rule: they have higher probability to connect to a node having a large number of connections than to poorly connected nodes. Based on those two assumptions, they con-structed a model of network evolution reproducing a scale-free behaviour of the node degree distribution at any time step.
The construction rules in the Barabási-Albert model (B-A model) was then later considered as basis in other models.
In this trend, Krapivsky et al. [2000] presented a growing network model that generalizes the B-A model. They proposed the form of the probability of a new node to connect to a pre-existing node with k pre-existing links,Akto be proportional tokν (ν ≥0). By assuming
this form of Ak, they retained the preferential attachment rule of the B-A model. They then
examined the possible structure of the network for dierent values of the exponent ν. For ν < 1, the node degree distribution Nk is exponential. ν > 1 shows an extreme structure
where a single node connects to nearly every node in the graph. Only the case when ν = 1 leads to a power-law distribution: Nk ∝k−γ. Their generalized approach suits not only the
special and dominant case of a power-law distribution in degree, but all networks that grow through time.
Li and Chen [2003] tried to overcome the limitation of the B-A model that it has a xed exponent in the power-law degree distribution while the empirically measured exponents vary. They built a model producing a node degree distribution that represents a transition between a power-law scaling and an exponential distribution, by using the concept of `local-world network': a new added node may only connect to a randomly selected set of nodes (its `local world') following the preferential attachment rule.
built a model that can represent weighted links between nodes. They used the preferential attachment rule and a preferential strengthening rule as well. These processes allowed them to have a model that mimics the three observed power-law behaviours: in the degree distri-bution, in the strength of nodes and in the connection weights.
Li and Maini [2005] elaborated an evolving network model with a community structure con-sidering the two rules used in the B-A model. On the one hand, they retained the growth rule by adding a new node at each time step. On the other hand, they dened two rules for the preferential attachment: an inner-community preferential attachment rule describ-ing the probability of the nodes in the same community to connect with a new node, and an inter-community preferential attachment rule stating the probability of nodes in other communities to connect with the new node. The communities are dened as sets of densely connected nodes, as in the case of modules. Their model also reproduced a power-law dis-tribution of the node degree.
Small-world Models
The small-world model was proposed by Watts and Strogatz [1998]. In their model, an edges rewiring process is used: they began by arranging the nodes in a ring structure and connecting each node to itsk nearest neighbours.This results in a graph with a regular form.
Next, each of the edges in this graph is removed and reconnected with probability p to a
randomly chosen node in the network. The edges connecting a node to its nearest neighbours are considered rst, then the edges connecting each node to its second nearest neighbour, etc, until all the edges in the initial regular graph have been rewired. The resulting network has properties between a regular graph and a random graph, and displays the small-world phenomenon.
Other models were inspired by both the small-world phenomenon and the B-A model. That is the case for a model built by Jost and Joy [2002]. A distance preference function characterizes their model: the probability of the formation of a new link depends on the distance separating the two linked nodes. For instance, one can assume that the connection between two separated nodes by a distance of 2 (neighbour of neighbour) is the most probable link to be formed. In the network construction, when a new node is added, it is rst connected randomly to an existing node. The formation of links connecting it to the other nodes depends on the distance preference function. They found that when the distance preference function is such that the shortest distance is always preferred, one ends up with a network with high clustering coecient, short average path length and with the scale-free behaviour of the degree distribution. This means that their model possesses at the same
time the properties of the small-world model and the B-A model.
In biology, Takemoto and Oosawa [2006] also proposed such a network model. They modied the growth rule of the B-A model: instead of adding a single node at each time step, an entire module of constant size is added. Then, to merge the new module with the pre-existing nodes, they followed a preferential attachment rule combined with a tness-driven mechanism: the probability of a node i to get connected to a new node is proportional
to its degree ki (preferential attachment rule) and its tness fi (tness-driven mechanism).
Initialized to 0 for all nodes, the tness valuefi is increased at each step if the nodeiacquires
a new link. The resulting model mimics the scale-free distribution of node degree, the small-world property and the hierarchical structure of modules. Additionally, the inclusion of the tness parameter contributes to a disassortativity in degree.
2.2.2 Models of evolution
For some evolutionary network models, the emphasis is not in reproducing the network struc-ture observed empirically but in modelling the process of evolution of the network.
In this context, Borgnat et al. [2008] indicate recently used approaches to characterize the dynamics of complex networks. According to them, evolving networks can be considered as a sequence of snapshots at dierent times. Each snapshot can be studied as a static network. The evolution of some global parameters such as the number of nodes or the number of links can then be analysed by considering their states at each snapshot. They also stated a more local approach: dynamic properties such as birth, death, or growth can be assigned to a specic group of nodes or even to each individual node.
Grindrod and Higham [2010] used the snapshot approach to develop an evolving network model based on a discrete time Markov chain. Their model is adapted for networks in which a spatial location can be assigned to each node. For example, in a social network, the physical location of each individual can be considered as its spatial location in the graph representation. For such networks, a distance can then be assigned between two nodes: this distance is called the `range' separating the two nodes. In their model, the formation of a link between two nodes depends probabilistically on that `range'. Each edge is assigned a weight which represents the `range' separating the two connected nodes. The range parameter is inferred from the snapshots of real data for all possible edges. They showed that this range-dependent model is applicable for real-life networks as in telecommunications. Subsequently, they generalized their model, but this time considering other extra parameters on which the probability of the birth or the death of a link depends, such as local clustering or the degree of nodes [Grindrod and Higham, 2011].
In the modelling of biological networks, a completely dierent approach was proposed by Vázquez et al. [2003]. They modelled a protein-protein interaction network based on the evolutionary history of the proteins: the duplication-divergence model. The model works as follows: during a duplication step, a node, considered as a duplicate of a randomly selected node, is created. Then, this new node shares all the connections of its duplicate, and con-nects with it according to a certain probability. Then comes the divergence step: among all the proteins to which the two previous proteins are connected, one node is removed with a certain probability. The two processes are repeated at each time step. They showed that this model captures some features of a real protein interaction network, such as the power-law behaviour of the node degree, or the number of proteins linked into triplets or quartets. Although approaches and methods are very diversied in the modelling of an evolving net-work, they are all based on a probabilistic approach: the addition of a node or the creation of a new connection are often dened to follow a certain probability. Such a probabilistic approach is also considered in the model we develop in this thesis. However, most of the above models focus on reproducing the characteristics of empirical networks. Consequently, the rules governing the evolution are based on suppositions only. By doing so, modelling the real processes of evolution can be neglected. For instance, most of the models only consider the growth of the network by addition of new nodes and neglect the fact that at some time, some nodes may disappear. This issue is overcome in our model since it is based on the phylo-genetic history of the set of interacting individuals. The model of protein-protein interaction [Vázquez et al., 2003] is similar to our model in the sense that in both cases the history of the evolution is modelled with reference to divergence and duplication or speciation. However, our model is simpler.
2.3 Ecological Interaction Networks
Every species interacts with its environment and other species, forming a complex ecological network. This interaction is fundamental for the survival of the species. Thus ecological interaction networks ensure the functioning of the entire ecosystem. That is why ecological interaction studies have always played a central role in ecology.
2.3.1 Classication
Ecological interactions can be classied according to the way species interact: we can dis-tinguish mutualistic, commensalistic, amensalistic and antagonistic interactions.
2.3.1.1 Mutualistic Interaction Networks
A mutualistic interaction occurs when both of the two interacting organisms benet from the association. A common example of a mutualistic network is a plant-pollinator network in which the pollinator (such as bees or birds) drinks the nectar of the plant species. In return, after being covered by pollen from that plant, the pollinator transfers the pollen to the corresponding female plant, ensuring the pollination process in that way. A frugivory network is an example of a mutualistic network as well; the frugivore animal eats the fruit and in return disperses the seed of the fruit. This allows the plant to have progeny. Compared to other mutualistic interactions, interactions between plants and their pollinators or frugivores have gained a particular attention for ecologists (for example, see: Levey et al. [2002], Landry [2010]). Another example of a mutualistic interaction is the relationship between humans and their intestinal bacteria. The bacteria benet by getting food that the human cannot digest while the human benets by being able to nish the digestion. Boucher et al. [1982] have identied two types of mutualistic interactions: direct mutualism in which the two species interact physically and indirect mutualism in which the two species benet from each other without necessary being in a direct contact. Interesting reviews on mutualistic interactions have been made by Boucher et al. [1982] and Bronstein [1994].
2.3.1.2 Commensalistic Interaction Networks
A commensalism is an interaction between two organisms in which one organism benets and the other neither benets nor is harmed. In many cases, the beneciary species uses the host species as a home and/or a transportation. For example, in order to get more air and light, some tropical orchids grow on the support of a tree without harming or beneting the tree. Another example is the case of barnacles, a sedentary crustacean species. To gain support, they must attach themselves to a solid substance such as the shell of a scallop, leaving the scallop unaected.
2.3.1.3 Amensalistic Interaction Networks
One can talk about an amensalistic interaction when one organism is aected by the interac-tion while the other one derives no benet. Usually, this occurs when one organism is harmed by a product of the other organism. That is for instance the case when sheep make trails in grass that they trample on. In this manner, the grass can be killed. Another example is the
black walnut tree that secretes a chemical substance which can kill some species of plants in their neighbourhood.
2.3.1.4 Antagonistic Interaction Networks
When the relationship between two organisms reects an opposition or a competition re-sulting in one organism beneting at the expense of the other one, the interaction is called antagonism. One can consider the example of a predator-prey interaction network (food web) formed by a group of species that feed on each other. Food-web studies have long been central to ecological research, consequently attract many researchers (for example, see: Pimm [1980], Williams and Martinez [2000]). Another example of an antagonistic network is a parasitism interaction network in which parasites, living on or inside the host, benets while hosts are harmed.
2.3.1.5 Competition
When two organisms share a common requirement for a limited resource, they are engaged in a competition. Competition is a mutually detrimental interaction between the two or-ganisms. A competition may occur between organisms of the same species (intraspecic competition) or between organisms of two separate species (interspecic competition). An example of competition is when two trees grow close together: they will compete for nutri-ents in the soil.
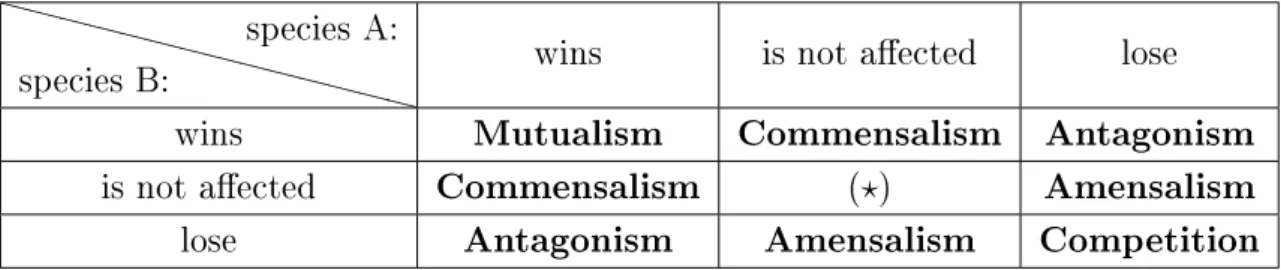
Regarding the eect of the interaction on the pair of organisms, the way ecological interaction networks are classied can be summarized in table 2.1.
Table 2.1: Classication of ecological interactions
XX XX XX XX XX XX XX species B: species A:
wins is not aected lose
wins Mutualism Commensalism Antagonism
is not aected Commensalism (?) Amensalism
lose Antagonism Amensalism Competition
In reality, the classication of an ecological interaction into these categories remains ambigu-ous since it also depends on how far the interaction has been investigated in term of details and time. For instance, a commensalistic interaction can become an antagonism if the host is shown to be negatively aected by the relationship in the long term.
Historically, ecological network studies have tended to focus mainly on antagonistic networks, specically on food webs. Other types of interactions, such as mutualism, have only been explored recently. Our study will be concentrated on mutualistic networks.
2.3.2 Structure of Mutualistic Networks
Assumptions on the structure of ecological networks result from immeasurable hours of careful observation of nature by means of eld work followed by statistical analysis. Like other types of real-world network, ecological networks have been found to have a non-random structure. Therefore, the study of the architecture of mutualistic networks has become a central focus. For reviews on the subject, see Bascompte and Jordano [2007], Vázquez et al. [2009].
2.3.2.1 Degree Distribution
Early studies on the relative abundance of specialists (species interacting with only a few species) and generalists (species that can make use of dierent varieties of resources, thus interacting with many other species) motivated the examination of the degree distribution in an ecological network. In fact, Waser et al. [1996] examined the level of generalization of pollination webs and concluded that, in general, a pollinator uses several plant species and a plant species is visited by several pollinators. This makes generalization a rule rather than an exception. Some time later, Memmott [1999] explored methods usually applied for food webs to study the structure of plant-pollinator webs and supported Waser et al. [1996] on the domination of generalist species. Vázquez and Aizen [2003] contradicted the assumption of Waser et al. [1996] by making predictions on the patterns of generalization in plant-pollinator interactions on the basis of a null model. Thus, they observed a high number of both the generalists and the specialists compared to the null model expectation.
Those earlier studies only gave a general approach of how abundantly species interact in mutualistic networks, without suggesting an appropriate distribution for the number of in-teractions per species. Consequently, Jordano et al. [2003] proposed to t the empirical degree distribution to known models of distribution. When exploring 29 plant-pollinator and 24 plant-frugivore networks and examining their degree distribution separately for each
plant and animal species set, they found that most of the networks (65.6%) show a degree distribution of nodes that follows a decaying power-law. More precisely, the distribution is of the formP(k)∝k−γexp(−k/k
x)in whichkx is a cut-o value. 22.2% show a scale
invari-ance, best tted by a power-law distribution (P(k)∝ k−γ). The remaining networks either
t a fast decaying distribution, notably an exponential distribution (P(k) ∝ exp(−γk)) or show no t at all. Good ts for the power-law are found for intermediate values of the species degree (generally ≤ 30) while the decaying power-law is observed for higher values.
The authors not only described some features of mutualistic webs but they looked at plau-sible explanations of these features. Thus, the power-law ts may invoke an idea about the generalization level of the communities: specialists species are abundant in the community, in contrast to rare generalist species. The truncation of the power-law t indicates that super generalists are rarer than expected: they are even rarer than in most non-ecological networks having the scale-free feature. While exploring their dataset further, they suggested that the observed exponential truncation may be the result of the existence of forbidden links between plants and animals: some species are constrained by their phenotypic traits, limiting the number of other species with which they can interact.
More recent studies dismissed some of the hypotheses proposed by Jordano et al. [2003]. Among others, Vázquez [2005] proposed an alternative in explaining the truncation of the power-law. Based on the assumption that the degree distribution of each species is a func-tion of its frequency of interacfunc-tion, they built a null model able to reproduce the empirical degree distribution of most of the studied communities. They showed that the truncation of the power-law can be explained even by the unique fact that the degree distribution and the frequency of interaction are correlated. Okuyama [2008], stated that the method used by Jordano et al. [2003] in the regression tting may be unreliable. He proposed a maximum likelihood approach in nding the parameters for the ts, and found considerable disagree-ments in parameter values proposed by Jordano et al. [2003] and parameters given by his approach. Not only did he t a power-law model and a truncated power-law model to the data, but he proposed a gamma distribution model as well. In many of the networks, the gamma distribution appeared to be the best t.
To summarize, methods used by Jordano et al. [2003] show a predominance of a truncated power-law behaviour in the degree distribution indicating the abundance of specialists and the rarity of super generalists, while a maximum likelihood method shows that a gamma dis-tribution is the best t to the degree disdis-tribution. The degree disdis-tribution of some networks is also best tted by a power-law or an exponential distribution.
2.3.2.2 Nestedness
Ecological mutualistic networks have been found to be highly nested. Nestedness was de-ned by Bascompte and Jordano [2007] to be a pattern of interaction in which specialists interact with species that form perfect subsets of the species with which generalists interact. After analysing 52 mutualistic networks, Bascompte et al. [2003] observed a highly nested structure in them. In fact, they estimated an index of nestedness for each network using the Nestedness Calculator Software [see Atmar and Patterson, 1993]. They then compared the nestedness index of the empirical networks with the nestedness index given by a null model composed of randomly assembled networks. 70% of the seed dispersal and 80% of the pollination networks have a nestedness index that departs signicantly (at 5% level) from the null model. Furthermore, they investigated the relationship between the complexity of the web (indicated by its number of interactions) and the nestedness value and found that as the network complexity increases, they become more nested.
Other researchers investigated these nestedness patterns further. A nested structure was also observed by Dupont et al. [2003] in a pollination network in the high-altitude desert of Tenerife. Guimarães et al. [2006] conrmed the nding not only in pollination and seed dis-persal networks but in ant-plant mutualistic networks as well. Even in interactions between sea anemones and their associated sh species, nestedness was observed [Ollerton and Allen, 2007]. Nestedness is consequently revealed to be a common feature in mutualistic networks. Nestedness in mutualistic networks has also been shown to exist regardless of the time and place data is sampled [Onielsen and Bascompte, 2007].
More recently, the measurement of nestedness has been the object of substantial controversy. Ulrich et al. [2009] argued that the metric used previously to measure nestedness is biased because the null model for the comparison is not constrained enough, leading to an exagger-ation of the proportion of nested networks found in previous studies. Following this, Joppa et al. [2010] concluded that the use of a more constrained null model and other metrics in the characterization of nestedness tempered the high nestedness ndings in ecological networks, but still give a dominant proportion of nested ecological networks.
2.3.2.3 Asymmetries
The nested structure implies another feature of mutualistic networks, namely their asymme-try. Asymmetry is also referred to disassortativity (see 2.1.1). In fact, nestedness gives an high asymmetric structure in terms of degree: rarely connected species (specialists) connect only with highly connected species (generalists), while generalists interact with both
special-ists and generalspecial-ists. These asymmetries were observed by Vázquez and Aizen [2004].
Mutualistic networks also exhibit asymmetry in terms of strength. An interaction between two species can be weighted by the frequency of interaction. The strength of a species is then the sum of frequencies of interactions between the species and all its partners, e.g. the sum of the frequency of the visits a plant receives from pollinators. The concept of strength is re-lated to the concept of dependency in the sense that the dependence of an animal on a plant is the proportion of the visits of the animal to this particular plant over all the visits given by the animal in the network. Bascompte et al. [2006] found a highly asymmetric structure of the dependencies: plant species depend strongly on animal species which depend weakly on the plant.
2.3.2.4 Modularity
A network exhibits a modular or a compartmentalized structure when it is organized into subgroups, namely modules, such that species within a module interact strongly with one another but share weak interactions with species in the other modules. Dicks et al. [2002] detected a strong evidence of compartmentalization in plant-insect mutualistic networks. They also observed that each module is composed of species in the same biological class or sharing some particular morphological traits.
Some time later, Olesen et al. [2007] worked further on the modularity characteristic by analysing a large dataset of pollination networks. They observed a modular pattern in-creasing with the number of species: large networks (>150 species) exhibit a modularity
structure, while small networks (< 50 species) do not. As in the case of Dicks et al. [2002],
they detected some convergent traits belonging to species in the same module and proposed an explication of the modular structure by the process of evolution.
2.3.3 Mutualistic Network Models
Once some insights concerning the structure of mutualistic networks are acquired, the possi-ble process generating such features and the possipossi-ble implications of such a structure on the network persistence remain two important questions for ecologists. One way to approach these questions is the construction of ecological network models able to generate the char-acteristics found empirically, and/or give theoretical predictions of the robustness of the networks.
In this context, an attempt to explain the truncation of the power-law observed in the node degree distribution was provided by Guimarães Jr et al. [2007]. They proposed a dynamical
network model based on the B-A model [Barabási and Albert, 1999], but modied in such a way that it generates a truncated power-law degree distribution instead of a power-law distribution. Modications were made to the relative growth of the two mutualistic sets: either one set has a higher probability of acquiring a new node than the other one, meaning a dierence in growth rate between the two groups, or one of the sets has a limiting size and stops growing. Both of those two mechanisms typify a signicant dierence in species richness between the two sets. This characteristic is also observed in the dataset used by Jor-dano et al. [2003] which shows the truncated power-law behaviour in the degree distribution. Thus, they demonstrated that the truncation of the power-law can emerge from processes associated with dierences in species richness between the two sets.
In a similar work, Medan et al. [2007] built a model that can generate both the trun-cated power-law distribution and the nestedness features of mutualistic networks. Their self-organized network model is a dynamical model that keeps the total number of species in the two sets and the total number of interactions xed. However, the connections are rewired during the process using the same principle as the preferential attachment rule: the allocation of the interaction to already well connected nodes is favoured. The rewiring op-eration is stopped depending on the match between the level of nestedness and the degree distribution of the modelled network and the empirical network. Since the model does not take the frequency of visits into account, the authors suggested that the correlation between the frequency of interactions and the degree distribution highlighted by Vázquez [2005] can-not be considered as a cause of the power-law truncation. They argued that the element responsible for the observed behaviour of mutualistic networks is primarily an elaborated preferential attachment rule, leading to both a truncated power-law and a high level of nest-edness.
Subsequently, more elaborate models have been built. The bipartite cooperation model, able to replicate the degree distribution, the nestedness behaviour and the level of modularity was proposed by Saavedra et al. [2009]. The model construction is governed by two rules. The rst is the specialization rule which determines the number of interacting partners a species can have, depending on a reward trait parameter drawn from a normal distribution. The second is the interaction rule which selects the most suitable species to be involved in the interaction, depending on the complementarity of traits between the pair. Their model was also found to be suitable for bipartite networks of manufacturer-contractor interactions, suggesting its relevance for a larger domain. By means of such a model, they demonstrated that the structure of interaction networks is strongly dependent on the complementarity in traits at the level of individual interactions.
such as the shape of the degree distribution, the nestedness pattern, and the modularity have been proposed. Thus, plausible explanations for the structure of ecological networks have emanated from those models. We can for instance list the existence of forbidden links, the correlation between the degree distribution and the frequency of visits, a high richness ratio between the two interacting sets, the preferential attachment rule and the level of com-plementarity of interaction between each pair of species. Simultaneously to those structural models, models built for future predictions were elaborated. We will focus on such models in the next section.
2.3.4 Robustness of Ecological Mutualistic Networks
The topological characteristics of mutualistic networks contribute enormously to their ro-bustness, dened to be their resistance to species loss.
Jordano et al. [2006] presented a preliminary approach to the question after their discovery of the nestedness structure and the shape of the degree distribution. In a model, they sim-ulated a perturbation by the removal of species in decreasing order of degree. Then, they observed the eects of such removals on the fraction of preserved links. Removal of only a small fraction of the most connected nodes had a dramatic eect on the network robustness. It also appears that the network is more sensitive to the loss of plant species than to the loss of animal species. Additionally, networks that exhibit a power-law degree distribution seem to be less robust than networks with a truncated power-law degree distribution. However, the nestedness pattern implies interactions among the most generalist plants and animals. Those interacting generalists form a dense core to which the rest of the web is linked. Thus, their removal may rapidly lead to a collapse of the entire network.
Successive removal of nodes is one way to simulate perturbation in an ecological network model in order to study the robustness of the network. Another way leading to the same goal is to simulate the loss of habitats. This approach was developed by Fortuna and Bascompte [2006]. Their model describes the changes in species abundance by means of the evolution of the fraction of available patches occupied by each species. The dynamical model has been tested for empirical networks, and for two dierent generated null model networks, namely a null model that does not reproduce the degree distribution and the nestedness, and a more conservative one which maintains the degree distribution approximately but not the nestedness. They found that as more habitats are destroyed, the rate of extinction in-creases. For each network, there is a threshold value of habitat loss such that beyond this value the communities suddenly start to collapse. Before the values of habitat destruction reach this threshold, real communities are seen to be less tolerant to habitat loss than
sim-ulated networks. The fraction of surviving species is smaller in real communities than in the simulated networks. Nevertheless, it appears that the threshold value is higher for the real communities than for the null model communities, meaning that the nested structure and the shape of the degree distribution in real communities allow a longer persistence. The proposed explanation for this robustness behaviour lies in the distribution of specialists and generalists. Since specialists rely on small number of species, they are the rst to go extinct. However, real communities show a high number of specialists, explaining the earlier decay of real communities. Real communities persist longer because those many specialists share only few links with other species: their isolation does not cause an extinction cascade. The eect of the nested structure of ecological networks was given particular attention in Bastolla et al. [2009]. The authors elaborated a mutualistic model dened by dierential equations that describe the dynamics of species in the community. The model gives the number of species that can coexist in the community by incorporating the negative eect of the competition for resources between species in the same set and the positive eect of the mutualism between species in the two sets. Parameters of the models were rst estimated from real networks which are known to be highly nested, and then from randomly simulated networks of which the bulk show no pattern of nestedness. Their results revealed that real communities show a higher increase in biodiversity (computed to be the total number of co-existing species) compared to randomly generated networks. The more nested the network is, the higher the number of species that can coexist in the network.
The asymmetric structure of mutualistic networks has also been found to have a major role in network robustness. In the study in Bascompte et al. [2006] detected a highly asymmet-ric structure in term of species dependences, they also observed the consequences of such structure for biodiversity maintenance. Recall that in mutualistic networks, plants have been observed to depend strongly on animal species while animal species depend weakly on plants. The authors dened an equilibrium state for the community such that the network is still in equilibrium when the product of mutual dependencies (of an animal on a plant and of the plant on the animal) is kept small. Two situations satisfy this requirement: either the plant and the animal depend weakly on each other, or if an animal (respectively a plant) depends strongly on a plant, the plant (respectively the animal) should depend weakly on the animal. Since real communities exhibit an asymmetry of mutual dependence, they meet the second criterion for stability. Thus, the asymmetric dependency in terms of strength has been revealed to be a positive factor for the coexistence of species. Furthermore, the authors observed a predominance of weak dependencies in real networks, which satises the rst equilibrium criterion.
of degree in ecological networks have also been studied recently by Abramson et al. [2011]. The authors simulate the perturbation of a mutualistic network by the destruction of habi-tats. In order to make a comparison, they tested the model for dierent generated networks ranging from the most asymmetric to the least asymmetric, and for real pollination networks. Logically, specialist species should be more vulnerable to habitat destruction than generalist species. Surprisingly, this evidence was not found in pollination networks. The explana-tion lies in the degree asymmetry: it appears that in asymmetric networks, generalists and specialists are equally aected by habitat destruction, oppositely to the case of symmetric networks. In an assortative network, specialists interact with other specialists. After ex-tinction of some specialists, their specialist partners also lose most of their interactions and become extinct easily. However, in an asymmetric network even if some specialists become extinct, the other specialists are preserved.
In summary, it seems that the non-random features of mutualistic ecological networks en-hance their robustness. In a simulation of a perturbation where specialists are removed rst, the abundance of specialists prevent a phenomenon of extinction cascade. Because of the nestedness feature implying asymmetric interactions in terms of degree, specialists and generalists are equally negatively aected by habitat destruction, in contrast to assortative networks. In addition, the asymmetry in dependencies keeps the networks stable. Neverthe-less, mutualistic communities respond very badly to specic attacks such as those targeting the most connected species.
2.3.5 Phylogenetic Signal in Ecological Networks
As we have seen, several mechanisms have been proposed to explain the patterns governing the structure of ecological networks. Nevertheless, those explanations are mainly based on current ecological processes (such as preferential attachment or forbidden links due to non-matching traits), neglecting the fact that the observed structure may just be a result of the past evolutionary history of the species involved. Some studies have been performed in this direction. Those studies aim to detect a phylogenetic signal in the network, that is to say to detect a tendency of phylogenetically similar species to resemble each other.
Rezende et al. [2007a] were among the rst to explore the role of phylogenetic history in the structure of mutualistic ecological networks. They showed that the nestedness pattern is partially explained by phylogeny and phenotypic complementarity. For this purpose, they created interaction matrices such that the existence of an interaction depends only on the phenotypic complementarity between the species pair. They started by considering a set of possible phenotypic traits, such as the corolla length of a pollinated ower, or the tongue
length of a pollinator. They then simulated the evolution of those phenotypic traits along phylogenetic trees under a Brownian motion model of evolution. The Brownian motion works as follows: starting at the root of the tree, a value is assigned for each trait. This trait value is then changed randomly following a normal distribution on every branch of the tree until the tips are reached. The variance of the normal distribution is also rescaled in proportion to each branch length. This process gives a value that can be assigned to each phenotypic trait of the species at the tips. The probability of each pairwise interaction was then dened according to the degree of matching between each pair of species. These probabilities were used to construct an interaction matrix. They performed this simulation using phylogenetic trees with contrasting degrees of hierarchy, ranging from the least hierarchical one, namely a star phylogeny, to the most structured one. For each species, a phylogenetic signal was measured to quantify how closely related species sharing the same traits tend to be. The degree of nestedness of the resulting networks was also analysed. They found that in con-trast to phylogenies with a low degree of hierarchy, very hierarchical trees produce a high phylogenetic signal and highly nested networks. The degree of nestedness also increases with the number of phenotypic traits considered in the simulation. Consequently, they suggested that phenotypic diversity and phylogenetic history contribute to the nested structure of the networks. Furthermore, they examined a real bird-plant frugivory community with a known phylogeny. Some phenotypic traits of the species in the community were recorded. They then tested whether a phylogenetic signal can be detected in: (1) the phenotypic traits of the species, (2) in their degree (number of interactions of the species). The phylogenetic signal was considered signicant when its value departs signicantly (at 5% level) from a random permutation of the traits or the number of interactions among the species. They found that by contrast to the set of plants, both the phenotypic traits and the number of interactions tend to resemble in closely related bird species.
The same group explored further the detection of phylogenetic signals in real mutualistic communities [Rezende et al., 2007b]. They analysed a large number of pollination and fru-givory networks of which phylogenies are known. Their goal was to observe the extent to which closely related species tend to share interaction patterns. For this purpose, they ex-amined two components of interaction patterns: (1) the features governing the specialization level, namely species degree and its quantitative extension, species strength; (2) the partners identity of each species. When considering the data of species degree and species strength, the presence or the absence of phylogenetic signals was dened using statistical tools in comparative data analysis [Blomberg et al., 2003]. To detect whether closely related species tend to interact with the same partners, they began by constructing a phylogenetic distance matrix and an ecological distance matrix for each set of plants and animals. The ecological
distance matrix stores ecological similarity between species, which is dened by the propor-tion of the shared interacpropor-tions between two species over the total number of species they interact with. A positive correlation between those two matrices indicates the presence of a phylogenetic signal. They found that for more than one-third of the analysed phylogenies (that is for 39% of the communities), phylogenetically related species tend to have a similar number of interactions. Only a small fraction of the communities show evidence of a phylo-genetic signal when species strength is considered. For 42.7% of the phylogenies, a positive correlation was found between phylogenetic and ecological distance matrices, proving a ten-dency of phylogenetically related species to interact with the same partners.
A recent paper [Takemoto and Arita, 2010] proposed an evolving network model based on evolutionary processes to investigate the eect of the evolutionary history on the structure of mutualistic networks. The model is a growing network model starting from a small initial number of fully-interacting plants and animals, and governed by two processes. First, with probabilityp, a new plant is added to the network. This new plant is assumed to result from
the mutation of a randomly selected pre-existing plant, Consequently, the new plant inherits phenotypic traits from its parent and has a high probability to interact with the animals the parent is linked to. However, the phenomenon of divergence reduces this probability to a probability q. Second, with probability 1−p, a pre-existing plant evolves and acquires
new traits, allowing an interaction with a new added animal. The model parameters p and q are estimated from real data, knowing the total number of plants and animals and the
total number of links in the real web. Next, they compared networks simulated under their model with real networks and networks simulated under the bipartite cooperation model described earlier [Saavedra et al., 2009]. Their model has been proved to be able to repro-duce the nestedness pattern observed in real networks, similarly to the bipartite cooperation model. A suggested explanation for the nestedness lies in the mutation-divergence process: new plants, acquired from the mutation of the parents, interact with only a subset of the species the parent interacts with, because of divergence. Additionally, the model was shown to reproduce approximately the heterogeneous shape of the degree distribution of nodes. By reproducing those two well-known patterns using a simple model based on some mechanisms of evolution, their model suggests a non-negligible role of evolutionary history in the archi-tecture of mutualistic networks.
So far, the existence of phylogenetic signals has been found to be in evidence in ecological networks. Furthermore, attempts to model the long evolutionary process resulting in current interaction webs reinforce the nding.
2.4 Conclusion
Complex interaction network studies are mainly motivated by the need to rep-resent and explain the structure of real-world networks. Structural properties such as the small-world eect or the scale-free degree distribution have been observed to be common in most real-world networks. Consequently, most evolving network models aim to reproduce those properties by modelling the underlying possible mechanisms leading to such structure. In the case of ecological networks, more features are involved. If the study is limited to mutualistic interaction webs only, the skewness in the node degree distribution is one of their major properties. This skewness indicates generally either a power-law distribution, or more frequently a truncated power-law distribution and a gamma distribution. We can also list the nestedness pattern, leading to another ecological property which is the asym-metry in terms of degree. Quantitative studies also show an asymasym-metry in terms of strength and more recently, a modular pattern has been detected. Furthermore, knowing the global features of ecological networks helps in biodiversity preservation, in the sense that models based on the current observed structure allow prediction of the resistance of the networks to perturbations. It has for instance been proven that generalist species interacting with other generalists deserve particular attention in conservation since they form the mainstay of the network. Interest has also been focused on explaining the observed features of ecological networks. While some researchers proposed explanations relying on mechanistic processes such as the preferential attachment rule, the dierence in size between the two interacting sets, or the correlation between the degree distribution and the strength distribution, other researchers focused on more biological explanations such as complementarity of phenotypic traits or external environmental factors causing barriers in the interactions. Additionally, the importance of evolutionary history in explaining those patterns has been demonstrated. In some real networks, it has been observed that phylogenetically related species tend to share the same patterns of interaction. However, these studies have been mainly concentrated on detection of phylogenetic signal. Few have explored models based on the process of evolution itself. This issue will be tackled in our model: motivated by the nding of a phylogenetic signal in real networks, our model will be based on the evolutionary history of the network and will be tested on the dataset used in Rezende et al. [2007b] in order to see the extent to which phylogenetic history can explain some network properties. Before getting to the model description, details on phylogenetic analysis tools, useful to understand correctly our model, will be discussed in the next chapter.
Chapter 3
Phylogenetic Analysis
According to Darwin's theory of evolution, all living organisms are related and have descended from a common ancestor. Darwin's theory prompted the idea of exploring the evolutionary history of a set of organisms, more explicitly the evolutionary relatedness among the organisms: this is the aim of phylogenetic analysis. Although Gregor Mendel, the father of modern genetics, published his works on heredity only a few years after Darwin's `On the origin of species' [Darwin, 1859], the so-called `Modern Synthesis' combining the theories of Darwinian evolution and Mendelian genetics, was only developed in the middle of the 20th century. After the discovery of the molecular structure of DNA, the molecule that carries genetic information from one generation to the next, in 1953, molecular methods have gained a real importance in phylogenetic analysis. Helped by tremendous advances in sequencing, the exploration of the history of evolution is nowadays mainly focused on molecular phylogenetic techniques.
Reconstructing the evolutionary history of a set of organisms involves an attempt to build a phylogenetic tree, and a model of evolution. In some cases, dening a model of evolution allows the estimation of model parameters such as the tree topology and branch lengths. Basic principles used in models of evolution will be discussed in the rst section of this chapter. In the second section, we will talk about phylogenetic trees. The last section will focus on the description of the phylogenetic analysis software package used in our model.
3.1 Molecular Evolution Models
The evolution of DNA or amino acid sequences is usually modelled as a continuous time Markov process. Such a process, described by the variable x(t) evolving through time t, is
generally characterized by:
A set of the possible states of the variable x: S = (S1, . . . , SN)
Transition probabilities stored in a transition matrix P(t). The rows and columns of
P(t) represent the states S1, . . . , SN and each element Pij(t) is the probability that
state Si changes to state Sj in time t. For the matrix elements to form a probability
distribution, each matrix row should sum to 1.
A Markov process has the Markov `memoryless' property: the conditional probability of being at a future state given the present state depends only on the current state and not on earlier states. Mathematically speaking, the `memoryless' property means:
P (x(t2) = Si|x(t1) =Sj, x(t0) =Sk) =P (x(t2) =Si|x(t1) =Sj) for t0 ≤t1 ≤t2 (3.1.1) The evolution of a site in a sequence can be described by such a variablex(t). Possible states ofxare the nucleotide characters(A, C, G, T)for a DNA sequence and the 20 standard amino acids for an amino acid sequence.
The process is generally assumed to be stationary: the probability of substituting a character
aat timet0 by another characterbat timet1depends only on the time interval(t1−t0). The stationarity property also ensures that the rate at which a state changes to another state is independent of the time.
For a short time dt, P(dt) is approximately given by:
P(dt)≈(I+Qdt) (3.1.2)
Where I is the identity matrix and Q is known as the instantaneous rate matrix in which Qij is the rate at which state Si is replaced by state Sj. The diagonal elements Qii of the
rate matrix Q are dened such that the row sums are all zero.
The probability substitution matrix P(t) is multiplicative, in the sense that P(s)P(t) =
P(s+ t), for any time intervals s and t. This property is a result of the process being
Markovian and stationary.
In fact, if we denote each element of the matrix P(s)P(t) byPij(s, t), we have:
Pij(s, t) = X k Pik(s)Pkj(t) (3.1.3) =X k [P (x(s) =k|x(0) =i)P(x(t) = j|x(0) =k)] (3.1.4)
The stationary property allows us to write:
P (x(t) = j|x(0) =k) =P (x(t+s) =j|x(s) =k) (3.1.5) With equation 3.1.5, equation 3.1.4 becomes:
Pij(s, t) = X k [P(x(s) = k|x(0) =i)P (x(t+s) =j|x(s) =k)] =X k [P(x(s) = k|x(0) =i)P (x(t+s) =j|x(s) =k, x(0) =i)] (from equation 3.1.1) =X k P (x(s) =k, x(0) =i) P(x(0) =i) P (x(t+s) =j, x(s) =k, x(0) =i) P(x(s) =k, x(0) =i) =X k P (x(t+s) =j, x(s) = k, x(0) = i) P(x(0) =i) =X k [P(x(t+s) = j, x(s) =k|x(0) =i)] =P (x(t+s) =j|x(0) =i) =Pij(t+s)
Thus, with the multiplicativity property and equation 3.1.2, we get:
P(t+dt)≈P(t)P(dt)≈P(t)(I +Qdt) In the limit of small dt, we get:
P0(t) =P(t)Q (3.1.6)
Solving equation 3.1.6 gives
P(t) =eQt= ∞ X n=0 Qnt n n!
The matrix exponential can be computed directly by a diagonalization of Q. In this case,
we have:
Q=U−1ΛU and eQt=U−1eΛtU
where U is a matrix containing the eigenvectors of Q and Λ is a diagonal matrix composed of the eigenvalues of Q.
When the process runs for a very long time, it approaches an equilibrium state: lim
t→∞Pij(t) =πj
The equilibrium state is represented by the vector of equilibrium frequency π= (π1, . . . , πN)
frequency vector should sum to1.
Substitution models can also have the time reversibility property. A model is time reversible when it is invariant under the inversion of time scale, that is to say, if the evolutionary process is watched in reverse, it cannot be distinguished from when it is watched normally. A stationary reversible model satises the property:
πiQij =πjQji ∀i, j ∈(1, . . . , N)
Examples of Substitution Models
One of the rst DNA substitution models was proposed by Jukes and Cantor [1969]. This model makes simple assumptions such as an equal substitution rate for all nucleotides. Equi-librium frequencies are also all equal for all nucleotides (πA = πC = πG = πT = 14). Thus,
the rate matrix has the form:
Q= A C G T A −3α α α α C α −3α α α G α α −3α α T α α α −3α
Assuming that all nucleotides are substituted at the same rate was found to be too simplistic. In fact, transitions (substitutions between nucleotides A ↔ G and C ↔ T) occur more
frequently than transversions (substitutions between nucleotides A↔G and C↔T). Thus,
the Kimura model [Kimura, 1980], with a transition and a transversion rate, was proposed. Like the Jukes & Cantor model, this model assumes equal frequencies of the nucleotide bases. The rate matrix of the Kimura model has the form:
Q= A C G T A −2β−α β α β C α −2β−α β α G α β −2β−α β T β α β −2β−α
Other more complicated DNA substitution models were proposed later. For instance, the F81 model [Felsenstein, 1981] was inspired by the Jukes-Cantor model with only one rate parameter, but the equilibrium frequencies are not assumed to be equal. In the HKY85 model [Hasegawa et al., 1985], the principles of the F81 and the Kimura model were combined: the rate of transversion and the rate of transition are distinguished and the frequencies are