Abstract
In this chapter we present normative and psychometric data for the Dutch version of the Bayley Scales of Infant Development - Second edition. The BSID-II-NL consists of a translation of the original materials and a Dutch standardization for the Mental, Motor and the Behavior Rating Scale. The Dutch translation of the BSID-II was made in such a way as to stay as close to the original version as possible. Only two important adaptations are made: a broadening of the basal and ceiling level and a different factor structure of the Behavior Rating Scale. Studies on the psychometric qualities proved the BSID-II-NL to be reliable and valid.
2.1 Introduction
This chapter introduces the Bayley Scales of Infant Development – Second edition - Dutch version (van der Meulen, Ruiter, Lutje Spelberg en Smrkovsky, 2002) and presents its normative and psychometric data. The adapted versions for use with prematurely born infants, infants with hearing loss and/or speech or language problems, children with visual impairments and children with motor impairments are based on this standard instrument for assessing the mental and motor development of young children. The addition “-NL” refers to the Dutch translation and adaptation of the test material and the addition of a Dutch standardization to the original instrument BSID-II (Bayley, 1993).
The decision to develop a Dutch translation and standardization of the second edition of the Bayley test, the BSID-II was made because of the necessity of updating the norms and replacing the dated materials of the “old Bayley”, the BOS 2-30 (van der Meulen & Smrkovsky, 1983). A second important consideration was that with the release of the BSID-II-NL, the good reputation of the Bayley scales in the field of early child diagnostics in the Netherlands could be preserved.
In this chapter the following research question is answered: Is the Dutch
translation and adaptation of the BSID-II a valid and reliable instrument for individual developmental assessment?
The justification of the standardization and results from validity and reliability studies with the BSID-II-NL provides us with the answer to this research question.
This chapter is arranged as follows: paragraph 2 is a summarized overview of the construction of the BSID-II-NL. The construction phase was concluded by a pilot study that was used to examine the experimental version of the BSID-II-NL. Based on the results of the pilot study and the experiences and observations of the test administrators, the final version of the BSID-II-NL was constructed. The most important results and caveats are treated in this paragraph. The final test instrument is described in paragraph 3. A standardization study was performed on this final instrument. Paragraph 4 contains a justification for this study. In the United States extensive studies were performed on the psychometric qualities of the BSID-II. These studies proved the instrument to be both highly reliable and valid (Matula & Aylward, 1997). That a test is considered reliable and
valid in the United States may be a good indication that the same holds for a Dutch translation and adaptation, but it can not be guaranteed (Drenth & Sijtsma, 1990). That’s why a separate study was conducted in the Netherlands to determine the psychometric qualities of the BSID-II-NL. Paragraph 5 gives account of the results of several studies into the validity and reliability of the test. The correlation between test results and background variables is discussed in paragraph 6. Finally, in paragraph 7, the use of the instrument in the field of orthopedagogics is discussed.
2.2 Construction of the BSID-II-NL Development of the pilot version
The Dutch translation of the BSID-II was made in such a way as to preserve the original meaning of the item instruction as closely as possible. Adaptations to the text were only made in two forms: first some minimal adaptations to the text were made that were necessary for understanding the item content, for instance translating American measures to the metric system. Secondly, some of the possible answers were adapted, in which American terms like “sneaker” for shoe or brand names like “Chevy” for a car were changed to Dutch alternatives. Thirdly, a summarized overview of the information in the original BSID-II manual concerning theoretical background and construction of the new scales was added to the Dutch manual. Finally, based on a literature study (Sarneel, 1999), the decision was made to include broader basal and ceiling rules for the Mental and Motor scales in the Dutch version.
Publications concerning the BSID-II (e.g. Gauthier, Bauer, Messinger & Closius, 1999; Washington, Scott, Johnson, Wendel & Hay, 1998) show that the division of the Mental and Motor scales into item sets (belonging to certain age groups) and the accompanying basal and ceiling rules can be the cause of a less accurate estimation of the developmental level of a child. Because of the item sets and the strict basal and ceiling rules a child is only tested outside of the original item set when it performs exceptionally well or exceptionally bad. Therefore, the choice of the initial item set affects the test scores of the child. For this reason the decision was made to require a broader basal and ceiling rule for the Dutch version, that provides a broader but also a more accurate picture
of the developmental level of a child. An extended description of the item sets and the basal and ceiling rules of the BSID-II-NL is given in paragraph 3 of this chapter.
A pilot study was carried out with the experimental version of the BSID-II-NL intended to verify if the translation of the original materials was well phrased and suited for the target group. Subsequently, it was important to determine if the original arrangement and sequence (based on item difficulty) of the items in the item sets could be maintained.
With the results of the pilot study, the final instrument could be constructed to develop the Dutch standardization and determine the validity and reliability of the BSID-II-NL.
The pilot study
Sample. The experimental version of the BSID-II-NL was administered to 235
children in the age group of 1 month to 3.5 years old. All children were experiencing normal development, i.e. until the moment of testing the children had not been diagnosed and/or treated for developmental problems. For all children Dutch was the primary language. Randomized recruitment was conducted via the provincial inoculation administration in Groningen. Table 1 summarizes the sample by age group and sex.
Table 1
Number of children per age group and sex in the sample
Age group Girls Boys Total
1 12 9 21 3 16 15 31 4 10 9 19 7 9 22 31 11 15 13 28 15 15 16 31 18 10 12 22 24 16 15 31 40 10 11 21 Total 113 122 235
Procedure. All tests were administered in the playroom of the department of
Orthopedagogics of the University of Groningen and by either graduated orthopedagogues or master students orthopedagogy. All took part in a brief training in the administration of the BSID-II-NL and were counseled on a weekly basis during the pilot study. In as far as was possible, all children who were registered by their parents were tested, if their age corresponded with one of the age groups that were determined beforehand. For children younger than 24 months a margin of one week younger or older than the exact age was allowed. For children older than 24 months, 2 weeks difference was allowed. The age groups were selected in a way that ensured that every item would be administered in at least one of the age groups.
Results. The first aspect of this pilot study concerned phrasing and content of the
translated test procedure and item instruction. The most important results of the pilot study with regard to test procedure, item instructions and play material of the Mental and Motor scale and the Behavior Rating Scale (BRS) are discussed.
Concerning the test procedure it was found from experiences of the test administrators that the order of administration of the items as is noted on the cue sheets (the advised order of the items based on needed play materials and content) is preferable to administering the items in order of difficulty, as on the score form. This cue sheet order should however not be compulsory. The directions in the manual with regard to the testing procedure rightly denote that item order and the order in which Mental and Motor scales are administered depend on the child and on the testing situation.
Experiences of the test administrators with the BSID-II-NL and a further examination of the pilot version have led to improvements in the item content (corrections of errors, addition of missing information) and phrasing (correcting grammatical errors and ambiguities).
From experiences with the play material it became clear that among others the stimuli booklet and the doll broke easily. It was advised to replace these materials with more solid specimens. Also, it was found that the play materials in different testing kits were not the same in all instances. This was true for instance for the bunny, the car and
the booklet for reading to the children. The BSID-II-NL is a standardized test and therefore care should be taken to create conditions as similar as possible for each test administration, which also means providing the same play materials. Apart from the remarks mentioned above, the play materials were generally judged to be attractive and suitable for the target group and skill to be measured.
The second aspect of the pilot study concerned the division of the BSID-II-NL into age groups based on the original (US) item difficulty. The most easy (first) item in the age group is performed correctly by 95% of the children and 10% of the children receive a positive score on the most difficult (last) item. The p-values (item difficulty) of Dutch children in the pilot study deviate from these values. In all age groups we found lightly to strongly fluctuating p-values. While it is true that the last items administered in an age group have lower p-values, a 95% - 10% difference could not be found. Further analysis of these results gave no cause for changing (the item compilation of) the age groups or the order of items in these age groups. A calculation of correlation between the item numbers and p-values per item set gives a sufficiently negative correlation, see table 2. This table shows that the items are progressively more difficult; the more negative the p-value, the better the correlation is between item number and difficulty level. The small fluctuations in p-values are, in light of the limited sample, not enough reason to change the item order and by doing so the content of the item sets.
Table 2
Correlation between item numbers and p-values per item set on the Mental and Motor scale
Item set Mentale scale Motor scale
1 -.76 -.60 3 -.52 -.76 4 -.65 -.79 7 -.72 -.72 11 -.82 -.83 15 -.74 -.51 18 -.83 -.73 24 -.80 -.55 40 -.62 -.71
No special attention was paid to the Behavior Rating Scale. The reasons for not doing this were that the clear phrasing of questions and possible answers gave no cause to expect a need for modifications in the BRS based on the results of the pilot study and that the limited size of the pilot study did not make it possible to perform a factor analysis to investigate the original (American) factor structure of the items in separate age groups. Only a few corrections to the text were made based on experiences of the test administrators in the pilot study.
Conclusion
Except for the broadening of the basal and ceiling rules and some changes in the wording, no significant changes were made to the testing procedure or item instructions of the three scales. No cause was found to adapt the original age group division or item order in the final version of the Dutch version of the BSID-II. In the standardization study, items are to be administered in the order specified on the cue sheets. As is noted in the manual, this order is not compulsory. The order is advised, but can be changed if circumstances or the child ask for it. In the standardization study, after each test all
questions of the BRS are to be answered by the test administrator. The results collected in this way will be used as the basis for a factor analysis to investigate the original factor structure and adapt this to the Dutch situation if needed.
After the results of the pilot study were processed, the final instrument was put together. The content and characteristics of the BSID-II-NL are summarized in the next paragraph.
2.3 Description of the final version of the BSID-II-NL
A summary is given of the content and characteristics of the final instrument (a comprehensive description is provided in Van der Meulen, Ruiter, Lutje Spelberg & Smrkovsky, 2002). For reasons of legibility only BSID-II-NL is mentioned. Apart from some (aforementioned) differences, the text also applies to the original (US) BSID-II.
Three scales
The Bayley Scales of Infant Development have been constructed in such a way as to present the child with tasks and situations that are expected to be of interest to the child. The instrument comprises three scales: the Mental scale (178 items), the Motor scale (111 items) and the Behavior Rating scale (30 items). The items of the Mental and Motor scale are scored dichotomously (positive/negative), answers to the questions in the BRS are awarded a score from 1 to 5.
Most of the items in the Mental and Motor scale are task items. In these items, the test administrator must try to produce wanted behavior in the child by presenting stimuli. Some of the items don’t use stimuli, they have to be observed spontaneously. The BRS contains two questions for the parent/caregiver in which the parent/caregiver can indicate if the test accurately reflects the child’s skills. Next to these questions, the scale comprises a series of items that allow the test administrator to judge the behavior of the child during the test.
The Mental scale consists of 178 items that measure the child’s cognitive skills. The Mental scale consists of items related to the processing of visual and auditive information, eye-hand coordination, imitation, language development, memory and problem solving.
After administrating the Mental scale a raw score is calculated (RSMS) and a mental
development index (DIMS) is determined. A 90% reliability interval is also provided, and
it is possible to determine how the score should be classified: seriously delayed, delayed, normal or accelerated development. For an example, see appendix 1.
The Motor scale (MR) consists of 111 items that measure skills related to gross and fine motor control, including movements like rolling, crawling, standing, walking, running and jumping. This scale also tests fine motor manipulations, such as eye-hand coordination, adjusted use of writing materials and imitation of hand gestures. For the Motor scale a raw score (RSMR), a motor development index (DIMR), a reliability interval
and a classification are also determined (as in the Mental scale). For an example, see appendix 2.
The Behavior Rating scale consists of 30 items, the first two of which are questions to the parent of the child. This scale is administered after the Mental and Motor scales and is meant to measure the behavior of the child during the test. Behavior and disposition of the child are judged, based on level of alertness, adaptation to surroundings and quality of motor skills. For an example, see appendix 3. Scoring all items on a five points scale and describing the score on the scale improves the reliability of the scale and facilitates scoring and interpretation. Items are grouped in three age groups: 1 – 5 months, 6 – 12 months and 13 – 42 months. Scores on the items of the Behavior Rating scale are differentiated by age groups into factors and total score. For each age group three behavioral factors can be determined and a total score. These factor and total scores are expressed in terms of percentiles. A description of the original factors here is of little use due to the still unknown results of the factor analysis of the results of the data from the standardization study. To determine whether the American factor structure also applies to the Dutch situation a large amount of data is needed. The final structure of the Behavior Rating scale is described later in this chapter.
Test procedure
Bayley’s opinion on the structure and the process of child development has allowed for a flexible administration of the test within a standardized procedure. In the manual, specific directions are given for presenting items to the child. The order and the
speed with which items are administered depend on a combination of factors, including the age of the child, its disposition and the success rate on related items. Despite the flexible administration procedure, the BSID-II-NL can be characterized as a so called power test. A power test is a test in which the items are presented in order of increasing difficulty. This means that the difficulty of items that are administered in a certain age group range from very easy to very difficult.
For reasons of time limitation (and frustration limitation for the child) and uniformity, item sets were classified according to a broad range of items correlated to the child’s age. The item sets show some overlap; the most difficult items for 9-month-old children are for instance the easiest ones for 13-month-old children. The item sets are arranged in such a way as to make the content range of the item set large enough to fix the basal and ceiling value within a single item set, and also to establish sufficiently differentiated scores. Because of the classification of items into age groups, ceiling and basal rules are established instead of cut-off rules. These rules indicate when the lower and upper limit have been reached. If a limit is not reached, the extra items of related item sets will be administered, that are not included in the original item set. The Dutch version of BSID-II has adapted basal and ceiling rules. Instead of at least five positive items within the item set on the Mental Scale, a child performing the BSID-II NL should score at least eight positive items to reach the basal level in the item set. In the Dutch version the child has to perform better to stay within the item set, about a third of all the items have to be scored positive. If a child happens to perform well in one area, say building blocks, this one skill is not enough to reach the basal level. The ceiling level has also been adjusted so that it is easier to administer items outside the item set. In the original version, the Mental scale has a ceiling level of three negative items, in the Dutch version a maximum score of five negative items is a reason for administering items from a higher item set. For the Motor Scale the basal and ceiling levels have been adjusted to five positive items and three negative items respectively. By extending the limits, an item set will become less rigid; the child is less likely to get ‘stuck’ in the initial item set. The child has to achieve more positive scores to reach the basal level, thus having to return more often to a lower item set. In order to reach the ceiling level the child must have more negative scores. By doing this, the item set at the start will exert less influence on
the final test result. By going back or moving up from an item set the examiner is given a broader picture of the child’s development. Table 3 provides an overview of the original (US) and adjusted (NL) basal and ceiling rules.
Table 3
Comparison of the original (US) and adjusted (NL) basal and ceiling rules
Original (US) Adjusted (NL)
Mental scale Motor scale Mental scale Motor scale
Basal is reached when: 5 items positive 4 items positive 8 items positive 5 items positive Ceiling is reached when: 3 items negative 2 items negative 5 items negative 3 items negative Conclusion
The BSID-II-NL is a translation of the original BSID-II and only one significant change is made prior to the standardization study: the use of adapted basal and ceiling rules for the Mental and Motor scale. Other than this, the original instrument has remained unchanged both in structure and in content. Based on the results from the standardization study, additional changes will be made. Naturally, this entails the development of Dutch norms, but also a determination of the item difficulty and final factor structure of the Behavior Rating scale. The next paragraph describes the standardization study and its implications on the structure and content of the BSID-II-NL
2.4 Dutch standardization
To provide valuable information regarding a child’s developmental level, it is necessary to compare test results of a child to results of children in its age group, but also to compare test results between different ages and to compare with results achieved on comparable tests. By converting raw scores into standardized norm scores, age is taken into account. Raw scores were converted to normalized standard scores with a mean of
100 and a standard deviation of 15. Such scales are used for most development and intelligence tests, enabling us to compare the scores. This paragraph describes and justifies the standardization study of the BSID-II-NL.
Sample
The standardization study was based on the test results of 1909 Dutch children. The study was conducted at four centers: the department of Orthopedagogics of the University of Groningen (UoG), the department of Medical Psychology of the University Medical Center Groningen (UMCG), the department of Pediatrics – Neonatology of the Sophia Children’s Hospital, Erasmus Medical Center Rotterdam (Sophia) and the department of Child Psychiatry of the University Medical Center Utrecht (UMC Utrecht). It involved children experiencing normal development, i.e. until the moment of testing the children had not been diagnosed and/or treated for developmental problems. For all children, Dutch was the primary language.
Initially, in the set-up of the standardization study, a division was made into 10 age groups, with the groups selected in a way to assure that all age groups would have sufficiently differentiated scores. Later, when data from other centers was made available, the number of age groups was expanded. In each center, recruitment was conducted in a different way. The sample at the UoG was constructed with the help of the Provincial inoculation administration. The main reason for contacting parents through this organization was that all children are registered here in connection with the national inoculation program. The group of 18 month old children was selected differently: this group participated in a study at the University Medical Center Groningen into the effects of PCB-levels in mothers on the mental and motor development levels of the 18 month old child. The UMCG-group also comprised Dutch speaking children participating in a study into the effects of breastfeeding or bottle feeding on the developmental level at approximately 18 months old. Ultimately, children were tested in the ages of 17 to 24 months that were born after a pregnancy without complications, and without having been diagnosed or treated for developmental problems until the moment of testing. All children in de Groningen sample lived in the city or province of Groningen. The children of the Sophia group from Rotterdam also participated in a national study into the effects
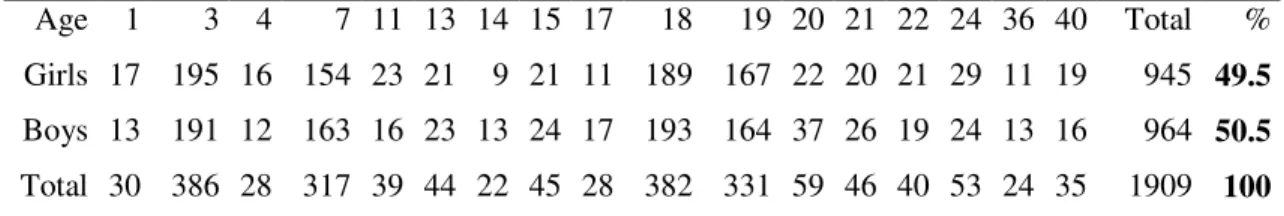
of PCB-levels in mothers on the psycho-motor and mental development levels of the 18 month old child. For this group of children the characteristics named above also apply. The test subjects presented by the UMC Utrecht participated in a study into the effects of hormones in the prenatal and neonatal period on the development of the brain and development of behavior, cognition and physiology. These participants had been born in normal single child pregnancies, where because of age (96%), medical history (3,3%) or other medical reasons (0,7%) an amniocentesis was performed. This produced a group of children in the ages of 13 and 14 months old. It should be noted that a small number of children in the UoG sample are present in the sample more than once (in different age groups). The children in the sample of the Sophia group were all tested when they were 3 months, 7 months and 18 months old. Because the children all met the inclusion criteria and because of the large numbers of children in these age groups, we expect them to reflect the population in the Netherlands in these age groups. Besides this, we do not expect any measurement effect as a result of the young age of the children, large intervals between two test administration and because of the structure of the BSID-II-NL itself. Table 4 gives an overview of the number of children per age group and sex in the standardization study.
Table 4
Number of children per age group (in months) and sex
Age 1 3 4 7 11 13 14 15 17 18 19 20 21 22 24 36 40 Total %
Girls 17 195 16 154 23 21 9 21 11 189 167 22 20 21 29 11 19 945 49.5
Boys 13 191 12 163 16 23 13 24 17 193 164 37 26 19 24 13 16 964 50.5
Total 30 386 28 317 39 44 22 45 28 382 331 59 46 40 53 24 35 1909 100
From the table it is apparent that the number of subjects per age group differs. These sometimes large differences in numbers of children per age group and the unequal intervals between the age groups are largely compensated for by the standardization method. This is because the norm tables have been constructed through a procedure that is based on the scores of all age groups together. (For an explanation of the normalization method, see later in this paragraph).
Because the children from the city and province of Groningen for the most part live in “white” living areas, the number of children with an ethnic background is expected to be low. Because of the more culturally mixed living areas in Utrecht and Rotterdam, this may be different for the children of the UMC Utrecht group and the Sophia Rotterdam group. Table 5 gives the education level of the parents of the children participating in the standardization study. This data is compared to Statistics Netherlands data (Statistics Netherlands (or Centraal Bureau voor de Statistiek (CBS) in Dutch) is the Dutch Census bureau) for the year 1999. This is the year in which the gathering of standardization data was started. The age group of 30 – 34 years old was chosen since it was assumed that this interval closely approximates the average ages of parents of children in the sample.
Table 5
Education level of parents in the standardization sample vs. population averages (provided by the CBS) in percentages
Education level Standardization sample BSID-II-NL
CBS data (1999; 30-34 y/o)
Male Female Male Female
Low* 26.1 22.5 27.9 25.3
Middle* 40.8 49.3 43.3 47.5
High* 32.3 27.7 28.7 27.2
*The education level of parents has been subdivided into three groups:
- Low: In the Netherlands: Basisonderwijs, LBO, VBO en MAVO) - Middle: In the Netherlands: HAVO, VWO en MBO)
- High: In the Netherlands: HBO en WO)
Because of differences in coding between the different study centres a further differentiation in education levels is not possible. The CBS data from 1999 has therefore been divided into the same three categories. It is clear from the table that the percentages of parents participating in the standardization study in different education levels closely match the levels of the total population of the Netherlands. A goodness of fit test (
-square test) confirms this. There seems to be a dependency between education level and the type of sample (BSID-II-NL versus CBS) both for men, ² (2, N=1909) = 13.20, p<.01 and women, ² (2, N=1909) = 7.29, p<.05. However effect size-indices for Chi-square tests for contingency tables were small (see Cohen, 1988, p. 224-225) both for men (w=.08) and women (w=.06).
Procedure
During testing, conditions were made as similar as possible for each child. All tests were administered in specially equiped rooms in the study centers. Only a few of the tests were administered at home, under conditions closely approximating those at the centers.
De tests were administered by well-trained and experienced test administrators, usually in the presence of a parent/caregiver. In total, 37 test administrators participated in the project, divided over the four study centers. By extended training and monitoring by the project lead during the study we have tried to minimize the effect of variations in the behavior of the test administrators. The tests of children in Rotterdam and Utrecht were administered by experienced orthopedagogues and psychologists with extensive experience in testing young children. In the case of the children in the Groningen group, the tests were administered by master students orthopedagogy that had received an intensive, two-day training in the test instrument. After this training they first assisted more experienced test administrators and video tapes of the first test administrations were made. Those tapes were discussed extensively. During the test period, weekly evaluation sessions were held to compare notes and experiences. These regular evaluation sessions made sure that test administrators were constantly aware of their behavior during the test administrations and of the importance of strictly maintaining the test procedures and item instructions.
Results
After the test administration with the BSID-II-NL, raw scores for the MS and MR are calculated that are converted to normalized standard scores by means of norm tables, called Development Indices (DI). The Behavior Rating scale produces a number of factor scores and a total score. The raw scores of the BRS are converted as well by means of norm tables, only this time in terms of percentiles (as for the original BSID-II).
Mental and Motor scale. Table 6 lists the raw scores on the Mental and Motor
Table 6
Overview of mean raw scores (Mean RS) and standard deviation (SD) per age Group on the Mental and Motor scale
Mental Scale Motor Scale
Age (months) Mean RS SD n Mean RS SD n 1 11.47 3.32 30 11.67 2.17 30 3 31.42 3.20 386 22.23 2.31 386 4 42.64 2.79 28 25.54 1.82 28 7 63.44 3.11 317 39.16 4.00 317 11 78.62 3.01 39 58.31 2.75 39 13 88.79 4.21 43 60.42 3.39 43 14 92.59 5.75 22 63.55 3.50 22 15 97.49 4.87 45 67.31 7.83 45 17 109.21 6.69 28 75.68 2.55 28 18 109.87 6.05 382 75.20 3.17 381 19 113.02 6.49 331 76.38 2.72 331 20 117.36 6.33 59 78.98 3.58 55 21 119.82 8.70 45 80.04 3.69 45 22 124.55 6.97 40 82.15 3.22 40 24 129.94 6.98 52 83.23 3.72 53 36 156.54 4.21 24 100.13 4.48 24 40 163.06 5.76 35 104.11 2.63 35 Total 1906* 1902*
- Age (months): Age in months; Mean RS: mean raw score; SD: standard deviation; n: number of children
* The totals don’t add up to 1909 because both scales were not administered to all children.
The norm tables for the Mental and Motor scale are constructed through a method that uses a fit procedure based on the score differentiation of all age groups together (a
method described among others by Snijders, Tellegen and Laros (1988) and Van Eldik (1998)). The basic assumption is that in the test population changes in developmental characteristics change systematically with age. This method was selected for two reasons: first of all, the number of test subjects per age group was too small to determine the norms in the classical way, i.e. separately per age group with sufficient reliability. The limited sample size for the norm groups increases the chance of random fluctuations, especially at the ends of the score range. The second reason was that the fit-procedure produces a regression equation that enables the construction of norms for the empirical age groups, but also for the (intermediate) age groups that were not studied.
First, temporary normalized standard scores were determined per age group from the raw scores using a non-linear transformation as described by Lienert (1961, p. 336-344). First the cumulative frequency distribution of raw scores for each age group in the standardization sample was determined, after which the normalized z-scores for these cumulative proportions are determined (with a continuity correction). These z-values are then transformed to a distribution with mean = 100 and standard deviation = 15. As stated, these temporary normalized standard scores are not very reliable because of the sometimes small number of test subjects per age group. For this reason we performed a gradual non-linear regression analysis for a combination of all age groups, using the temporary normalized standard score as dependent variable and age and raw score as independent variables. This procedure produced a non-linear regression equation that could then be used to calculate final standardized scores based on raw score and age.
For the MS, it was not possible to get a good fit for all ages combined. After inspecting the development of the raw scores with age, it was decided to perform two separate analyses: one for the age groups of 1 through 13 months old, and one for the age groups 7 through 42 months old. In doing so it was possible to get a good fit; this means that the multiple correlaties between the final standard scores and the preliminary standard scores are sufficiently high and the number of predicting variables is as low as possible. If needed, corrections are made for not complying to the requirements set by Laros and Tellegen (1991, p. 43): for each specific raw score the final standardized score must decrease as the age increases and per age group final standardized scores have to increase as the raw score increases. Using the final norm scores, norm tables were
constructed for the entire age range. Because of the rapid development of children younger than 12 months, the norm tables list norms per half month for this group and per full month for children of 12-42 months old. For the regression equations of the Mental and Motor scale, see appendix 1.
Behavior Rating scale. Using the Dutch test data a principal components analysis
was used to determine if the original (US) factor structure and division in age groups could be maintained in the BSID-II-NL. It was found that this structure and division could not be maintained. Only the correlation between the scores on a group of (motor) items of the Behavior Rating scale and the factor “motor quality” corresponded to the American results. The results of this component analysis then led us to perform a second component analysis, this time using two factors. The structure of the ‘factor loading’ found in this way confirmed that based on the Dutch data, the behavior factor structure is less differentiated than the US structure. The number of age groups has been reduced from three to two and the number of specific behavior factors for each age group is two, one less than in the US version. For the BRS percentiles were determined for the raw scores. Because here we standardized for combined age groups (with sufficient numbers of children) a fit procedure was not necessary. The percentages were calculated directly from the cumulative proportions, corrected for continuity.
Developmental indices
Based on the standardization method described above, norm tables were constructed. Using the norm tables, raw scores in the Mental and Motor scales can be converted to developmental indices (standard scores). These show how a child is developing compared to other children of the same age, but also compared to children of a different age. The developmental indices for both scales have, just as for the IQ, an mean value of 100 and a standard deviation of 15, with a lower limit of 55 and an upper limit of 145. Using internal consistency, 90%-reliability intervals for the developmental indices were determined for each age group (in this case “probability-intervals” as defined by Evers, van Vliet-Mulder & Groot, 2000, p. 1407 are meant). For the age groups in the study these were based on the reliability coefficients that were found; for other age groups they were based on interpolated reliability coefficients.
Developmental age equivalents
The mental and motor capabilities of a child can also be expressed in terms of so called developmental age equivalents. This expresses the score in terms of the age at which a child with a developmental index of 100 (being the mean for that age) would (on average) achieve the measured raw score. With some care these developmental age equivalents can be calculated for children that are too old to apply the norm tables, but achieve a score that corresponds to the mean score of younger children, or to children that are younger than 42 months old, but achieve a score that is outside of the norm tables. For the latter group of children it is possible to add a (in this case more significant) developmental age equivalent determination to the developmental index < 55.
Conclusion
Because of the standardization method that was used, full use was made of the large number of children in the standardization sample. By incorporating the scores of all age groups into a continuous function of age, it becomes possible to determine norms based on the test data of all children combined. This method has many advantages, but in this case it is a necessity, because of the influence of sample variations in the age groups with small numbers of children and because of the uneven distribution of children over age groups. The smaller the number of children, the larger the influence that random and/or extreme scores exert on the mean score of the group. By using the results for all age groups in the standardization of the BSID-II-NL, it is possible to compensate for the influence of random fluctuations by using scores of children in adjoining age groups. This eliminates the need for large numbers (at least 100) of children in evenly distributed age groups.
In the case of the BSID-II-NL, all standardization data had to be gathered in a relatively short period and with very limited means. The size of the study in combination with time limitations and the limited means available were not conducive to selecting the sample. The time limitations were caused by the desire to replace the BOS 2-30 as soon as possible because of its dated norms and the unavailability of the test material. Because of this it was decided to release the test in parts. This lead to a first publication of the
manual and standardization and later in a second publication with the technical foundation.
With regard to the Behavior Rating scale the BSID-II-NL has a different factor structure. It was not possible to sufficiently substantiate the original factor structure using the data from the Dutch standardization study.The factor structure in the Dutch version is less differentiated: the number of age groups was reduced from three to two and the number of specific behavior factors is two for each age group, one less than in the US version.
2.5 Instrumental utility
In the United States extensive studies were performed on the psychometric qualities of the BSID-II. These studies proved the instrument to be both highly reliable and valid (Black & Matula, 2000). That a test is considered reliable and valid in the United States may be a good indication that the same holds for a Dutch translation and adaptation, but it can not be guaranteed (Drenth & Sijtsma, 1990). That is why a separate study was made in the Netherlands of the psychometric qualities of the BSID-II-NL. To examine the instrumental utility, we conducted several reliability and validity studies. We assessed internal consistency, test-retest reliability, stability and inter-rater reliability. To assess construct validity, the relationship was examined between the BSID-II-NL and comparable widely used Dutch instruments. Finally, we discuss the relation with background variables.
Sample
To assess the instrumental utility of the BSID-II-NL, three different samples were analyzed. To determine internal consistency, the data of the standardization sample was used, sample 1 (n=1909). For assessing test–retest reliability, inter-rater reliability and construct validity, sample 2 was constructed by sending a letter to all the parents of children participating in the UoG standardization sample, asking them to contact us in case they were willing to participate in a second test with their child. This provided us with a group of children that partially consists of children that also participated in the standardization sample. We added subjects to this sample by inviting (mostly younger)
siblings of these children to participate. This sample 2 consists of 168 tested children between the ages of 3 and 42 months old (Zwart, 2004). The only criteria for inclusion were that each child should be healthy and between 0 and 42 months old. On the basis of the age level of the children different ‘sub-samples’ were constructed to be used in separate validity and reliability studies. Some of the children in sample 2 took part in more than one study. For example some children were examined twice with the BSID-II-NL (test-retest reliability) and one of the administrations was observed by an inter-rater (inter-rater reliability). The sub-samples described for each study belong to sample 2. To assess stability (long term reliability), sample 3 was used. The third sample consists of children (n=62) that were taking part in the UMCG study into the effects of PCB-levels. These children were tested at 18 months of age (and included in the standardization sample) and again at 30 months of age. Table 7 shows the division of the children in the different sample studies.
Table 7
Characteristics of the sample “instrumental utility” for the different test combinations
Age in months sex
Test combination Sample n mean range boy girl
Reliability
Internal consistency 1 1909 See table 8
BSID-II-NL test-retest 2 34 20.8 4.0-39.2 13 21 BSID-II-NL inter-rater 2 35 20.7 3.0-42.0 20 15 BSID-II-NL stability 3 62 18.2* 18-19* 36 26 Construct validity BSID-II-NL vs. BOS 2-301 2 43 17.4 3.0-30.0 19 24 BSID-II-NL vs. SON 2½-72 2 28 37.2 30.0-42.0 11 17 BSID-II-NL vs. GOS 2½-4½3 2 28 33.8 30.0-41.0 17 11
* At second measurement (30 months): 30, 44 (30-31)
1 Bayley Ontwikkelingsschalen 2-30 maanden (Van der Meulen & Smrkovsky, 1983) 2 Snijders-Oomen Niet-verbale intelligentietest 2½-7 jaar (Tellegen, Winkel,
Wijnberg-Williams, & Laros, 1998)
3 Groningse Ontwikkelingsschalen 2½ - 4½ jaar (Neutel, Van der Meulen & Lutje
Spelberg, 1996)
Procedure
All children, in sample 2 and 3 were tested twice. Some were tested twice with the BSID-II-NL as part of the reliability studies, others were tested with the BSID-II-NL and either with the BOS 2-30, the SON 2½-7, or the GOS 2½-4½ to assess construct validity. From here on, we will refer to such a combination as a test combination. All the tests were administered by well-trained and experienced test administrators, usually in the presence of a parent/caregiver. Care was taken to ensure that both tests were administered under circumstances that were made as similar as possible; if possible, children were tested at the same time of day and in the same room. The order in which the tests were administered was varied as much as was possible. Some children were tested with the
BSID-II-NL first and then with one of the others, other children were tested with the other test first. This was systematically varied.
Results
Reliability. There isn’t a single measure for the reliability of a test. By assessing
different forms of reliability, an indication of general reliability is given. For the BSID-II-NL, internal consistency, test-retest reliability, long term stability and inter-rater reliability were determined.
Internal consistency was determined based on the data from the standardization
study (sample 1). To determine internal consistency, the Lambda-2 coefficient (Guttman, 1945) was used. According to Ten Berge and Zegers (1978), the Lambda-2 coefficient is a less-known but better estimator for the lower limit of reliability than the more often used alpha-coefficient of Cronbach (1951). Ten Berge and Zegers state that among a number of ways to calculate the lower limit of reliability, Lambda-2 is always larger or equal to the alpha coefficient and therefore is at least as close as the alpha to reliability in the population. For this reason and because of the simplicity of the equation and its long existence, Ten Berge and Zegers advise to use the lambda-2 coefficient to determine internal consistency.
Table 8
Internal consistency calculated with lambda 2 per age group over administered items
Lambda 2
Age group Mental Scale Motor Scale
1 .65 .54 3 .67 .66 4 .51 .26 7 .58 .80 11 .52 .80 13 .74 .88 14 .85 .87 15 .91 .75 17 .84 .76 18 .87 .72 19 .87 .87 20 .94 .80 21 .91 .80 22 .96 .84 24 .88 .77 36 .81 .81 40 .86 .65 Mean .79 .74
Evers, Van Vliet-Mulder & Groot, (2000) indicate in their ‘Documentatie van Tests en Testresearch in Nederland’ (Documentation of Tests and Test research in the Netherlands) that when a test is used for selection purposes, a reliability of higher than .90 is characterized as good, between .70 en .80 as medium and lower than .70 as insufficient. Van Eldik (1998), however, remarks that in the practice of constructing tests, often reliability coefficients higher than .80 are deemed satisfactory.Although the Mental and Motor scale show low coefficients in a number of age groups (Mental: 1, 3, 4 & 40
and Motor: 1, 3, 4, 7 &11) the mean internal consistency coefficients are acceptable. No age groups were excluded in these scales, especially to guarantee the international equivalence of the BSID-II editions and because it is not advisable to exclude a specific age group (e.g. the MR scale for 4 month old children) that is not at the extremes of the age range. The low internal consistency of some age groups is expressed in broad reliability intervals. This means that a score on a (fictitious) immediate re-test can vary substantially.
To examine test-retest reliability, the BSID-II-NL was administered twice within two weeks to 34 children for the Mental scale and 31 children for the Motor scale. The age of the children ranged from 4.0 to 39.2 months, with an average age of 20.8 months. The mean developmental indices, standard deviation of the results and the correlations between developmental indices are listed in table 9. The developmental indices were used for calculations so that age is not a factor in the analysis.
Table 9
Test-retest reliability: correlations and characteristics of the standard scores
Standard scores
First testing Second testing
correlation Mean SD Mean SD n
MS .75** 108.18 11.90 113.09 14.56 34
MR .80** 99.13 18.04 101.23 18.40 31
** Correlations significant with an alpha of .01 (2-tailed) - MS: Mental Scale; MR: Motor Scale
The correlation between first and second testing is acceptable for both the Mental scale and the Motor scale. Table 9 shows that the mean developmental indices increase between the first and second testing, especially on the Mental scale. Discrepancies in scores over this short period of time may be explained by the combination of maturation and, particularly for children 12 months and older, learning effects. The results on the Motor scale closely match the population mean. The results on the Mental scale, however, clearly differ. Children in the sample score about 8 to 13 points higher on the
first and second test administration respectively. The standard deviation of the first administration of the Mental scale also differs. This can be explained because of the small sample that allows extreme values to exert more influence on the mean test score.
Test–retest reliability was also calculated for the Behavior Rating scale . The BRS was filled out twice for 20 children. The scale “adaptation to the environment” was filled out twice for 19 children. The item “alertness” was not included in the calculations of the correlations. “Alertness” only applies to children in the age group of 1 to 5 months old. There were too few children in this age group participating in the study to make calculations of correlations of this item relevant. The correlations (table 10) of the BRS were calculated from the raw scores.
Table 10
Test-retest reliability: correlations of raw scores for BRS and characteristics of the standard scores
Standard scores
First testing Second testing
correlation Mean SD Mean SD n
BRS-adap .49* 74.26 6.67 74.37 7.21 19
BRS-mot .83** 41.55 5.29 41.50 5.82 20
BRS-tot .67** 113.70 11.54 115.85 17.76 20
* correlations significant with an alpha of .05 (1-tailed) ** correlations significant with an alpha of .01 (1-tailed)
- BRS-adap: adaptation to environment; BRS-mot: motor; BRS-tot: total
The reliability (stability) of the BRS is lower than that of the Mental and Motor scale. This is not unexpected. Behavior is, when compared to mental and motor abilities, more sensitive to environmental influences (Bayley, 1993). Besides, the filling out of the BRS allows for a certain measure of subjectivity. This subjectivity is caused by the content of the items and the way they are scored. The items are scored on a scale of 1 to 5 instead of dichotomously, as in the Mental and Motor scales. Also, items are not as
extensively described as in the Mental and Motor scales, leaving more room for personal interpretation, necessitating more care in interpreting the data.
To examine inter-rater reliability, for 35 children, an independent second test administrator was present during testing and also (independently) scored the test. The age of the children in question varied from 3.0 to 42.0 months, with an average of 20.7 months. To expand the available data for inter-rater reliability, a number of test administrations were videotaped. These tapes were later scored by test administrators. The average achieved developmental indices and the correlations between the indices are listed in table 11.
Table 11
Inter-rater reliability: correlations and characteristics of the standard scores
Standard scores
Test administrator Inter-rater
correlations Mean SD Mean SD n
MS .81** 102.40 16.89 100.80 14.16 35
MR .77** 92.96 15.59 89.74 14.63 27
** correlations significant with an alpha of .01 (1-tailed) - MS: Mental Scale; MR: Motor Scale
The inter-rater reliability of the Mental scale is sufficient, and of the Motor scale close to sufficient. The difference in reliability on the Mental and Motor scales can be attributed to the fact that for a correct scoring of some motor skills, one must physically manipulate the child. The inter-rater does not have this possibility. In individual cases this can cause differences. When the quality of the videotaping of the test administration was insufficient, the test was excluded. This explains why not 35 but only 27 children are listed for the Motor scale.
In determining the stability (or long-term reliability) of the BSID-II-NL data was used of children that took part in the standardization study and were later tested again with the BSID-II-NL as part of a follow-up study into the effects of PCB- and dioxin exposure on the mental and motor development of young children. The first test was
administered when the children were 18 months old. The second was administered at the age of 30 months.
Table 12
Stability: correlations and characteristics of the standard scores Standard scores
18 months old 30 months old
correlation Mean SD Mean SD n
MS .58** 97.92 13.36 98.94 11.04 62
MR .33** 89.13 10.36 95.18 16.66 61
** Correlations significant with an alpha of .01 (1-tailed) - MS: Mental Scale; MR: Motor Scale
Since very young children were involved and the interval between tests was relatively large, the expectation was (based on earlier studies, Bayley 1949; Siegel, 1981; Molfese & Acheson, 1997) that correlations would be low on both scales. For the motor scale, this expectation was found to be true. The correlation between results on both tests, although significant, is low (.33). The prediction value on the Mental scale at 18 months for the results at 30 months, however, is substantial (.58), when age and interval are taken into account. On the Motor scale, scores for the second test administration are significantly higher.
Construct validity. For determining the construct validity, the BSID-II-NL was
compared to several other Dutch developmental tests. The choice of instruments to use in the comparison was based on the goal of the test (measuring the Mental development and/or Motor development), the age range of the test (which had to have at least some overlap with the BSID-II-NL), the structure of the test (individual and standardized) and standardization and psychometric qualities (based on data from Dutch children). The tests that qualified, based on these criteria, were the BOS 2-30, the SON 2½-7 and the GOS 2½-4½. The validity study was based on test results of 99 children with an average age of 29.5 months (range: 3.0 to 42.0 months). All children were tested twice inside of two
weeks. All children had either the BOS 2-30, the SON 2½-7, or the GOS 2½-4½ administered next to the BSID-II-NL. From here on, we will refer to such a combination of an administration of the BSID-II-NL and a similar test as a test combination.
For 43 children, the developmental indices on the BSID-II-NL were compared to the developmental indices on the BOS 2-30 (van der Meulen, Smrkovsky, 1983), the predecessor of the BSID-II-NL. The BOS 2-30 is considered to be a valid and reliable test by COTAN (Commissie Testaangelegenheden (COTAN) van het Nederlands Instituut voor Psychologen (NIP), 2001) (Test Advisory Board for the Dutch Psychologists Institute) but with antiquated standardization. There is of course a strong similarity between the BSID-II-NL and the BOS 2-30 as they consist of a substantial number of identical items. However, this similarity is limited by differences in the administration procedure and by the fact that some of the items of the BOS 2-30 have been left out and new items were added. Table 13 shows an overview of the standard scores and correlations.
Table 13
BSID-II-NL vs. BOS 2-30: correlations and characteristics of the standard scores
Standard scores
BSID-II-NL BOS 2-30
correlations Mean SD Mean SD n
MS .57** 108.47 15.33 114.63 16.87 43
MR .52** 103.17 17.41 112.57 20.82 35
** correlations significant with an alpha of .01 (1-tailed) - MS: Mental Scale; MR: Motor Scale
The correlation coefficients confirm the expectation that the tests are correlated, but not highly. Clearly there are differences in the content and structure of the test, but also the young age of the children is expected to be an influencing factor on the correlation. The correlations mentioned have been based on scores that did not take into account the unreliability of the instruments. If we would take this into account, we would have to apply a correction for attenuation (Guilford, 1965). By applying this correction it
is possible to determine how high the correlation between two variables would be if it were possible to determine both variables with perfect reliability. This correction gives a correlation of .68 on the Mental and .67 on the Motor scale. The table shows a significantly higher mean score on both scales of the BOS 2-30 than on the BSID-II-NL, over 6 DI points on the Mental scale and nearly 10 points on the Motor scale. These results confirm the expectation that the antiquated norms of the BOS 2-30 increase the chance of overestimating the developmental level of a child, both on the Mental and the Motor scale.
The BSID-II-NL developmental indices have also been compared to scores on subtests of the Groninger Ontwikkelingsschalen for children between 2½ and 4½ years old (GOS 2½-4½; Neutel, Van der Meulen & Lutje Spelberg, 1996). The GOS 2½-4½ is a Dutch translation and adaptation of the Kaufman ABC (Kaufman & Kaufman, 1983). At the time this validity study was conducted, the GOS was still widely used by Dutch institutions to assess the cognitive abilities of a child. At this time, however, the test material is no longer available due to a difficult license transition. Assuming that the test is still used and will be re-published, the data from this study are still relevant. The GOS 2½-4½ received a good evaluation by COTAN (Evers, Van Vliet-Mulder, Groot 2000) on the most important parts (norm scores, reliability and construct validity). The subtests of the GOS are organized around two ways of processing information: simultaneous (GOS 2½-4½ sim.) and sequential (GOS 2½-4½ seq.). All subtests together form the cognitive scale (GOS 2½-4½ cog.). A significant connection between especially the Sequential scale of the GOS and the Motor scale of the BSID-II-NL is expected. The motor planning and coordination skills as appear in the Motor scale of the BSID-II-NL specifically target the ability to order information sequentially and then process it. In table 14 means and standard deviations of test results on the GOS and BSID-II-NL are listed and in table 15 the correlations between both tests are listed.
Table 14
BSID-II-NL vs. GOS 2½-4½: distribution of standard scores
n Mean Standard deviation
GOS 2½-4½ sim. 28 118.71 13.99
GOS 2½-4½ seq. 24 112.29 18.42
GOS 2½-4½ cog. 24 118.63 13.82
BSID-II-NL MS 28 110.29 11.37
BSID-II-NL MR 28 100.89 14.92
- MS: Mental Scale; MR: Motor Scale
- sim.: simultaneous scale; seq.: sequential scale, cog.: cognitive scale
The high mean scores on the different subtests of the GOS in relation to the test results on the BSID-II-NL stand out. For the cognitive scale of the GOS, for instance, the mean standard score is 118.63, for the Mental scale of the BSID-II-NL the mean is 110.29. The mean score on the GOS even exceeds the range of normal development (85-115).
Table 15
BSID-II-NL vs. GOS 2½-4½: correlations
BSID-II-NL
MS MR
GOS 2½-4½ Sim. -.06 -.13
GOS 2½-4½ Seq. .33 .38*
GOS 2½-4½ Cog. .19 .23
* Correlation significant with p < .05 (1-tailed) - MS: Mental Scale; MR: Motor Scale
- sim.: simultaneous scale; seq.: sequential scale, cog.: cognitive scale
Table 15 shows that the correlation between the different subtests of the GOS and the Mental and Motor scale of the BSID-II-NL is unexpectedly low. Even the correlation between the Motor scale of the BSID-II-NL and the sequential scale of the GOS is low,
though significant. Between the Mental scale of the BSID-II-NL and the cognitive scale of the GOS a very low correlation of .19 was found. Corrected for attenuation the coefficients for the Mental scale are: -.07 (sim.), .41 (seq.) and .22 (cog.) and for the Motor scale: -.16 (sim.), .48 (seq.) en .28 (cog.).
A comparison was also made between the test results on the BSID-II-NL and the
Snijders Oomen Niet-verbale intelligentie test for children between 2½ and 7 years old
(SON-R 2½-7; Tellegen, Winkel, Wijnberg-Williams, & Laros, 1998). The SON-R 2½-7 is a non-verbal, individually administered instrument for assessing cognitive development of children in the age group 2 ½ to 7 years old. The COTAN (Evers, Van Vliet-Mulder, Groot, 2000) evaluates this test as “good” on all parts. The achievements of a child on the six subtests can be summarized in an intelligence score, the SON-IQ. High correlation is expected, especially with the Mental scale of the BSID-II-NL. Means and standard deviations of the developmental indices are listed in table 16. Correlations between the two tests are listed in table 17.
Table 16
BSID-II-NL vs. SON-R 2½-7: distribution of standard scores
n Mean Standard deviation
SON 2½-7 (SON-IQ) 28 106.18 14.00
BSID-II-NL MS 28 105.29 17.01
BSID-II-NL MR 22* 105.86 7.12
* The Motor scale was administered to only 22 of the 28 children - MS: Mental Scale; MR: Motor Scale
In calculating the SON-IQ, “inflation-correction” of the IQ was taken into account. The manual (Tellegen, Winkel, Wijnberg & Laros, 1998) states that the norm scores of the SON-R 2½-7 will age by 1 IQ point every three years.
Table 17
BSID-II-NL vs. SON-R 2½-7: correlations
BSID-II-NL
MS MR
SON 2½-7 SON-IQ .55** .56**
** Correlations significant with p < .01 (1-tailed) - MS: Mental Scale; MR: Motor Scale
The correlation found is sufficient. If we correct for the unreliability (correction of attenuation) of both tests the coefficients are: .65 (Mental scale) and .69 (Motor scale).
Conclusion
The reliability of the BSID-II-NL was tested in a number of ways. The mean
internal consistency coefficient of the mental scale is sufficient: .79 (range .51-.96). The
same holds for the Motor scale: .74 (range .26-.88). The lowest coefficients are found in the youngest age groups. This means that especially in those groups, the tests provide a less accurate picture of the general development of the child in comparison with older age groups. Care should therefore be taken when interpreting the data. Especially for children up to 12 months of age on the Mental scale and the first few months on the Motor scale achieved scores can be significantly higher or lower on re-testing.
The test-retest correlations are reasonable for the mental scale (.75) and high for the Motor scale (.80). The results of the second test administration are higher on the Mental scale in 73% of all cases and in 58% of the cases on the Motor scale. This indicates that in general, experience from earlier testing has a positive influence on the scores of the child. For young children, this might be because of increased familiarity with the testing situation, and in the case of older children by increased familiarity with the test items. For the Behavior Rating scale , test-retest correlations are low (.49) for the factor score “adaptation to the environment” and for the total score (.67). The low correlations correspond to expectations. The items of the Behavior Rating scale are not scored dichotomously but on a scale of 1 to 5, leaving more room for interpretation, and items are less accurately described than in the Mental and Motor scales. The factor
“quality of motor skills” apparently can be determined more objectively, correlation for this factor is high (.83).
Our stability study showed positive outcome. The prediction value of the Mental scale at 18 months old for the results at 30 months old is high (.58) when taken into account the young age of the children at the time of the first test and the long time interval (12 months) between the first and second test. For the Motor scale it is low (.33). This indicates that the skills measured by the Mental scale at 18 months old have a higher prediction value for the more complex skills at 30 months old than the skills measured by the Motor scale. The results on the Motor scale at 18 months old have to be viewed as a random indication with a low prediction value for future development, even more so than results on the Mental scale.
The inter-rater reliability shows for the Mental scale that the test results of a child are hardly influenced by the person that administers the test: correlation between two test administrations by different administrators is high (.81). This also holds, albeit a little less pronounced, for the Motor scale. Correlation here is reasonable (.77).
Construct validity for the BSID-II-NL was tested by comparing the scores on the
BSID-II-NL with scores on similar tests within two weeks. From the comparison of scores between the BSID-II-NL and the BOS 2-30 it is apparent that the tests are substantially related to each other (r = .57 on the Mental scale and r = .52 on the Motor scale), but less than should be expected based on the similarities between the tests. Apparently, the structure and content of the test was changed to such an extent that the BSID-II-NL has become a similar test with the same background, but not simply a successor to the BOS 2-30. A comparison to the GOS 2½-4½ shows that the tests have little in common, despite the claim of both tests to examine cognitive development. Only the Motor scale of the BSID-II-NL and the sequential scale of the GOS have significant correlation. Between the Mental scale and the total cognitive score of the GOS, a correlation of only .19 exists. These results suggest that there is a low amount of overlap in the content of the two tests. A possible explanation might be that that the GOS measures cognitive development in a different way than the BSID-II-NL. The GOS specifically tests the child’s ability to process information, whereas the BSID-II-NL tests more general skills. When taking into account that the SON-R 2½-7 differs significantly
from the BSID-II-NL because of its specific non-verbal character and that, contrary to the BSID-II-NL, de SON-R 2½-7 requires an adaptive test procedure, the correlation between scores on both tests is more than reasonable. Correlation on the Mental scale is .55 and on the Motor scale .56. Higher correlations weren’t expected, because the subtests of the SON-R 2½-7 are more directed at solving problems that require spatial comprehension and the ability to reason abstractly and concretely. These skills are also tested in the BSID-II-NL, but to a lesser degree. Contrary to the SON-R 2½-7, language skills form an important part of the test, especially for children older than 2 ½ years.
There is a verbal version of the Mental scale of the BSID-II-NL. This non-verbal version comprises a selection of, in some cases adapted, items of only the Mental scale. The non-verbal version has norms for the age range of 12 through 30 months old. A comparison of non-verbal developmental indices between the BSID-II-NL and the SON-IQ was not possible because of the not-overlapping age-range of both tests. The non-verbal version of the BSID-II-NL is suitable for children between 12 and 30 months of age and the SON test can only be administered to children of at least 2 ½ years old when a norm score should be determined.
Mean test scores on the tests used for validity determination, were in every case higher than the scores achieved on the BSID-II-NL. For the SON 7 and the GOS 2½-4½, this confirms the general impression from practice experience that the scores on these tests are often somewhat “flattering.” For the BOS 2-30 it indicates that it’s standardization is in fact dated. The high mean developmental indices on the BOS 2-30
confirm the upward drift of norm scores. This pattern, sometimes referred to as the Flynn effect (Flynn, 1999) has been demonstrated in several other cognitive tests for young children (Black & Matula, 2000). The drift is estimated at 3 IQ points per decade (Flynn, 1984, 1987).