611 | P a g e
Fiber Optic Extrinsic multimode Intensity modulated
Temperature Sensor using a U-shaped Solid Glass
Rod – Studies on the Sensitivity of the Sensor
Dr. S. Venkateswara Rao
Department of Physics, JNTUH College of Engineering Hyderabad, Telangana, (India)
Abstract
Optical fibers play a crucial role in converting a change in the magnitude of one physical parameter into a
corresponding change in the magnitude of a second, different parameter, which can be measured more conveniently
and more accurately. Optical fibers are good electrical insulators and they are immune from electromagnetic
interference. The fiber may actually be used as the sensing element, or simply as a flexible waveguide which conveys
light to and from the region of measurement. Broadly, fiber optic sensors may be classified as either intrinsic or
extrinsic. The device in which the beam is guided by a fiber at the measurement region are intrinsic, the other type is
called extrinsic. In the present paper the working of a multimode fiber optic U-shaped solid glass rod based
extrinsic sensor to measure the temperature of liquids is described. The glass rod which acts as an extrinsic sensing
probe is connected between two multimode plastic (PCS) fibers of 200/230 µm diameters at an operating
wavelength of 630 nm. If this sensing region is immersed in a liquid of a fixed refractive index less than the core
refractive index, part of the light injected into the input fiber will get coupled to the second fiber due to the
evanescent absorption through this sensing zone will be a function of the refractive index of this liquid. The small
change in the refractive index of the liquid as a function temperature would lead to a corresponding change in the
evanescent field absorption in the U-bent region of the glass rod and hence in the power reaching the output fiber.
Thus the relation between the temperature and the power reaching the output end is formed enabling to draw a
calibrated curve between temperature and output power to measure temperatures of liquids in the dynamic range
about 30°C to 140°C. This method of measuring temperature helps in obtaining a quick response time of less than a
second and it offers the advantage of remote measurement.
612 | P a g e
I. INTRODUCTION
During early seventies, when the technology of optical fibers for telecommunication was evolving, it was observed that the transmission characteristics of optical fibers are highly sensitive to certain external perturbations like fiber joints, macro-bends, micro-bends, pressure, temperature, strain etc. and certain internal perturbations like refractive index, density in-homogeneity, dopants, presence of OH ions and evolution of hydrogen etc. On the observation of optical fibers to external perturbations, as alternative thought began in the scientific community to exploit this sensitivity of optical fibers, to construct a large variety of sensors and devices [1 – 5]. The main advantages of this technology as compared to conventional electric sensors are, the sensed signal is immune to electromagnetic interference (EMI), safe in explosive environments, reliable and secure with no risk of sparks or fire, used to sense the parameters in otherwise inaccessible regions, resistant to ionizing radiation, affords remote sensing, multiplexing of large number of individual sensors, as they are chemically inert and they can be employed in chemical processes, use in biomedical instrumentation due to their small size and mechanical flexibility etc [6 – 8].
The use of an optical fiber for measurement of temperature, many methods reported in the literature to achieve accurate measurement and to yield higher sensitivities [9 – 12]. The measurement of temperature using plastic optical fibers was studied by several authors across the globe [13]. Using a multimode intensity modulated sensor, a further study carried out employing a U-shaped solid glass rod probe operated at a wavelength of 630 nm source. The temperature sensor using a U-shaped glass rod is more sensitive as compared to the glass rods unbent (straight).
II. EXPERIMENTAL DETAILS
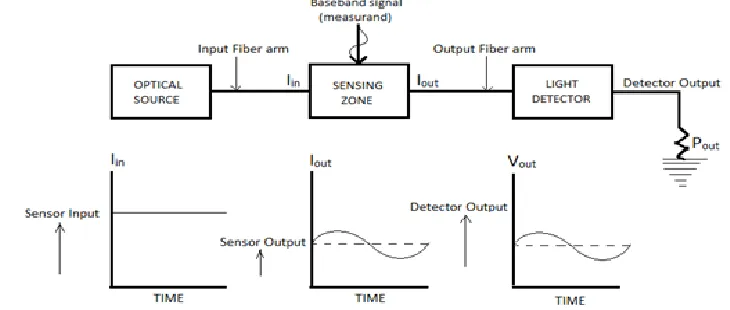
The principle advantage of intensity modulated sensors lies in their simplicity of construction and their being compatible to the multimode fiber technology. Therefore the intensity modulated ones offers the widest range of optical fiber sensors. The general configuration of multimode intensity modulated sensor is shown in fig. 1.
613 | P a g e
From Fig. 1, it is seen that the intensity of the light transmitted through the sensor is seen to be modulated by the baseband (measurand) by the baseband signal which is in the form of a sinusoidal varying quantity. It is completely possible to describe an optical beam by its electric field vector; E. Propagation of a beam through a sensing element can be described by the equation asin
out
T
X
E
E
(
)
out
E
andE
inare electric field vectors of the beam, after and before passing through the sensing element, respectively.T
, describes the optical properties of the sensing probe which are a function of the measurand field X. The measurand may be a vector quantity, such as electromagnetic field of scalar quantity such as temperature. The purpose of the sensor system is to recover the value of the parameter to be measured. This is achieved by measuringin
E
andE
outand hence derivingT
. From a knowledge of the manner in whichT
depends onX
the parameter may be determined. In the present study the measurand selected is the variation of temperature (X
) which changes the optical properties ,T
of the U-shaped glass rod this in turn changes the output electric fieldE
outcorresponding the input electric fieldE
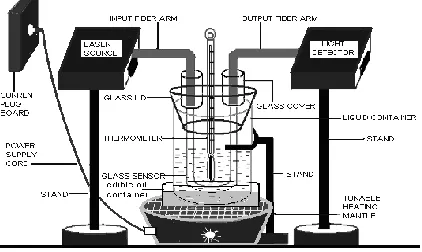
in.In studying the variation of power with temperature and thereby the sensitivity a multimode glass fiber operated at the wavelength of 630 nm is used in the present experiment. The experimental arrangement consists of a U-shaped glass rod connected between the input fiber arm and the output fiber arm. The other end of the input fiber is connected to the light source by using a suitable connector and other end of the output fiber is connected to the bench mark power meter by another connector. The sensor so designed is immersed in a jar containing the liquid (Glycerin). The Glycerin is slowly heated with the U-shaped glass rod dipped into it and the variation of the output power is noted with the power meter at different temperatures. Simultaneously, refractive index (
n
l) of Glycerin at each temperature was also recorded with a refractometer. The experimental setup is pictorially represented in fig. 2.614 | P a g e
The procedure is repeated by connecting a straight (unbent glass rod) glass rod as a sensing probe between input fiber and output fiber. Again, the power variations with change in temperature were noted and tabulated.III. RESULTS AND DISCUSSION
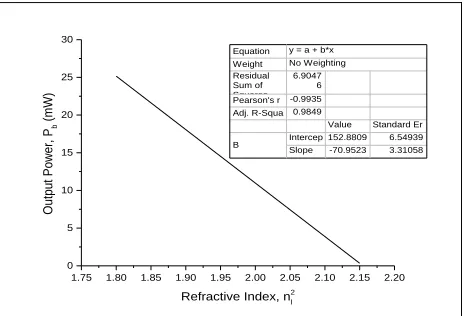
In the case of U-shaped glass rod probe, the power coupled to the second part of the fiber through the U-shaped glass probe increases with the proportional decrease in
n
l2which is illustrated in the plot Pb vs.2
l
n
(fig. 3). As the refractive index of the most of the liquid decreases with temperature due to their decrease in density with increasing temperature, the trend observed is in good agreement with the general physical principles.1.75 1.80 1.85 1.90 1.95 2.00 2.05 2.10 2.15 2.20 0 5 10 15 20 25 30 Out pu t Power , P b (m W)
Refractive Index, n2 l Equation y = a + b*x Weight No Weighting Residual
Sum of Squares
6.9047 6 Pearson's r -0.9935 Adj. R-Squa 0.9849
Value Standard Er
B Intercep 152.8809 6.54939 Slope -70.9523 3.31058
Fig. 3: Variation of output power P
bwith refractive Index, n
l 2U-bent glass probe
The slope of the curve defines the sensitivity of the sensor, as the slope of the curve is,
l
dn
dp
.Thus a change in the measurand (temperature) value per a change in the measurer (light power) value is the sensitivity of the sensor. The sensitivity is the extent of the sensor to measure the lowest value of the parameter to be measured.
615 | P a g e
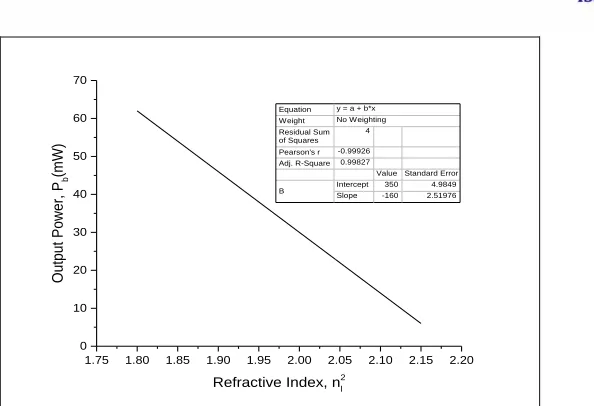
1.75 1.80 1.85 1.90 1.95 2.00 2.05 2.10 2.15 2.20 0 10 20 30 40 50 60 70 Out pu t Power , P b (mW)
Refractive Index, n2
l Equation y = a + b*x Weight No Weighting Residual Sum of Squares
4
Pearson's r -0.99926 Adj. R-Square 0.99827
ValueStandard Error
B InterceptSlope -160350 2.519764.9849
Fig. 4: Variation of output power Pb refractive index, nl2 in straight (unbent) glass probe
Fig. 5: Variation of output power with refractive index with U-bent and straight sensing probes
The difference in variation in sensitivities and especially the rise in sensitivity in U-shaped bent probe can be verifies from the following relation.
Bend
exp(
)
C
R
R
loss
Where, R is the bend radius of the U-bent probe & RC is thecritical bend radius
Thus in case of an unbent glass rod evanescent absorption is less critical as the bend radius is tending to infinity, the absorption of light takes place only due to the liquid with refractive index less than the refractive index of the core of the fiber used. But in the case of U-bent probe, the contribution for the loss of light energy is of two fold, one due to the depth of absorption of the liquid surrounding probe and the other due to the decrease in the radius of the bend. Hence, the U-bend probe offers more loss in comparison to the unbent glass probe.
1.75 1.80 1.85 1.90 1.95 2.00 2.05 2.10 2.15 2.20 0 10 20 30 40 50 60 70 Out pu t Power
, Pn
(mW)
Refractive Index, n2 l with straight probe
616 | P a g e
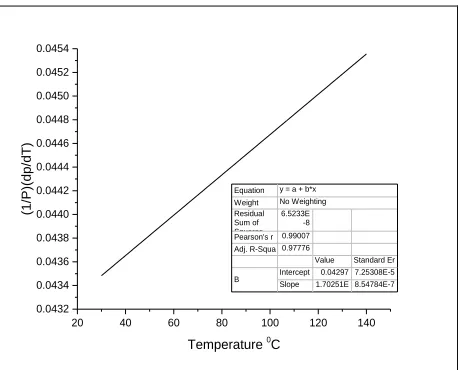
20 40 60 80 100 120 140 0.0432
0.0434 0.0436 0.0438 0.0440 0.0442 0.0444 0.0446 0.0448 0.0450 0.0452 0.0454
(1
/P)(d
p/d
T)
Temperature 0C
Equation y = a + b*x Weight No Weighting Residual Sum of Squares
6.5233E -8 Pearson's r 0.99007 Adj. R-Squa 0.97776
Value Standard Er
B Intercept 0.04297 7.25308E-5 Slope 1.70251E 8.54784E-7
Fig. 6: Variation of sensitivity with Temperature with a U-shaped glass probe
IV. CONCLUSIONS
A comparison of the fiber optic temperature sensor using a U-bent solid glass as a sensing probe used in the sensing zone and a straight glass rod probe used as a sensing probe in the sensing region of the sensor is made from the results obtained. It is concluded that the evanescent absorption and hence the sensitivity can be increased by decreasing the bend radius of the sensing element. This is demonstrated from the results obtained hence it may be opined that a sensor using U-bend sensing probe with less bending radius is more sensitive the temperature variations of the liquids and the range of operation of temperature can be extended further. However, one noticeable fact is that the temperature sensor made out of the glass is more brittle than the plastic fibers used in the experiment, the glass system has to be handled very carefully than the plastic. At the same time the advantage of using the glass fiber lies in their use in inaccessible and toxic liquids and the liquids that effect the chemistry of the plastics where high temperatures are involved.
V.REFERENCES
[1] Edited by Bishnu P. Pal „Fundamentals of Fiber optics in Telecommunication and Sensor systems‟ Published by Popplai for New age International (P) Limited, 4835. ISBN: 81-224-0469-3, 24, March 1992.
617 | P a g e
[3] Ajoy Ghatak & K. Thyagarajan, „Introduction to Fiber Optics‟, Cmbridge University Press, Published in 1998,ISBN 0-521-57120-0(hb), ISBN 0-521- 57785-3 (pb).
[4] K. Kyuma, S. Tai, T. Matsui, T. Sawada and M. Nunoshita, „Fiber optic measurement instrument for temperature‟, IEEE Journal of quantum electronics, Vol. 18, No. 4 (1982).
[5] K. Kyuma, S. Tai, T. Matsui, T. Sawada and M. Nunoshita, „Fber optic measurement instrument for temperature, Tech. Dig. C L E O 81 (1981), PP 102 - 103
[6] T. H. Wndhoen and C. A. Cain, Optically active binary liquid crystal thermometer, „IEEE Trans. Biomed. Eng. Vol. 26 (19890, PP 148 – 152.
[7] R. Venkateswara Raju, T. Radha Krishna, B. S. Bellubbi, N. M. Gouri, G. Nirmala, A. Jayanth Kumar and T. R. Annapurna, Fiber optic temperature sensor using a plastic fiber, J. Pure and Appli Phy., Vol. 17, No. 3 (2005), PP. 135 – 138.
[8] G. B. Hocker, „Fiber optic sensitivity of Pressure and Temperature, Appl. Optics, Vol. 18, No. 9 (1979), PP 1445 – 1449.
[9] S. W. Harun, M. Yasin, H. A. Rahman, H. Arof and H. Ahmad, „Fiber optic temperature sensor‟ Chapter 17, “Optical Fiber Communications and Devices”, PP 361 – 380, website: www.intechopen.com.
[10] A. Kumar, Shenoy M.R., Pal B. P. and Goyal I. C., “A Novel Temperature Sensor using mercury cladded optical fibers” , J.I.E.T.E. 32, 347-348 (1986).
[11] M. Brenci, Conforti G., Falciai R. and Scheggi A.M., “Optical fiber thermometer for medical use”, Procs. SPIE 497, 13-17 (9184).
[12] K. A. Wickersheim and Alves R. V., “Flouroptic Thermometry: A New Immune Technology”, in Biomedical Thermology, Alan R. Liss, New York, 547-554 (1982).