International Journal of Pharmaceutical Sciences Review and Research Page 50
Patel H.A*, Vaghela J.P, Shah J.S, Patel P.B.
Department of Quality Assurance, S. J. Thakkar Pharmacy College, Rajkot-360005, Gujarat, India.
*Corresponding author’s E-mail: [email protected]
Accepted on: 05-06-2012; Finalized on: 31-07-2012. ABSTRACT
A Reverse Phase Liquid Chromatography (RP-HPLC) for the simultaneous estimation of Cefpodoxime (Cefpo) and Dicloxacillin (Diclox) in their combined dosage form was developed and validated and the above developed RP-HPLC method was applied to the Dissolution study. The method was performed on a RP-HPLC (YL-Clarity System), Kromasil ODS C18 (5 µm) column, 250×4.6 mm, 5µm particle size. The detection was carried out at 235 nm using Acetonitrile: Water (70:30 v/v) as a mobile phase at a flow rate of 1 ml/min at ambient temperature. For Dissolution Study, Cefpodoxime and Dicloxacillin ER tablet was kept in 0.1 N HCl for 2 hrs then the tablet was kept in Phosphate buffer 6.8 pH for 24 hrs. Sampling was carried out from 0, 1, 2, 3, 4, 5, 6, 7, 8, 9, 10, 11, 12, 24 hrs. Linearity was observed in concentration range of 5–25 µg/ml and a correlation coefficient of 0.999 for Cefpodoxime and in concentration range of 12.5-62.5 µg/ml and a correlation coefficient of 0.9993 for Dicloxacillin respectively. For Dissolution Study, ZEDOCEF-DXL-200 (Cefpodoxime and Dicloxacillin ER Tablets) showed mean % cumulative release of 87.588 ± 2.1078 and 92.16 ± 1.8757 of labeled amount of Cefpodoxime and Dicloxacillin Extended release tablets within 24 hours respectively. The RP-HPLC method was found to be simple, sensitive, precise and reproducible. The developed RP-HPLC method could be used for dissolution study of extended release tablet dosage form of Cefpodoxime and Dicloxacillin successfully.
Keywords: RP-HPLC, Cefpodoxime, Dicloxacillin.
INTRODUCTION
Cefpodoxime is (6R,7R)-7-{[(2Z)-2-(2-amino-1,3-thiazol-4- yl)-2-methoxyimino-acetyl]amino}-3-(methoxymethyl)-8-oxo-5-thia-1-azabicyclo[4.2.0]oct-2-ene-2-carboxylic acid (Figure 1) an oral third generation cephalosporin antibiotic. It is commonly used to treat acute otitis media, pharyngitis and sinusitis.1, 2
Figure 1: Chemical Structure of Cefpodoxime
Dicloxacillin is (2S,5R,6R)-6-{[3-(2,6-dichlorophenyl)-5-methyl- oxazole-4 carbonyl]amino}-3,3-di(2S,5R,6R)-6-{[3-(2,6-dichlorophenyl)-5-methyl-7-oxo-4- carbonyl]amino}-3,3-dimethyl-7-oxo-4-thia- 1-azabicyclo [3.2.0] heptane-2-carboxylic acid a narrow-spectrum beta-lactum antibiotic of the penicillin class. It is commonly used in Pneumonia, septic arthritis and throat infections.3, 4
Figure 2: Chemical Structure of Dicloxacillin
Cefpo is official in Indian Pharmacopoeia and US Pharmacopeia2, 5 while Diclox is official in US Pharmacopeia and British Pharmacopei.6, 7. Literature survey reveals that numbers of analytical methods are reported for the estimation of Cefpo and Diclox in single and combined dosage forms. Reported methods for estimation of Cefpo are Spectrophotometric methods 8-10, Spectrofluorimetric method 11, HPLC method 12, 13and HPTLC method14 and similarly Reported methods for estimation of Diclox are Spectrophotometric method 15, Second-derivative Spectrophotometric method 16, RP-HPLC methods 17-19.
No Method has been reported for estimation of Cefpodoxime and Dicloxacillin by RP-HPLC in combined dosage form & there is also no method has been reported for its application to the dissolution method. So the rational of work is to develop and validate simple, accurate and precise RP-HPLC method for the estimation of these two drugs in their combined dosage form and its application to the Dissolution Study.
MATERIALS AND METHODS
Apparatus and Instruments
HPLC: Make & Model: Young - Linn Clarity 9100 HPLC System
Degasser: Vacuum Degasser YL – 9101 Pump: Quaternary Pump YL – 9110 Detector: PDA detector YL – 9160
Column: Kromasil ODS C18(5 µm) column, 250×4.6 mm
DEVELOPMENT AND VALIDATION OF THE RP-HPLC METHOD FOR THE ESTIMATION OF CEFPODOXIME AND DICLOXACILLIN IN THEIR COMBINED DOSAGE FORM AND ITS APPLICATION TO THE DISSOLUTION STUDY
Temperature: Ambient Pressure: 1000 - 3000 psi
Double beam UV-visible spectrophotometer (Shimadzu, Model 1800) having two matched quartz cells with 1 cm light path
Electronic analytical balance, Shimadzu AUX-220 Ultra sonicator
Digital pH Meter (JankiImpex Pvt. Ltd., Ahmedabad) Dissolution Apparatus: PLC Dissolution Rate Test
Apparatus U.S.P/B.P/I.P. STD
Borosilicate Volumetric flask – 10, 25, 50, 100 ml Borosilicate Pipettes – 1, 2, 5, 10 ml
All instruments and glass wares were calibrated. Reagents and Standards
Standard Cefpodoxime Proxetil (gift sample from Sunrise Remedies Pvt. Ltd. Ahmedabad)
Standard Dicloxacillin Sodium (gift sample from Rhombus Pharma Pvt. Ltd. Ahmedabad)
Combined tablet formulations (Zedocef-DXL-200) were procured from Indian market.
Acetonitrile for Chromatography Lichrosolv® (Merck Specialities Pvt. Ltd., Mumbai)
Water for Chromatography Lichrosolv® (Merck Specialities Pvt. Ltd., Mumbai)
Sartorius Filter Paper 0.2 micron (Sartorius, Germany) 0.1N HCl
0.2M NaOH
0.2 M Potassium dihydrogen phosphate Method
Selection of Analytical Wavelength
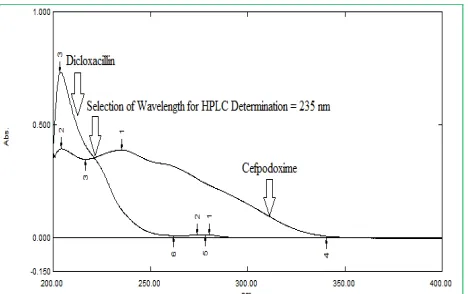
For Selection of wavelength for HPLC determination, two same concentration solutions of both drugs i.e. Cefpo and Diclox of 10µg/ml were prepared. UV spectrums of both drugs were taken and then both spectrums were overlapped. From overlapping of spectras (Figure 6.1), the wavelength at where both spectra’s were cross each other was taken as wavelength for HPLC determination. For Cefpo and Diclox, 235 nm was taken for HPLC determination.
Preparation of Standard Solutions
Preparation of Cefpo standard solution
Accurately weighed 50 mg of Cefpo was transferred into 50 ml volumetric flask and dissolved in 30 ml Optimized mobile phase as a diluent. The flask was sonicated for 5 min. The flask was shaken and volume was made up to
the mark with diluent to give a solution having strength of 1 mg/ml. (1000 µg/ml).
Figure 3: UV spectra of standard solution of Cefpodoxime (10µg/ml) and Dicloxacillin (10µg/ml) for selection of detection wavelength.
Preparation of working standard solution of
Cefpodoxime
Pipette out 1 ml of stock solution (1000 µg/ml) and transfer into 10 ml volumetric flask and make up to the mark with diluent to prepare 100 µg/ml.
Preparation of Dicloxacillin standard stock solution
Accurately weighed 50 mg of Diclox was transferred into 50 ml volumetric flask and dissolved in 30 ml Optimized mobile phase as a diluent. The flask was sonicated for 5 min. The flask was shaken and volume was made up to the mark with diluent to give a solution having strength of 1 mg/ml. (1000 µg/ml)
Preparation of working standard solution of Dicloxacillin
Pipette out 1 ml of stock solution (1000 µg/ml) and transfer into 10 ml volumetric flask and make up to the mark with diluent to prepare 100 µg/ml.
Preparation of Dissolution Medium 0.1N HCl
59.5 ml of 36% pure concentrated HCl was added to distilled water to prepare10 liters of 0.1NHCL.
Preparation of Dissolution Medium (Phosphate Buffer 6.8 pH)
1.875 liter of 0.2 M Potassium dihydrogen phosphate and 840 ml of 0.2 M NaOH were added to distilled water to prepare 7.5 liters of phosphate buffer 6.8 pH.
Chromatographic Condition
HPLC Model: YL9100 HPLC, Young Lin Instrument Stationary Phase: Kromasil ODS C18(5 µm) column,
250×4.6 mm
Mobile Phase: Acetonitrile: Water (70:30 v/v) Flow rate: 1 ml/min
Detection Wave length: 235 nm Temperature: Ambient
International Journal of Pharmaceutical Sciences Review and Research Page 52 Preparation of Calibration Curve
Appropriate aliquots from Cefpo standard stock solution (1000 µg/ml) were transferred in separate 10 ml volumetric flasks and volume made up to the mark with mobile phase (Acetonitrile: Water :: 70:30 v/v) to obtain final concentration of 5, 10, 15, 20 and 25 µg/ml. Appropriate aliquots from Diclox standard stock solution (1000 µg/ml) ware taken in separate 10 ml volumetric flasks and volume made up to the mark with mobile phase (Acetonitrile: Water :: 70:30 v/v) to obtain final concentration of 12.5, 25, 37.5, 50, 62.5µg/ml. The solutions were injected using a 20 µl loop system and chromatograms were recorded. Then, calibration curves were constructed by plotting peak area vs. concentration of the drug and regression equations were computed for Cefpo and Diclox respectively.
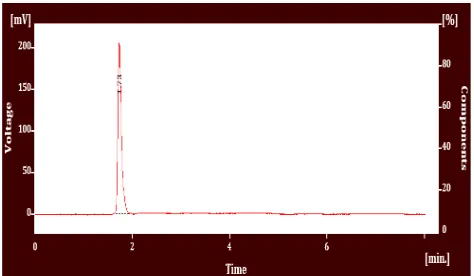
System Suitability Test
Observed values of Resolution, Column efficiency, Tailing factor were depicted in Table 1.
Table 1: System Suitability Test Parameter System Suitability
Parameters
Proposed Method
Standard Values Cefpo Diclox
Retention times (Rt) 3.607 1.727 - Theoretical plates (N) 3242 2218 Greater than 2000
Resolution (Rs) 7.830 Greater than 2
Tailing factor (As) 0.916 1.558 Not greater than 2.0
Analytical Method Validation
Validation of developed method was carried out as per ICH Q2 R1 guideline.20 Parameters such as Linearity,
Accuracy, Precision, LOD, LOQ, Ruggedness and Robustness were taken up as tests for analytical method validation.
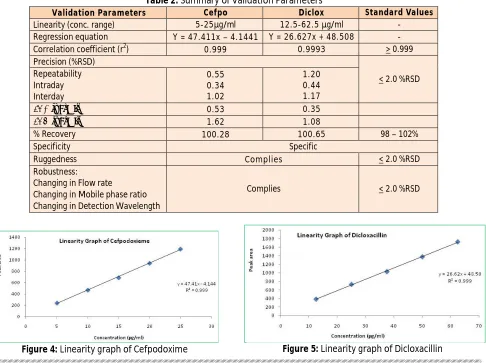
Linearity and Range
The proposed RP-HPLC method shows good linearity in the concentration range of 5 to 25µg/ml for Cefpo and 12.5 to 62.5 µg/ml for Diclox depicted in Figure 4 and 5. Overlay Chromatograms of standard mixture of Cefpo and Diclox depicted in Figure 6.
Precision
The intraday precision of the developed method was evaluated by analyzing combined samples of different concentrations of Cefpo and Diclox three times on the same day and %RSD was calculated.
The inter day precision was evaluated from the combined concentration of Cefpo and Diclox on three different days and %RSD was calculated. The repeatability was evaluated by combined standard solutions of Cefpo (15 µg/ml) and Diclox (37.5 µg/ml) were prepared and analyzed six time on the same day. Results obtained are shown in Table 2.
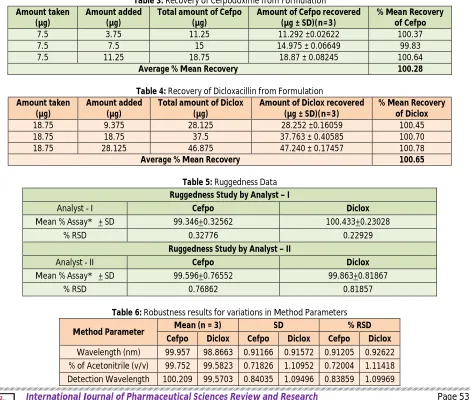
Table 2: Summary of Validation Parameters
Validation Parameters Cefpo Diclox Standard Values
Linearity (conc. range) 5-25µg/ml 12.5-62.5 µg/ml -
Regression equation Y = 47.411x – 4.1441 Y = 26.627x + 48.508 -
Correlation coefficient (r2) 0.999 0.9993 > 0.999
Precision (%RSD)
< 2.0 %RSD Repeatability
Intraday Interday
0.55 0.34 1.02
1.20 0.44 1.17
LOD (µg/ml) 0.53 0.35
LOQ (µg/ml) 1.62 1.08
% Recovery 100.28 100.65 98 – 102%
Specificity Specific
Ruggedness Complies < 2.0 %RSD
Robustness:
Changing in Flow rate
Changing in Mobile phase ratio Changing in Detection Wavelength
Complies < 2.0 %RSD
Figure 6: Overlay Chromatogram of Cefpodoxime (5-25 µg/ml) and Dicloxacilin (12.5-62.5 µg/ml)
Accuracy
Accuracy of the method was confirmed by recovery study from marketed formulation at three level of standard addition from 50 % to 150 % of label claim. The results are shown in Table 3 and 4. Recovery greater than 98% with low SD justifies the accuracy of the method.
Specificity
Specificity is the ability to assess unequivocally the analyte in the presence of components that may be expected to be present. Typically, these might include impurities, degrades etc. A solution of placebo in mobile
phase was injected and the chromatogram showed no inferring peaks at retention time of the two drugs. The chromatogram of placebo were compared with those acquired from Cefpo and Diclox standards, correlation was good (in terms of tR and area) indicates the specificity
of method. Chromatograms of specificity for Cefpo and Diclox depicted in Figure 8 to 10.
Limit of Detection (LOD) and Limit of Quantification (LOQ)
Calibration curve of mixture was repeated for 5 times and the standard deviation (SD) of the intercepts was calculated. Then LOD and LOQ were calculated as follows. LOD=3.3 * SD/slope of calibration curve,
LOQ=10 * SD/slope of calibration curve. Where, SD = Standard deviation of intercepts Results obtained are shown in Table 2. Ruggedness
Ruggedness of the proposed method was determined by analysis of aliquots of sample solution (15 µg/ml Cefpo and 37.5 µg/ml Diclox) by two analyst using same operational and environmental conditions. Results obtained are shown in Table 5.
Table 3: Recovery of Cefpodoxime from Formulation Amount taken
(µg)
Amount added (µg)
Total amount of Cefpo (µg)
Amount of Cefpo recovered (µg ± SD)(n=3)
% Mean Recovery of Cefpo
7.5 3.75 11.25 11.292 ±0.02622 100.37
7.5 7.5 15 14.975 ± 0.06649 99.83
7.5 11.25 18.75 18.87 ± 0.08245 100.64
Average % Mean Recovery 100.28
Table 4: Recovery of Dicloxacillin from Formulation Amount taken
(µg)
Amount added (µg)
Total amount of Diclox (µg)
Amount of Diclox recovered (µg ± SD)(n=3)
% Mean Recovery of Diclox
18.75 9.375 28.125 28.252 ±0.16059 100.45
18.75 18.75 37.5 37.763 ± 0.40585 100.70
18.75 28.125 46.875 47.240 ± 0.17457 100.78
Average % Mean Recovery 100.65
Table 5: Ruggedness Data Ruggedness Study by Analyst – I
Analyst - I Cefpo Diclox
Mean % Assay* + SD 99.346+0.32562 100.433+0.23028
% RSD 0.32776 0.22929
Ruggedness Study by Analyst – II
Analyst - II Cefpo Diclox
Mean % Assay* + SD 99.596+0.76552 99.863+0.81867
% RSD 0.76862 0.81857
Table 6: Robustness results for variations in Method Parameters
Method Parameter Mean (n = 3) SD % RSD
Cefpo Diclox Cefpo Diclox Cefpo Diclox
International Journal of Pharmaceutical Sciences Review and Research Page 54 Table 7: Analysis of market formulation
Figure 7: Specificity Chromatogram of Blank Placebo in Mobile Phase
Figure 8: Specificity Chromatogram of Cefpodoxime (15 µg/ml)
Figure 9: Specificity Chromatogram of Dicloxacillin (37.5 µg/ml)
Robustness
The Robustness of the method was evaluated by
By changing the flow rate by 1.0 + 0.1 ml/min (0.9 ml/min and 1.1 ml/min)
By changing mobile phase ratio by 70 + 1.0 % (69 and 71 %) for Acetonitrile
By changing detection wavelength by 235 + 2 nm (233 nm and 237 nm)
Results are shown in Table 6.
Analysis of Marketed Formulation by Proposed Method
Twenty tablets were weighed and average weight of content was determined & the content of tablets was powdered. The powder equivalent to 15 mg of Cefpo or 37.5 mg of Diclox was transferred in to a 100 ml volumetric flask, dissolved and diluted up to the mark with mobile phase as a diluent. The solution was filtered through Sartorius filter paper (0.2 µ). An aliquots of 1 ml of this solution was diluted to 10 ml with mobile phase six times.
Each solution was injected using Rhenodyne Injector (Fixed Capacity Loop of 20 µl) and chromatograms were recorded. The peak area of each chromatogram was determined. The concentration of each drug was calculated using calibration curve equation.
The results are shown in Table 7.
Application of the above developed RP-HPLC method to the Dissolution Study
Procedure for Dissolution Study
1000ml of dissolution medium (0.1N HCl) was transferred into each vessel of dissolution apparatus. The paddles were lowered up to the specified position. Then rpm was set to 50 and temperature to 37±0.5ᵒC. The tablet was placed at each of the bottom of vessels and peddle was operated.
10ml of sample was withdrawn from each of the vessel at 0, 0.5, 1, 2 hours from the zone midway between the surface of the dissolution medium and the top of paddle, not less than 100 mm from the wall of the vessel.
Replace the medium with drawn for analysis with equal volume of fresh medium.
Each Sample which was withdrawn from the 0.1 N HCl Dissolution medium was neutralized with 0.1 N NaOH before it was measured by HPLC.
After 2 hour, Tablet was replaced in Phosphate Buffer 6.8 pH within 10 minutes and dissolution conditions were set as it were set in 0.1 N HCl.
10 ml of sample was withdrawn from each of the vessel at 3, 4, 5, 6, 7, 8, 9, 10, 11, 12, 24 hours from the zone midway between the surface of the dissolution medium and the top of paddle, not less than 100 mm from the wall of the vessel.
The withdrawn medium for analysis was replaced with equal volume of fresh medium. Samples were measured by HPLC. Standard solutions were prepared containing mixture of Cefpo (200 µg/ml) and Diclox (500 µg/ml) respectively.
Formulation Labeled amount (mg) % Assay (n = 6)
Cefpo Diclox Cefpo Diclox
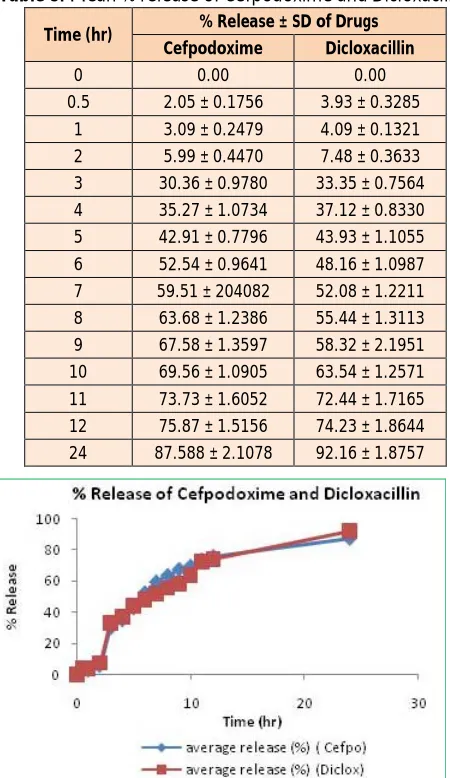
Percentage drug release was calculated by comparing peak area of different samples which were taken at different interval with peak area obtain by Standard solution containing mixture of Cefpo (200 µg/ml) and Diclox (500 µg/ml) respectively. Mean % release of Cefpo and Diclox are shown in table 8. Comparison of % Release of Cefpodoxime and Dicloxacillin is shown in the figure 10.
Table 8: Mean % release of Cefpodoxime and Dicloxacillin
Time (hr) % Release ± SD of Drugs Cefpodoxime Dicloxacillin
0 0.00 0.00
0.5 2.05 ± 0.1756 3.93 ± 0.3285
1 3.09 ± 0.2479 4.09 ± 0.1321
2 5.99 ± 0.4470 7.48 ± 0.3633
3 30.36 ± 0.9780 33.35 ± 0.7564
4 35.27 ± 1.0734 37.12 ± 0.8330
5 42.91 ± 0.7796 43.93 ± 1.1055
6 52.54 ± 0.9641 48.16 ± 1.0987
7 59.51 ± 204082 52.08 ± 1.2211
8 63.68 ± 1.2386 55.44 ± 1.3113
9 67.58 ± 1.3597 58.32 ± 2.1951
10 69.56 ± 1.0905 63.54 ± 1.2571
11 73.73 ± 1.6052 72.44 ± 1.7165
12 75.87 ± 1.5156 74.23 ± 1.8644
24 87.588 ± 2.1078 92.16 ± 1.8757
Figure 10: % Release of Cefpodoxime and Dicloxacillin
ZEDOCEF-DXL-200 (Cefpo and Diclox ER Tablets) show mean % cumulative release of 87.588 ± 2.1078 and 92.16 ± 1.8757 of labeled amount of Cefpo and Diclox Extended release tablets within 24 hours respectively.
RESULTS AND DISCUSSION
A simple, specific, accurate and precise RP-HPLC method has been developed and validated for simultaneous estimation of both these drugs. The chromatographic separation was achieved on Kromasil ODS C18 (5 µm)
column, 250×4.6 mm using Acetonitrile: Water (70: 30 v/v) as mobile phase at 235 nm. RP-HPLC method shows linearity in the range of 5-25 µg/ml for Cefpo and 12.5-62.5 µg/ml for Diclox. The correlation coefficient was 0.999 and 0.9993 was found for Cefpo and Diclox respectively. The average percentage recoveries of Cefpo
and Diclox for RP-HPLC method are of 100.28% and 100.65% respectively. The average percentage assay results of Cefpo and Diclox for RP-HPLC method are of 99.48% and 100.02% respectively. This is comparable to labeled claim. System suitability test reveal that all system suitability parameters complies with standard values. ZEDOCEF-DXL-200 (Cefpo and Diclox ER Tablets) show mean % cumulative release of 87.588 ± 2.1078 and 92.16 ± 1.8757 of labeled amount of Cefpo and Diclox Extended release tablets within 24 hours respectively.
CONCLUSION
We have successfully developed a new simple RP-HPLC method for the simultaneous estimation of Cefpo and Diclox combination in mixture using simple mobile phase acetonitrile and water. This method could be used for analyses, including pure drug analysis, assay of formulations and stability studies analysis. The purposed method did not utilize any extraction step for recovering the drug from the formulation excipient matrixes and their by decreased the degree of error, time in estimation of the drugs and the overall cost of the analysis. The method was validated and found to be simple, sensitive, accurate, precise and economical. The proposed method could be applied for routine analysis in quality control laboratories. From dissolution study, it is concluded that Dicloxacillin release faster than Cefpodoxime.
Acknowledgement: The authors are thankful to S. J. Thakkar Pharmacy College, Rajkot for providing needed facilities for this work. The authors are also thankful to Sunrise Remedies Pvt. Ltd., Ahmedabad, Gujarat and Rhombus Pharma Pvt. Ltd, Ahmedabad, Gujarat for providing pure gift sample of Cefpodoxime and Dicloxacillin.
REFERENCES
1. Sweetman SC, Martindale the complete drug reference, 35th Edn, Pharmaceutical Press, London, 2007, 207- 08.
2. Indian Pharmacopeia, Vol. III. New Delhi, The Controller Publication, Govt. of India, 2010; 1018.
3. Sweetman SC, Martindale the complete drug reference, 35th Edn, Pharmaceutical Press, London, 2007, 237- 38.
4. British Pharmacopoeia, Vol. I. London, The British Pharmacopoeia Commission, 2007; 606- 07.
5. The United State Pharmacopeia, USP27-NF22. Rockville MD: United State Pharmacopeial Convention, Inc., 2004; 378.
6. British Pharmacopoeia, Vol. I. London, The British Pharmacopoeia Commission, 2007; 606- 07.
7. The United State Pharmacopeia, USP27-NF22. Rockville MD: United State Pharmacopeial Convention, Inc., 2004; 597.
8. Subbayamma A and Rambabu C, “Spectrophotmetric Determination of Cefpodoxime Proxetil in Tablets.” Asian Journal of Chemistry. 22, 2010, 3345-3348.
International Journal of Pharmaceutical Sciences Review and Research Page 56
Cephalosporins using 4-chloro-7-nitrobenzo-2-oxa-1,3-diazole (NBD-Cl).” Natural Science. 2, 2010, 828-840.
10. Patel S and Patel S, “The Development and Validation of First Order Derivative Spectrophotometric method for Simultaneous Estimation of Ofloxacin and Cefpodoxime proxetil in tablet dosage form.” Journal of Pharmaceutical Science and Bioscientific Research. 1, 2011, 108-112.
11. Mohamed N, Abdel W and Ahmed S, “An efficient one-pot reaction for selective fluorimetric determination of Cefpodoxime and its prodrug.” Talanta. 85, 2011, 2121-2127.
12. Kakumanu V, Arora V and Bansal A, “Development and Validation of isomer specific RP-HPLC method for quantification of Cefpodoxime Proxetil.” Journal of Chromatography B. 835, 2006, 16–20.
13. Darji B, Shah N, Patel A and Patel N, “Development and validation of a HPTLC method for the estimation of Cefpodoxime Proxetil.” Indian Journal of Pharmaceutical Science. 69, 2007, 331-333.
14. Jing X, Qin H and Hong J, “Development and validation of an HPLC method for the determination of Cefpodoxime Proxetil and its related substances in dry syrups.” Chinese Journal of Antibiotics. 10, 2003, 476-484.
15. Nour F, Mohamed G and Farag E, “Spectrophotometric Determination of Flucloxacillin and Dicloxacillin in Pure and
Dosage Forms.” Spectrochimica Acta Part A. 64, 2006, 210– 215.
16. Morelli B, “Second-derivative spectrophotometric assay of mixtures of Dicloxacillin sodium and Ampicillin sodium in pharmaceuticals.” Journal of Pharmaceutical Sciences. 77, 1988, 1042–1046.
17. Lauriault G, Awang D and Kindack D, “The High-performance liquid chromatographic determination of Dicloxacillin in presence of its degradation products.” Journal of Chromatography. 283, 1984, 449-452.
18. Barot T, Patidar K, Kshartri N and Vyas N, “Development and Validation of LC Method for the Determination of Ampicillin and Dicloxacillin in Pharmaceutical Formulation Using an Experimental Design.” Journal of Chemistry. 6, 2009, 955-964.
19. Kathiresan K, Murugan R, Hameed M, Inimai K and Kanyadhara T, “Analytical method development and validation of Cefixime and Dicloxacillin tablets by RP-HPLC.” Rasayan Journal of Chemistry. 2, 2009, 588-592.
20. ICH Q2 (R1): Validation of Analytical Procedures: Text and Methodology. International Conference on Harmonization of Technical Requirements for Registration of Pharmaceuticals for Human use, ICH Harmonised Tripartite Guideline, 2005.
About Corresponding Author: Mr. Hardik A. Patel