Open Access
Proceedings
Comparison of tagging single-nucleotide polymorphism methods in
association analyses
Ellen L Goode*
1, Brooke L Fridley
1, Zhifu Sun
1, Elizabeth J Atkinson
1,
Alex S Nord
2, Shannon K McDonnell
1, Gail P Jarvik
2, Mariza de Andrade
1and Susan L Slager
1Address: 1Department of Health Sciences Research, Mayo Clinic College of Medicine, 200 First Street SW, Rochester, MN 55905, USA and 2Division
of Medical Genetics, University of Washington, Box 357720, Seattle, WA 98195-7720, USA
Email: Ellen L Goode* - [email protected]; Brooke L Fridley - [email protected]; Zhifu Sun - [email protected]; Elizabeth J Atkinson - [email protected]; Alex S Nord - [email protected];
Shannon K McDonnell - [email protected]; Gail P Jarvik - [email protected]; Mariza de Andrade - [email protected]; Susan L Slager - [email protected]
* Corresponding author
Abstract
Several methods to identify tagging single-nucleotide polymorphisms (SNPs) are in common use for genetic epidemiologic studies; however, there may be loss of information when using only a subset of SNPs. We sought to compare the ability of commonly used pairwise, multimarker, and haplotype-based tagging SNP selection methods to detect known associations with quantitative expression phenotypes. Using data from HapMap release 21 on unrelated Utah residents with ancestors from northern and western Europe (CEPH-Utah, CEU), we selected tagging SNPs in five chromosomal regions using ldSelect, Tagger, and TagSNPs. We found that SNP subsets did not substantially overlap, and that the use of trio data did not greatly impact SNP selection. We then tested associations between HapMap genotypes and expression phenotypes on 28 CEU individuals as part of Genetic Analysis Workshop 15. Relative to the use of all SNPs (n = 210 SNPs across all regions), most subset methods were able to detect single-SNP and haplotype associations. Generally, pairwise selection approaches worked extremely well, relative to use of all SNPs, with marked reductions in the number of SNPs required. Haplotype-based approaches, which had identified smaller SNP subsets, missed associations in some regions. We conclude that the optimal tagging SNP method depends on the true model of the genetic association (i.e., whether a SNP or haplotype is responsible); unfortunately, this is often unknown at the time of SNP selection. Additional evaluations using empirical and simulated data are needed.
from Genetic Analysis Workshop 15
St. Pete Beach, Florida, USA. 11–15 November 2006
Published: 18 December 2007
BMC Proceedings 2007, 1(Suppl 1):S6
<supplement> <title> <p>Genetic Analysis Workshop 15: Gene Expression Analysis and Approaches to Detecting Multiple Functional Loci</p> </title> <editor>Heather J Cordell, Mariza de Andrade, Marie-Claude Babron, Christopher W Bartlett, Joseph Beyene, Heike Bickeböller, Robert Culverhouse, Adrienne Cupples, E Warwick Daw, Josée Dupuis, Catherine T Falk, Saurabh Ghosh, Katrina A Goddard, Ellen L Goode, Elizabeth R Hauser, Lisa J Martin, Maria Martinez, Kari E North, Nancy L Saccone, Silke Schmidt, William Tapper, Duncan Thomas, David Tritchler, Veronica J Vieland, Ellen M Wijsman, Marsha A Wilcox, John S Witte, Qiong Yang, Andreas Ziegler, Laura Almasy and Jean W MacCluer</editor> <note>Proceedings</note> <url>http://www.biomedcentral.com/content/pdf/1753-6561-1-S1-info.pdf</url> </supplement>
This article is available from: http://www.biomedcentral.com/1753-6561/1/S1/S6
© 2007 Goode et al; licensee BioMed Central Ltd.
Background
Development and application of methods using linkage-disequilibrium (LD) for single-nucleotide polymorphism (SNP) selection has empowered genetic epidemiologic studies. Tagging SNP selection methods capitalize on the high levels of LD in much of the genome and aim to cap-ture all of the common variation. SNP redundancy can be reduced, allowing for improved information/coverage within the constraints of a fixed budget. Three classes of tagging SNP methods have the following aims: 1) corre-late each SNP of interest with a genotyped SNP (pairwise methods), 2) correlate each SNP of interest with a geno-typed SNP or a combination of genogeno-typed SNPs (multi-marker methods), or 3) explain each haplotype of interest using a set of genotyped SNPs (haplotype-based meth-ods). Investigators commonly select tagging SNPs using data from public projects [1] or a subset of study partici-pants, then genotype only the SNP subset in the larger study population [2,3].
Tagging SNP selection is implemented in commonly used, publicly available software packages that assess data from unrelated individuals (founders) or small families (trios). ldSelect [4] performs pairwise selection using a binning algorithm, Tagger [5] selects SNPs using pairwise and multimarker methods and allows for inclusion of trio data to reduce phase uncertainty, and TagSNPs v. 2.0-beta [6] implements pairwise, multimarker, and haplotype methods allowing for the inclusion of trio data.
We used these tagging SNP selection methods in genomic regions known to harbor associations with quantitative phenotypes [7]. We sought to assess whether (and to what degree) associations would have been detected if SNP sub-sets, rather than all SNPs, had been used. Previous simu-lated [8,9] and family-based [10,11] analyses suggest that empirical tagging SNP assessment in the context of associ-ation testing is needed. Here, we examine associassoci-ations from analysis of >770,000 HapMap Phase I genotypes and ~1,000 expression phenotypes in 57 unrelated Utah resi-dents with ancestors from northern and western Europe (CEU) [7]. We conducted a pilot study using a subset of
samples with HapMap Phase II genotypes and contrib-uted expression phenotypes as part of Genetic Analysis Workshop 15 (GAW15) [12].
Methods
Selection of regions to study was based on genetic associ-ations with lymphocyte expression values reported by Cheung et al. [7]. Using linear regression and limiting the data to 28 individuals with both HapMap and GAW15 data (described in more detail below), excluding rs535088 (genotypes not available) and PSPHL (not uniquely mapped), we reassessed the ten most statistically significant genotype-phenotype pairs reported. Regions containing the five strongest associations (Table 1) were defined as 5 kb surrounding the previously reported SNPs
and the nearby (cis) gene of interest.
Tagging SNP selection within these regions utilized Hap-Map release 21 CEU genotype data (60 founders or 30
trios) with MAF (or haplotype frequency) ≥ 0.05 and no
quality control exclusions [13]. These parameters were chosen on the basis of common use in genetic association studies. From starting sets of "All SNPs", pairwise
meth-ods used a threshold of r2 ≥ 0.8 between unassayed and
assayed SNPs among founders ("ldSelect", "TagSNPs-Rspair") or trios ("TagSNPs-Rspair-trios",
"Tagger-pair-wise"); multimarker methods used Rs2 ≥ 0.8 (or LOD >
3.0) between unassayed SNPs and combinations of up to three assayed SNPs among founders ("TagSNPs-Rs") or trios ("TagSNPs-Rs-trios", "Tagger-multimarker");
haplo-type-based methods used Rh2 ≥ 0.8 between haplotypes
and assayed SNPs among founders ("TagSNPs-Rh") or trios ("TagSNPs-Rh-trios").
Association testing was performed on 28 unrelated CEU individuals included in both HapMap and GAW15 data-sets (IDs available upon request) [1,13]. We used geno-types from HapMap release 21 (coded as 0, 1, and 2) and
phenotypes from GAW15 (log2-transformed Affymetrix
global-normalized lymphocyte expression values [14]). Single-SNP association testing used linear regression [7].
Haplotype association testing used the Splus library
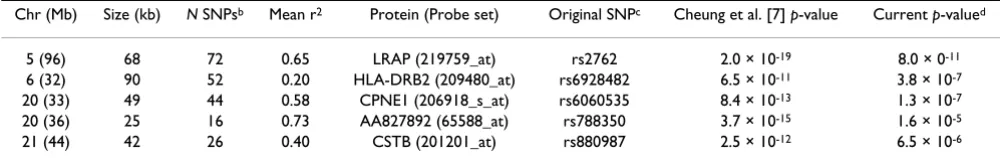
Hap-Table 1: Chromosomal regionsa
aRegions defined as ± 5 kb surrounding original SNP and cis gene.
bBased on MAF > 0.05 in CEU HapMap release 21.
crs Identification number shown is that reported by Cheung et al. based on 57 CEU founders [7].
loStat [15] excluding haplotypes with estimated n < 5. Hap-lotypes were defined across each region (haplo.score) as well as by sliding three-SNP windows (haplo.score.slide) [15].
Results
We examined five regions known to harbor genetic asso-ciations in a small, well characterized sample [7]. SNPs in these chromosomes 5, 6, 20, and 21 regions were associ-ated with lymphocyte expression levels of proteins (LRAP, HLA-DRB2, CPNE1, AA827892, and CSTB) encoded by nearby genes (Table 1). The HapMap project genotyped a
total of 210 SNPs (MAF ≥ 0.05 in 60 CEU samples)
(Fig-ure 1, 2, 3, 4, 5). The LRAP region included the most Hap-Map SNPs (n = 72, Table 1) and had strong linkage disequilibrium (LD); the HLA-DRB2 region had a large number of SNPs and low LD; the AA827892 region included only 16 SNPs in strong LD; and the CPNE1 and CSTB regions were of intermediate size with modest/vari-able LD. Single-SNP association testing in 28 phenotyped
individuals yielded p-values < 10-6 in each region (Figure
1, 2, 3, 4, 5). Across regions of strong LD, consistent
asso-ciations were seen (i.e., nearly identical -log10(p-values));
independent SNPs yielded unique results (Figure 4).
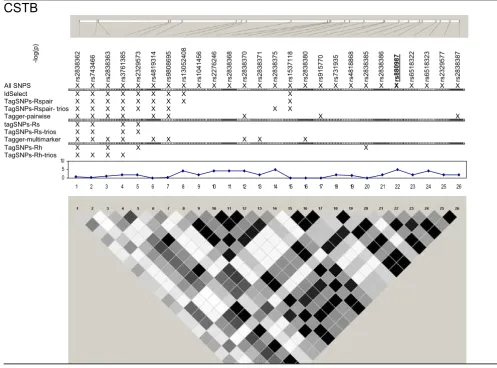
Nine subsets of tagging SNPs were identified within each region (Figure 1, 2, 3, 4, 5). In regions with lower LD (HLA-DRB2 and CSTB), more markers were generally required and selected SNPs were less consistent across methods. This may be because there are many possible haplotypes, and haplotype-based methods may thus esti-mate varying number and frequency of the haplotypes to tag. In regions with high-LD, there was also lack of con-sistency across methods. For example, in the AA827892 region, SNPs 10 and 14 are independent and selected by
all methods, yet SNPs 1–9 and 11–13 are in high LD and methods vary in which they select (Figure 4). There were surprising discrepancies in SNP selection across methods that used an identical algorithm (e.g., ldSelect and Tag-SNPs-Rspair); we attribute this to differences in rounding LD measures. Generally, SNP subsets overlapped among pairwise methods (HLA-DRB2, Figure 2), among haplo-type-based methods (CPNE1, Figure 3), among TagSNPs methods with trios and founders (LRAP, Figure 1), and among Tagger pairwise and multimarker methods (CSTB, Figure 5).
We then assessed whether subsets of tagging SNPs detected the strong association signals observed when all SNPs were studied (Table 1). The minimum single-SNP
association p-values identified by each subset within each
region are provided in Table 2. Single-SNP results in each region were strongest using "All SNPs", but were compa-rable in SNP subsets that included the strongest SNP or a SNP in strong LD with the strongest SNP (e.g., SNP 10, 13, and 18 in the CPNE1 region; Figure 1, 2, 3, 4, 5). Although all methods identified HLA-DRB2 associations, there was
great variation in p-values, most likely due to one
particu-larly strong SNP association (SNP 41) and low LD (except with SNP 44). Multimarker SNP selection methods imple-mented in TagSNPs (but not Tagger) failed to detect asso-ciations with CPNE1 or AA827892 (selected SNPs, e.g., AA827892 SNP 16, were not in LD with associated SNPs)
(p > 0.01; Figure 1, 2, 3, 4, 5; Table 2).
Although regions were initially chosen on the basis of observed single-SNP associations, we also assessed haplo-type associations. Results considering all SNPs in each set
(global p-value), and sliding windows of three-SNP
hap-lotypes (minimum global p-value) are shown in Table 3.
SNPs, single-SNP associations, and LD for LRAP
Figure 1
SNPs, single-SNP associations, and LD for LRAP. Underline, original association; Haploview 3.32 plotted r2 (white, 0;
black, 1) in 60 CEU samples.
SNPs, single-SNP associations, and LD for HLA-DRB2
Figure 2
SNPs, single-SNP associations, and LD for HLA-DRB2. Underline, original association; Haploview 3.32 plotted r2
(white, 0; black, 1) in 60 CEU samples.
HLA-DRB2
rs6928482 rs9273363 rs6906021 rs1056315 All SNPS X X X X X X X X X X X X X X X X X X X X X X X X X X X X X X X X X X X X X X X X X X X X X X X X X X X X
SNPs, single-SNP associations, and LD for CPNE1
Figure 3
SNPs, single-SNP associations, and LD for CPNE1. Underline, original association; Haploview 3.32 plotted r2 (white, 0;
black, 1) in 60 CEU samples.
CPNE1
rs6060535 rs6060536 rs17426738 rs6060539 rs6121015 1040695 rs rs11696527 rs17427233 rs6058290 rs6058291 rs6060540 rs6060541 rs6058292 rs6058293 rs6121019 rs6121020 6121021 rs rs2295355 rs6119636 rs6121022 rs2180280 rs6060546
In all regions using "All SNPs", at least one three-SNP
hap-lotype was associated at p < 0.01; but only the LRAP,
CPNE1, and CSTB regions yielded global results signifi-cant at this level (Table 3). Comparing across subsets, note that set-haplotype analyses are comparable in terms of number of tests, while three-SNP haplotype analyses are comparable in terms of degrees of freedom. There was general consistency in results across methods for LRAP
and AA827892 (regions with strongest LD); however, no subsets detected the strongest three-marker haplotype association for AA827892. There was also consistency in haplotype association results in the HLA-DRB2 region
(with low LD); global p-values oscillated around 0.01.
Haplotype-based SNP selection methods (TagSNPs-Rh-trios), which selected only two tagging SNPs, failed to detect the CPNE1 haplotype association observed by
SNPs, single-SNP associations, and LD for AA827892
Figure 4
SNPs, single-SNP associations, and LD for AA827892. Underline, original association; Haploview 3.32 plotted r2 (white,
0; black, 1) in 60 CEU samples.
other methods (Table 3). Multimarker SNP selection methods implemented in TagSNPs (but not Tagger) failed to detect CSTB haplotype associations.
Figure 6 summarizes relative signals for associations
across SNP subsets as the ratio of [-log(minimum p-value
using subset)] to [-log(minimum p-value using all SNPs)].
Generally, haplotype-based selection methods and meth-ods in TagSNPs "missed" more single-SNP and haplotype associations than other methods (Figure 6).
Discussion
Our ability to combine HapMap genotype data with GAW15 phenotype data provided a unique opportunity to assess chromosomal regions harboring known genetic associations in CEU samples. Although only a small pilot study, we explored whether these associations would have been detected if genotyping had been limited to tagging
SNPs. The current analysis has advantages over other reported methods in that we focused on association test-ing, particular commonly used statistical tools, and use of HapMap data.
We make several observations. There was lack of consist-ency across selected SNP sets whether or not LD was present. Inclusion of trio data did not generally impact SNP selection. For the majority of regions, pairwise approaches worked well, relative to use of all SNPs, with marked reductions in the number of SNPs required. Meth-ods reducing the number of SNPs over pairwise methMeth-ods (e.g., multimarker methods) may lead to more missed sig-nals, particularly in haplotype association testing. The program TagSNPs did not offer particular advantages over ldSelect or Tagger in terms of number of SNPs chosen or associations detected. Regardless of the method used,
typ-SNPs, single-SNP associations, and LD for CSTB
Figure 5
SNPs, single-SNP associations, and LD for CSTB. Underline, original association; Haploview 3.32 plotted r2 (white, 0;
black, 1) in 60 CEU samples.
CSTB
rs880987 rs6518322 rs6518323 rs2329577 rs2838387
ing additional markers in areas of signal may improve sig-nal strength and localization.
The current work suggests that empirical assessment of a larger data set and simulated data addressing a range of genetic models would allow for more precise comparison of approaches. Consideration of coverage, rather than nal strength, and examination of our assumption that sig-nals detected in each region were due to a common underlying genetic cause could further inform compari-sons. Additional issues include cost efficiency, transfera-bility of tagging SNPs, and the role of bioinformatics.
Conclusion
The optimal tagging SNP method to use will depend on the true genetic model of the association. Pairwise or
mul-timarker methods are optimal if the discovery SNP set contains the causal SNP (or a SNP in strong LD with causal SNP), while haplotype-based methods are optimal if the discovery SNP set defines a haplotype carrying the causal allele. Unfortunately, it is seldom known during the SNP selection phase of studies whether a SNP or a haplotype defines an association. Thus, critical assess-ment of the utility of available SNP selection methods under a variety of conditions is essential.
Competing interests
The author(s) declare that they have no competing inter-ests.
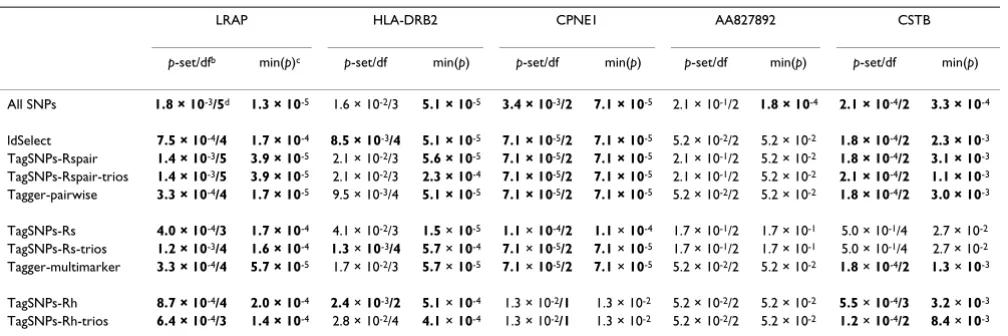
Table 3: Haplotype association resultsa
LRAP HLA-DRB2 CPNE1 AA827892 CSTB
p-set/dfb min(p)c p-set/df min(p) p-set/df min(p) p-set/df min(p) p-set/df min(p)
All SNPs 1.8 × 10⁻³/5d 1.3 × 10⁻⁵ 1.6 × 10⁻²/3 5.1 × 10⁻⁵ 3.4 × 10⁻³/2 7.1 × 10⁻⁵ 2.1 × 10⁻¹/2 1.8 × 10⁻⁴ 2.1 × 10⁻⁴/2 3.3 × 10⁻⁴
ldSelect 7.5 × 10⁻⁴/4 1.7 × 10⁻⁴ 8.5 × 10⁻³/4 5.1 × 10⁻⁵ 7.1 × 10⁻⁵/2 7.1 × 10⁻⁵ 5.2 × 10⁻²/2 5.2 × 10⁻² 1.8 × 10⁻⁴/2 2.3 × 10⁻³
TagSNPs-Rspair 1.4 × 10⁻³/5 3.9 × 10⁻⁵ 2.1 × 10⁻²/3 5.6 × 10⁻⁵ 7.1 × 10⁻⁵/2 7.1 × 10⁻⁵ 2.1 × 10⁻¹/2 5.2 × 10⁻² 1.8 × 10⁻⁴/2 3.1 × 10⁻³
TagSNPs-Rspair-trios 1.4 × 10⁻³/5 3.9 × 10⁻⁵ 2.1 × 10⁻²/3 2.3 × 10⁻⁴ 7.1 × 10⁻⁵/2 7.1 × 10⁻⁵ 2.1 × 10⁻¹/2 5.2 × 10⁻² 2.1 × 10⁻⁴/2 1.1 × 10⁻³
Tagger-pairwise 3.3 × 10⁻⁴/4 1.7 × 10⁻⁵ 9.5 × 10⁻³/4 5.1 × 10⁻⁵ 7.1 × 10⁻⁵/2 7.1 × 10⁻⁵ 5.2 × 10⁻²/2 5.2 × 10⁻² 1.8 × 10⁻⁴/2 3.0 × 10⁻³
TagSNPs-Rs 4.0 × 10⁻⁴/3 1.7 × 10⁻⁴ 4.1 × 10⁻²/3 1.5 × 10⁻⁵ 1.1 × 10⁻⁴/2 1.1 × 10⁻⁴ 1.7 × 10⁻¹/2 1.7 × 10⁻¹ 5.0 × 10⁻¹/4 2.7 × 10⁻²
TagSNPs-Rs-trios 1.2 × 10⁻³/4 1.6 × 10⁻⁴ 1.3 × 10⁻³/4 5.7 × 10⁻⁴ 7.1 × 10⁻⁵/2 7.1 × 10⁻⁵ 1.7 × 10⁻¹/2 1.7 × 10⁻¹ 5.0 × 10⁻¹/4 2.7 × 10⁻²
Tagger-multimarker 3.3 × 10⁻⁴/4 5.7 × 10⁻⁵ 1.7 × 10⁻²/3 5.7 × 10⁻⁵ 7.1 × 10⁻⁵/2 7.1 × 10⁻⁵ 5.2 × 10⁻²/2 5.2 × 10⁻² 1.8 × 10⁻⁴/2 1.3 × 10⁻³
TagSNPs-Rh 8.7 × 10⁻⁴/4 2.0 × 10⁻⁴ 2.4 × 10⁻³/2 5.1 × 10⁻⁴ 1.3 × 10⁻²/1 1.3 × 10⁻² 5.2 × 10⁻²/2 5.2 × 10⁻² 5.5 × 10⁻⁴/3 3.2 × 10⁻³
TagSNPs-Rh-trios 6.4 × 10⁻⁴/3 1.4 × 10⁻⁴ 2.8 × 10⁻²/4 4.1 × 10⁻⁴ 1.3 × 10⁻²/1 1.3 × 10⁻² 5.2 × 10⁻²/2 5.2 × 10⁻² 1.2 × 10⁻⁴/2 8.4 × 10⁻³
aSubset methods are sorted into pairwise, multimarker, and haplotype-based methods.
bp-set/df, global score test considering entire set.
cmin(p), smallest p-value considering three-SNP haplotypes across set.
dBold, <0.01.
Table 2: Single-SNP association resultsa
LRAP HLA-DRB2 CPNE1 AA827892 CSTB
Nb min(p)c N min(p) N min(p) N min(p) N min(p)
All SNPs 72 8.0 × 10⁻¹¹ 52 3.4 × 10⁻¹¹ 44 1.3 × 10⁻⁷ 16 1.5 × 10⁻⁵ 26 6.5 × 10⁻⁶
ldSelect 9 3.6 × 10⁻⁷ 28 3.4 × 10⁻¹¹ 3 1.3 × 10⁻⁷ 3 3.7 × 10⁻⁵ 9 5.4 × 10⁻⁵
TagSNPs-Rspair 10 1.3 × 10⁻⁷ 20 1.8 × 10⁻⁵ 3 1.3 × 10⁻⁷ 4 1.5 × 10⁻⁵ 9 5.4 × 10⁻⁵
TagSNPs-Rspair-trios 10 1.3 × 10⁻⁷ 20 1.8 × 10⁻⁵ 3 1.3 × 10⁻⁷ 4 1.5 × 10⁻⁵ 9 6.5 × 10⁻⁶
Tagger-pairwise 9 2.2 × 10⁻⁸ 26 1.2 × 10⁻⁸ 3 1.2 × 10⁻⁵ 3 3.7 × 10⁻⁵ 9 4.8 × 10⁻⁵
TagSNPs-Rs 5 1.1 × 10⁻⁸ 9 3.4 × 10⁻¹¹ 2 3.2 × 10⁻² 3 5.9 × 10⁻² 4 9.9 × 10⁻³
TagSNPs-Rs-trios 5 1.1 × 10⁻⁸ 9 1.4 × 10⁻⁵ 2 2.9 × 10⁻² 3 5.9 × 10⁻² 4 9.9 × 10⁻³
Tagger-multimarker 7 3.6 × 10⁻⁷ 18 3.4 × 10⁻¹¹ 3 1.3 × 10⁻⁷ 3 3.7 × 10⁻⁵ 9 4.8 × 10⁻⁵
TagSNPs-Rh 7 2.8 × 10⁻⁹ 9 3.8 × 10⁻⁷ 2 1.2 × 10⁻⁵ 3 1.5 × 10⁻⁵ 4 9.9 × 10⁻³
TagSNPs-Rh-trios 6 3.6 × 10⁻⁷ 8 5.1 × 10⁻⁵ 2 1.2 × 10⁻⁵ 3 1.5 × 10⁻⁵ 4 1.5 × 10⁻²
aSubset methods sorted into pairwise, multimarker, and haplotype-based methods.
bN, number of SNPs.
Acknowledgements
We acknowledge funding from R01 CA94919, R01 CA104667, and R01 H167406.
This article has been published as part of BMC Proceedings Volume 1 Sup-plement 1, 2007: Genetic Analysis Workshop 15: Gene Expression Analysis and Approaches to Detecting Multiple Functional Loci. The full contents of the supplement are available online at http://www.biomedcentral.com/ 1753-6561/1?issue=S1.
References
1. Altshuler D, Brooks LD, Chakravarti A, Collins FS, Daly MJ, Donnelly P: A haplotype map of the human genome. Nature 2005,
437:1299-1320.
2. Benusiglio PR, Pharoah PD, Smith PL, Lesueur F, Conroy D, Luben RN, Dew G, Jordan C, Dunning A, Easton DF, Ponder BAJ: HapMap-based study of the 17q21 ERBB2 amplicon in susceptibility to breast cancer. Br J Cancer 2006, 95:1689-1695.
3. Lu X, Zhao W, Huang J, Li H, Yang W, Wang L, Huang W, Chen S, Gu D: Common variation in KLKB1 and essential
hyperten-sion risk: tagging-SNP haplotype analysis in a case-control study. Hum Genet 2007, 121:327-335.
4. Carlson CS, Eberle MA, Rieder MJ, Yi Q, Kruglyak L, Nickerson DA:
Selecting a maximally informative set of single-nucleotide polymorphisms for association analyses using linkage dise-quilibrium. Am J Hum Genet 2004, 74:106-120.
5. de Bakker PI, Yelensky R, Pe'er I, Gabriel SB, Daly MJ, Altshuler D:
Efficiency and power in genetic association studies. Nat Genet 2005, 37:1217-1223.
6. Stram DO: Tag SNP selection for association studies. Genet Epidemiol 2004, 27:365-374.
7. Cheung VG, Spielman RS, Ewens KG, Weber TM, Morley M, Burdick JT: Mapping determinants of human gene expression by regional and genome-wide association. Nature 2005,
437:1365-1369.
8. Huang Q, Fu YX, Boerwinkle E: Comparison of strategies for selecting single nucleotide polymorphisms for case/control association studies. Hum Genet 2003, 113:253-257.
9. Burkett KM, Ghadessi M, McNeney B, Graham J, Daley D: A com-parison of five methods for selecting tagging single-nucle-otide polymorphisms. BMC Genet 2005, 6(Suppl 1):S71. 10. Duggal P, Gillanders E, Mathias R, Ibay G, Klein K, Baffoe-Bonnie A,
Ou L, Dusenberry I, Tsai Y-Y, Chines P, Doan B, Bailey-Wilson J:
Identification of tag single-nucleotide polymorphisms in Relative signal strength
Figure 6
Relative signal strength. [-log(min-p-Subset)]/[-log(min-p-All-SNPs)]; solid line, single-SNP; dashed line, 3-SNP haplotype.
LRAP
T agSNP s-Rs T agSNP
s-Rs-tr i os
T agSNP s-Rs T agSNP
s-Rs-t r i os
T agger
-mul t i mar ker
T agSNP s-Rh T agSNP
Publish with BioMed Central and every scientist can read your work free of charge "BioMed Central will be the most significant development for disseminating the results of biomedical researc h in our lifetime."
Sir Paul Nurse, Cancer Research UK
Your research papers will be:
available free of charge to the entire biomedical community
peer reviewed and published immediately upon acceptance
cited in PubMed and archived on PubMed Central
yours — you keep the copyright
Submit your manuscript here:
http://www.biomedcentral.com/info/publishing_adv.asp
BioMedcentral regions with varying linkage disequilibrium. BMC Genet 2005,
6(Suppl 1):S73.
11. Chi PB, Duggal P, Kao WH, Mathias RA, Grant AV, Stockton ML, Gar-cia JG, Ingersoll RG, Scott AF, Beaty TH, Barnes KC, Fallin MD: Com-parison of SNP tagging methods using empirical data: association study of 713 SNPs on chromosome 12q14.3-12q24.21 for asthma and total serum IgE in an African Car-ibbean population. Genet Epidemiol 2006, 30:609-619.
12. Cordell HJ, de Andrade M, Babron M-C, Bartlett CW, Beyene J, Bick-eböller H, Culverhouse R, Cupples LA, Daw EW, Dupuis J, Falk CT, Ghosh S, Goddard KA, Goode EL, Hauser ER, Martin LJ, Martinez M, North KE, Saccone NL, Schmidt S, Tapper W, Thomas D, Tritchler D, Vieland VJ, Wijsman EM, Wilcox MW, Witte JS, Yang Q, Ziegler A, Almasy L, MacCluer JW: Genetic Analysis Workshop 15: gene expression analysis and approaches to detecting multiple functional loci. BMC Proc 2007, 1(Suppl 1):S1.
13. International HapMap Project [http://www.hapmap.org]. Build 35; August 10, 2006
14. Morley M, Molony CM, Weber TM, Devlin JL, Ewens KG, Spielman RS, Cheung VG: Genetic analysis of genome-wide variation in human gene expression. Nature 2004, 430:743-747.


![Figure 6Relative signal strengthRelative signal strength. [-log(min-p-Subset)]/[-log(min-p-All-SNPs)]; solid line, single-SNP; dashed line, 3-SNP haplotype.](https://thumb-us.123doks.com/thumbv2/123dok_us/859313.1102878/8.612.59.552.93.480/figure-relative-signal-strengthrelative-strength-subset-single-haplotype.webp)
