Real Time Implementation and Performance
Analysis of LabVIEW Based PID and Cascade
Controller for Level Control
Rishi Raj Saikia, Sandesh Andrade, Veeresh Sangamesh Muttagi
PG Scholars, Dept. of EE, UVCE, Bangalore, Karnataka, India
ABSTRACT: The primary aim of this paper is to implement software based (virtual instrumentation) feedback controller in LabVIEW for level control of a tank system. Conventional feedback PID controllers are not efficient in terms of meeting a good transient response and steady state error; hence a cascade methodology is also proposed. The response of the cascade control scheme is compared with that of the PID controller using performance criteria like IAE, ISE and also rise time, peak time, settling time are obtained for both methods using real time data. Both the controllers are implemented using NIcDAQ9138. Finally simulation is also done for the modeled process.
KEYWORDS: PID, Cascade, IAE, ISE, LabVIEW, cDAQ9138 etc.
I.INTRODUCTION
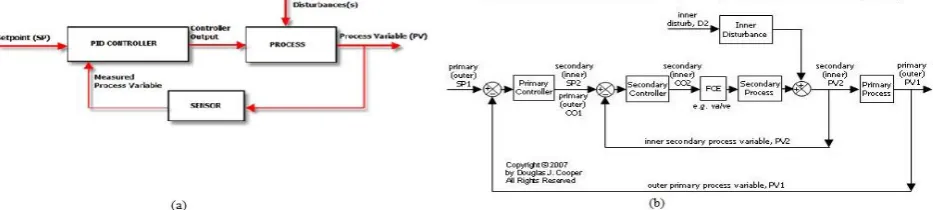
Proportional Integral Derivative (PID) controllers are widely used in industrial practice from over 60 years. PID is used in more than 90% of practical control systems, ranging from consumer electronics such as cameras to industrial processes such as chemical processes. The PID controller helps in getting responses with better settling time and tracking. Many nonlinear processes can be controlled using the well-known and industrially proven PID controller. A considerable direct performance improvement (financial gain) is demanded when replacing a conventional control system with an advanced one. The tricky part of controller design is, to figure out just how much of a corrective effort the controller should apply to the process in each case. The PID controller‟s function is to maintain the output at a level such that there is no difference (error) between the process variable and the set point as fast as possible. On the other hand a PID controller tends to be sluggish in some cases and if there is a non-linear load change the time taken to eliminate the error becomes high.
In this case a higher control strategy like cascade or feed forward- feedback controller comes in handy. Cascade controller works as a multi input single output (MISO) system; any disturbances occurring in the secondary process are rectified and hence the impact is least felt by the primary process. The primary controller is also referred to as the master controller, and the secondary controller is referred to as the slave controller. The output of the primary controller is used to adjust the set point of a secondary controller, which in used to control the manipulated variable.
II.SYSTEM SETUP
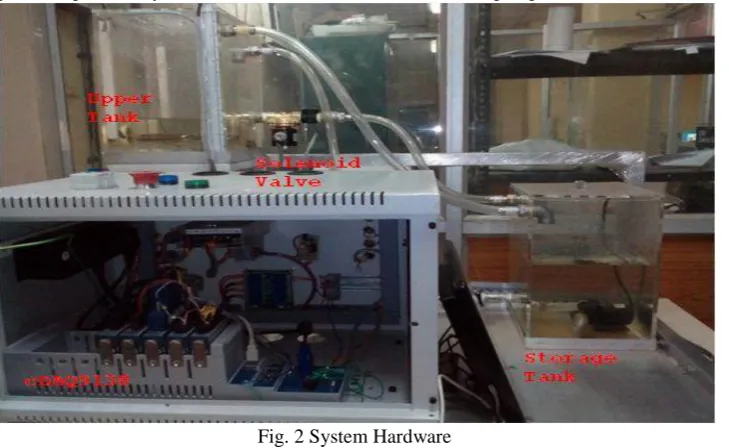
The setup we used for level control has following hardware components.
Lower supply tank: Supply tank is used for storage of water. The dimensions of the tank are 25cmx20cmx32cm. The Tank is made up of transparent acrylic and also contains a submersible water pump as an actuator.
Fig. 2 System Hardware
Upper Level tank:Transparent level tank is the main process tank. The dimensions of this tank are 25cmx20cmx32cm. Graduated scale is provided on the tank to indicate tank water level in cm. The level tank has an outlet at bottom, which opens into the supply tank. Outflow of the tank can be controlled with the help of a solenoid valve provided at the outlet.
Level sensor:DPT type level sensor transmitter is mounted on the top of the level tanks. The specifications of this sensor are 0-1 PSI, 0.5 - 4.5V High Level Output, -20ºC to +70ºC Operating Temperature Range, ±1% Pressure Non Linearity
Flow Sensor (YF-S201):Hall Effect turbine type sensor with Max flow rate: 8-9 ltr/min, min. flow rate: 2 ltr/min with frequency range from 16 Hz to 65 Hz respectively. Error range +10% to -10%
Pump: 0-12V submersible DC motor with flow rate of 2ltr/min to 12ltr/min.
NI cDAQ -9138/9139:The National Instruments CompactDAQ cDAQ-9138 stand-alone chassis with integrated controller features the 1.06 GHz Celeron processor. The National Instruments cDAQ-9139 stand-alone chassis with integrated controller features the 1.33 GHz Intel Core i7 processor. The NI cDAQ-9138 and NI cDAQ-9139 are available as a Windows Embedded Standard 7 (WES7) or a LabVIEW Real-Time system.
Calibration tables used for level and flow sensor is given below figure
·
Frequency(in Hz) Ltr/min Motor I/P voltage
17 2-3 2
36 4-5 3
50 6-7 4
65 8-9 5
Level (in cm.) O/P voltage(in volt) 10 1.63 - 1.65
15 1.95 -2.00 21 2.30 - 2.34 23 2.35 – 2.36
Table 2 Calibration table for Level Sensor *1cm of level rise=0.5 ltr
From the above table using linear curve fit the following relations are obtained.
Level (in ltr) = 17.7515*voltage – 19.325 (1)
Flow (in ltr/min) = 0.12961*frequency – 0.247676 (2)
III.SYSTEM MODELLING
The trainer system is a FOPTD model which is a single tank level control system. The model developed is based on mass-balance principle. The flow to motor voltage relationship can be estimated as a linear lag process which can be further estimated as a first order process.
Process: It is defined as the change in the level of liquid in the tank. The manipulated parameter is the flow into the tank i.e. qi(t) (cm3/s). The output parameter is the height of liquid in the tank which is shown in figure 3.
Tank: The governing equation for the change in liquid volume is given by the following equation: Rate of change of volume of liquid = inflow – outflow
So, if qi becomes equal to the qo then there would be no change in the volume of liquid which is obtained by the tank.
dy/dt = qi(t) –qo (t) (3)
Where qi-inflow, qo-outflow
To find out T (time constant) and R (resistance to the outflow) we assume the following
Assumptions:
1. The cross-sectional area of the tank is constant that isA=500cm2
2. The outflow of the liquid is proportional to the height ofliquid: qo (t) = h (t)/R
Using above assumptions different values of R and different heights are obtained and tabulated.
Change in height (in cms) Change in Flow Rate(in cm3/s) R(s/cm2)
20 - 18 52.4 - 46.6 =5.8 0.35 18 - 16 46.6 - 41.3 =5.3 0.38 16 - 14 41.3 - 36.2 =5.1 0.39
Table 3: Restriction vs. height
Avg. Restriction „R‟ is 0.38s/cm2
. H
ence the time constant „T‟ will be 190s. Hence the estimated transfer function of the process is as follows.H(s)
Qin(s)
=
0.38
1 + 190s
Where, H(s) is height of the water in cm. Qin(s) is inflow in cm 3
/s or in terms of volumes.
C(s)
Qin(s)
=
190
1 + 190s
Fig. 3 Plot of (a) restriction vs. height (b) gain vs. motor voltage
Flow
:
In case of cascade the secondary transfer function is the flow rate to pump input voltage which is a lag process with only dc gain; which can be approximated to a first order approximation.Change in Voltage(volt) Change in flow(cm3/s) lag(s) K
5 - 4 136.67 – 104 =32.67 1.2 32.67 4 - 3 104 - 75 = 29 0.8 29 3 - 2 75 - 33.3 = 41.7 0.9 41.7
Table 4 Inflow vs. Voltage
*Average gain is 34 and average lag is 1s for the above mentioned system. From the estimated values the following transfer function is derived
Qin(s)
V(s)
=
34
1 + s
.
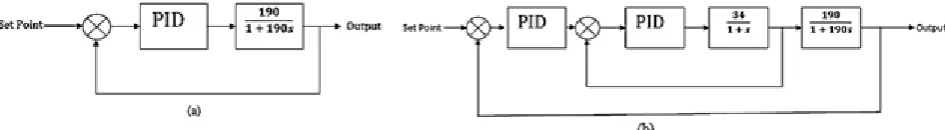
The PID scheme and cascade scheme on the basis of the estimated transfer functions are shown below.
Fig. 4 (a) PID and (b) cascade schematic of the estimated systems.
IV. IMPLEMENTATION IN LABVIEW
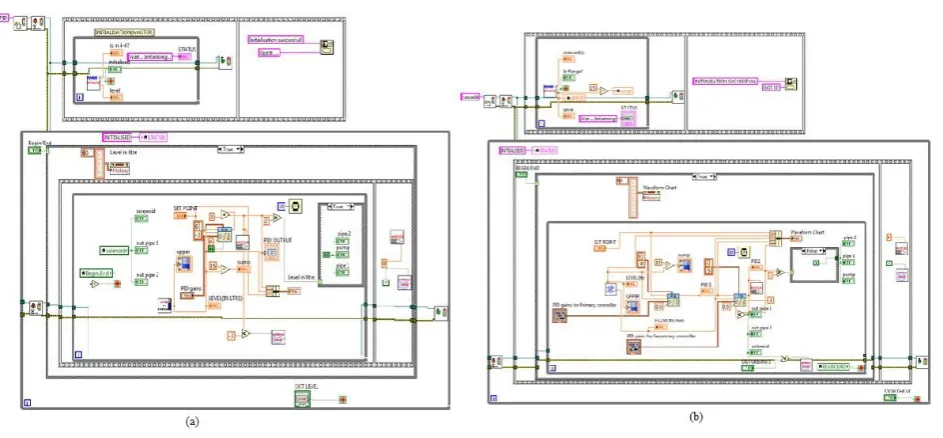
The process first needs to be initialized to a minimum value of 10cms which is just above the solenoid valve openingfor this reason each PID and Cascade scheme was implemented using master- slave loop design pattern.
Fig. 5 Block diagram of (a) PID VI and (b) Cascade VI Both the processes are implemented using the following subVIs.
Initialize VI subVI
This VI works in the master loop i.e. until this loop gets executed and brings the water to the minimum level of 4-5 ltrs, the control strategy cannot be started.If the water level is higher than 5 ltrs the solenoid valve gets opened and if the water level is less than 4 ltrs the motor runs until level reaches the required value.
Fig. 6 (a) InitializeVI subVI (b) Flow detection subVI
Flow detection: This sub VI gives the linearised flow rate in ltr/min and the level in ltrs. The frequency is found out using extract single tone information which is used to scan from 10 to 60Hz.
Motor: This sub VI is used to control the motor and to restrict the input voltage to 0-5 Volt. The input to the motor is coerced to be in the range of 0 to 5 volt using in range and coerce VI.
Fig. 7 (a) motor subVI (b) Solenoid subVI
V. SIMULATION
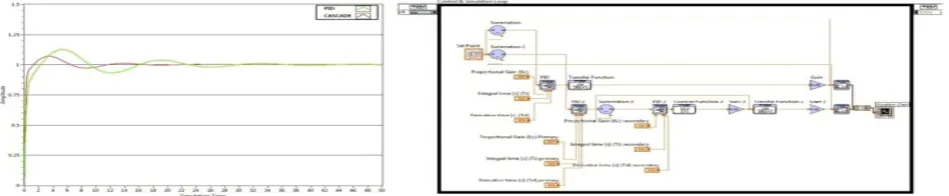
Both the cascade and the PID control strategy are simulated using LabVIEW and MATLAB using the modeled transfer functions.The simulation models and the results are shown below.
Fig. 8 Simulation model and result of PID and Cascade scheme
VI.RESULTS AND DISCUSSION
Performance evaluation of the PID and Cascade is done for the following set of tuned parameters. For PID(Kp=10,Ti=0.009s,Td=0.04s) and cascade(primary: Kp=10, Ti=0.003s, Td=0.036s; secondary
:Kp=0.5,Ti=0.06s,Td=0.02s)
A step change is made in set point is made to both the controllers and for set point changes from 5-6 ltrs, 6-7 ltrs, 7-8 ltrs, 8-9 ltrs the following results are found.
·
PID CASCADE
IAE 5-6 ltrs 35.99827 35.15663
6-7 ltrs 29.23493 23.13329
7-8 ltrs 29.66717 28.18871
8-9 ltrs 32.41077 23.50239
ISE 5-6 ltrs 29.11729 29.41989
6-7 ltrs 21.16549 15.94787
7-8 ltrs 22.2217 20.40915
The average IAE for PID is found to be 31.828 whereas for cascade it is 27.495.
Similarly the average ISE for PID is found out to be 24.233 whereas for cascade it is 20.279. The above results shows that cascade gives a less IAE and ISE than PID.
PID CASCADE Settling time 1% error band(in sec) 76 65
Peak Time (in sec) 64 49 Rise Time (80%) (in sec) 41 39
Table 6 Transient performance of PID and cascade
From the above results it can be seen that the transient response is better in case of cascade than that of PID.
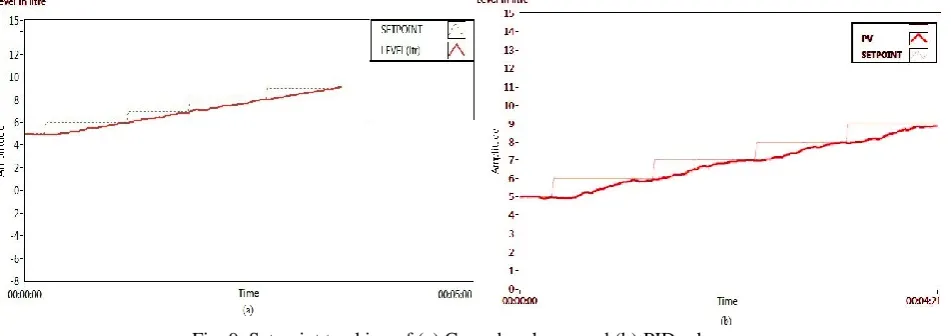
Further evaluation on PID and Cascade controller for set point tracking is done. The respective plots for set point tracking are shown below.
Fig. 9 Set point tracking of (a) Cascade scheme and (b) PID scheme.
The above graphs shows that cascade controller is better in set point tracking and also gives a smooth linear tracking with less deviations
VI.CONCLUSION
Results show that Cascade controller improves the performance of the process in terms of improved transient response and tracking. Cascade controller also helps to reduce IAE and ISE of the process. Thus we show that conventional controllers can be improvised using advanced controlling methods such as cascade controller. Hence cascade controller is recommendable over PID when a better control is required in case of processes like level which are prone to disturbances.
REFERENCES
1. N. Nithya Rani, Jagatis Kumaar B,Vivek Vijayan C, Vinoth K “Controlling of Multivariable Process Station Using – Cascade and a Selector in
LabVIEW”International Journal of Advanced Research in Electrical, Electronics and Instrumentation EngineeringVol. 3, Issue 9, September 2014
2. Pooja Panchal, Alpesh Patel, Jayesh Barve “PI Control of Level Control System using PLC and LabVIEW based SCADA”2015 International Conference on
Industrial Instrumentation and Control (ICIC) May 28-30, 2015
3. Harsh Kaji, Shruti Annigeri,Prafulla Patil “Designing PID Controller using LabVIEW for Controlling Fluid Level of Vessel” International Journal of Engineering
Research and Applications (IJERA) , Vol. 3, Issue 2, March -April 2013
4. Donald R. Coughanowr, Steven E. LeBlanc “Process systems analysis and control”, Third edition by, McGraw-Hills international publication.
5. “PID Contol Toolkit Manual,” National Instruments, 2006.http://www.ni.com.