DOI: http://dx.doi.org/10.26483/ijarcs.v10i5.6464
Volume 10, No. 5, September-October 2019
International Journal of Advanced Research in Computer Science RESEARCH PAPER
Available Online at www.ijarcs.info
ISSN No. 0976-5697 ISSN No. 0976-5697
BREAST CANCER DETECTION USING MACHINE LEARNING TECHNIQUES
Seid Hassen Yesuf Department of Computer Science, University of Gondar, Gondar, Ethiopia
Abstract: Breast cancer is one of the most common kind of cancer, as well as the leading cause of mortality among women. Radiologists use mammograms pictures of the breast, to look for signs of possible tumor formation such as breast masses, lumps of tissue that could be formed by cancer cells, and micro-calcifications, small calcium deposits that cluster around abnormal tissue. Machine learning algorithms used for classification of benign and malignant tumor wherein machine is learned from the past data and can predict the category of new input. In this study a performance comparison between different machine learning algorithm of support vector machine (SVM), artificial neural network (ANN), Bayesian Network (NB) and k-nearest neighbor (K-NN) on Wisconsin Breast Cancer datasets from the UCI Machine Learning Repository data sets is conducted. The experimental results have shown that support vector machine methods achieved higher accuracy on the task of breast cancer detection, achieved accuracy within the range of 97.6% to 98.8% which is an impressive accuracy for supervised pattern classification.
Keywords: Support vector Machine, Breast Cancer, Artificial Neural Network, Bayesian Network
I.INTRODUCTION
Cancer is a condition of abnormal cell growth in the body. Sometimes cells growth becomes unregulated (Mutation in genes). This can be occurring under changes in some factors: physical, chemical or environmental. They start to replicate uncontrollably meaning more reproduced cells than died cells which results in masses of cells called tumors. Cancers in their early stages are vulnerable to treatment while cancers in their most advanced stages are usually almost impossible to treat. Cancer is a major root cause of disease among human deaths in many developed countries and classification of cancer in medical practice trusted on clinical and histopathological facts may produce incomplete or misleading results. The DNA microarray is very useful to determine the expression level of thousands of genes simultaneously in a cell mixture. DNA microarray technology has been applied to find out the accurate prediction and diagnosis of cancer. Molecular level diagnostics with gene expression profiles can offer the methodology of accurate and systematic cancer classification. It’s very important for treatment of cancer to classify tumor accurately. Since the gene expression data generally comprise of huge number of genes, several scholars have been scrutinizing the problems of cancer classification using data mining approaches, statistical methods and machine learning algorithms to effectually evaluate these data [1], [2].
Breast cancer is the most commonly diagnosed cancer in women and its death rates are among the highest of any cancer. In the past decades, pathologists have examined histopathological images using manual methods for disease diagnosis. They visualize the regularities and distributions of the tissue under microscope. Based on their personal experiences in cell morphology, pathologists discriminate between different cells in tissue and then they determine the pattern of biopsy samples examined. The manual
diagnostic preciseness and accuracy is a problematic task since the outputs will occur with considerable variability and depends of the skill and experience of the physicians. Automated system is becoming an essential tool to assist radiologists and pathologists with interpretation of diseases. Automated system can be defined as secondary reader using different screening tools in detecting abnormalities, lesions and masses. Recently, there are different methods and tools for cancer detection: such tools are Mammogram which use x-rays with different wavelengths, while Ultrasound tools uses sound waves and MRI that uses magnetic energy & radio waves [3], [25]. Breast tumor is identified by different names, depending on where it starts in the woman's breast. Scientists are not sure of the exact cause of breast cancer, but they have identified high risk factors for this disease. The most common factors include: age, family history and personal history. The most common symptom is a painless lump in the breast. At times, a painful lump in the breast turns out to be cancer (malignant). One or more lumps in the armpit can be a symptom of breast cancer; however, they can also be due to non-cancerous (benign) conditions. The majority of breast tumors detected by mammography are benign. They are non-cancerous growths and cannot spread outside of the breast to other organs. The bleeding from the nipple can indicate the presence of cancer, especially if the bleeding occurs from one breast only [4].
Non-cancerous (benign) tumors of the breast comprise fibro-adenoma, duct papilloma, adenoma and connective tissue tumors. The most common benign breast tumor is the fibro-adenoma. This tumor is a combined product of both connective tissue and epithelial cells in the breast. Most benign masses are circumscribed due to the absence of infiltration [5].
lobules in the breast tissue. These malignant cells are confined to the basement membrane and have not yet invaded the breast stroma or lymphatics. The two forms of non-invasive breast cancer are Ductal Carcinoma In Situ (DCIS) and Lobular Carcinoma In Situ (LCIS) [6]. Invasive breast cancer, also known as infiltrating cancer, occurs when malignant cells have spread beyond the ducts or lobules to other parts of the breast or body. Invasive cancers vary in size from less than 10mm in diameter to over 80mm, but are usually 20 to 30mm at presentation [7]. The objective of computer based breast cancer detection systems is to decrease the number of false Positive (FPs) and to achieve high sensitivity and specificity for detecting cancers that radiologists might miss [8].
II. MACHINE LEARNING AND IMAGE PROCESSING TECHNIQUES
A. Machine Learning Techniques
Machine learning is a branch of artificial intelligence that incorporate a variety of statistical, probabilistic and optimization techniques that allow computers to “learn” from past examples and to detect hard to-diagnosed patterns from massive, noisy or complex data sets. These features are particularly well-suited to medical applications, especially those that depend on complex proteomic and genomic measurements. At the classification stage, the patterns of the region of interests (abnormalities in breast tissue) are classified as either benign or malignant on the basis of the optimum subset texture features selected for machine learning modeling. A classifier trained on known abnormalities (mass lesions and Micro-calcifications/MCCs) combines the selected features and uses confidence measures to indicate the ROI that is either malignant or benign [8]. Various machine learning techniques are used for cancer classification, such as support vector machine, k-nearest neighbor and neural network techniques etc.
Support Vector Machines: Support vector machines (SVM) are today’s most powerful classification algorithm in terms of predictive accuracy. SVM is a supervised learning technique that seeks an optimal hyper-plane to separate two classes of samples. Mapping the input data into a higher dimension space is done by using Kernel functions with the aim of obtaining a better distribution of the data. The SVM algorithm as a relatively new classification or prediction method.
K-NearestNeighbor (KNN) is based on the principle that the instances within a dataset will generally exist in close proximity to other instances that have similar properties. If the instances are tagged with a classification label, then the value of the label of an unclassified instance can be determined by observing the class of its nearest neighbors. K-nearest neighbor (KNN) classifier distinguishes unknown patterns based on the similarity to known samples. The KNN algorithm computes the distances from an unknown pattern to every sample and selects the K-nearest samples as the base for classification. The unknown pattern is assigned to the class containing the most samples among the K-nearest samples. The KNN locates the k
nearest instances to the query instance and determines its class by identifying the single most frequent class label. Neural Network: Neural Network (NN) is a prevailing AI technique that has the capability to learn a set of data and constructs weight matrixes to represent the learning patterns. The artificial neural networks (ANNs) are non- parametric pattern recognition systems that can extract general rules by learning from real data or examples. Where decision rules are vague and there is no explicit knowledge about the probability density functions governing sample distributions, this method is useful. The key characteristics of the artificial neural networks are the distributed representation, the local operations and nonlinear processing.
B. Breast Imaging for Screening and Diagnosing Cancer
Medical imaging modality is one of the best way to diagnosis and evaluate the early stage of cancer. Mammogram, Magnetic Resonance Imaging (MRI), Ultrasonography are most frequently used imaging modality to diagnosis breast cancer. Among these, the most effective method of early detection of the breast cancer is mammograms. But certain characteristics in the mammograms imaging fail to determine whether cancer exists or not. Breast cancer often presents as a mass with or without the presence of calcifications. The location, size, shape, density and margins of the mass are useful for the radiologist in evaluating the likelihood of cancer. The proposed system consists of image preprocessing, segmentation of breast image, feature extraction, feature selection and feature classification components. Breast image analysis can be performed using X-rays,
III. RELATED WORKS
Classification algorithms are effectively way to classify data. There are many researches that has been conducted to apply machine learning algorithms on different medical data sets to classify breast cancer. Many researchers show good classification accuracy for breast cancer detection. Authors [25] proposed a Support Vector Machines (SVMs) based classifier in comparison with Bayesian classifiers and Artificial Neural Networks for the prognosis and diagnosis of breast cancer disease. The paper provides the implementation details along with the corresponding results for all the assessed classifiers. A SVM model is implemented for the breast cancer diagnosis and prognosis problem using the Wisconsin Diagnostic Breast Cancer (WDBC) as well as the Wisconsin Prognostic Breast Cancer (WPBC) datasets. The optimized SVM algorithm performed excellently, exhibiting high values of accuracy (up to 96.91%), specificity (up 97.67%) and sensitivity (up to 97.84%).
The authors [15] proposed a technique to classify cancer using supervised and unsupervised learning methods. In supervised learning, a single hidden layer feed forward NN with back-propagation training is applied for error minimization. Various activation functions such as sigmoid, sinusoid and Gaussian are tested to establish different network configurations. In unsupervised learning, fuzzy and no fuzzy and c-means clustering methods were used. Several characteristics such as cell size, average intensity, texture, shape factor and pgDNA are used as the input for the network. Results are evaluated using 467 images from six different types of tumour classes. 96.9% classification rate is obtained using neural network techniques, while fuzzy cmeans results achieved an accuracy of 76.50%.
The authors [16] proposed an approach for breast cancer distinguishing between different classes of breast cancer. This approach is based on the Wisconsin Diagnostic and Prognostic Breast Cancer datasets for feature selection, and the classification of different types of breast cancer using neural network approach, and especially the multi-layer perceptron MLP and the radial basis function RBF. The data set consists of nine features that represent the input layer to the neural network. The neural network will classify the input features into two classes of cancer type (benign and malignant). The proposed approach tested on the database, resulted in 97 % succession rate of classification using RBF neural network.
One of the main limitations of applying neural networks to analyze massive data mining databases is the excessive processing that is required. It is not uncommon for a data mining neural networks to take weeks or months to complete its task. This time constraint is infeasible for most real work applications. However, processing time can be substantially reduced by distributing the load of computation amongmultiple processors.
The authors [14] have used support vector machine method for diagnosis of breast cancer. SVMscan only be used for
classification, not for function approximation. The Support Vector Machine (SVM) is implemented using the kernel Adatron algorithm. Support Vector Machine method was used on the set of 683 samples of actual data. Additional set of data of 117 samples is generated using Neural Network. Using Support Vector Machine, the prediction of diagnosis and detection of breast cancer is comparably accurate than the human being. The efficiency of manual detection of breast cancer is 85% and the efficiency of the support vector machine recognition obtained is nearly 97%. This high rate of accuracy can be utilized to support the Doctor’s decision to avoid Biopsy.
Authors [17] evaluated two different Bayesian classifiers; tree augmented Naive Bayes and Markov blanket estimation networks to build an ensemble model for prediction the severity of breast masses. The objective of the proposed algorithm was to help physicians in their decisions to perform a breast biopsy on a suspicious lesion seen in a mammogram image results. The authors have found the Bayesian network classifiers to be a competitive alternative to other techniques in medical applications. Authors [18] proposed Bayesian network (BN) applied in the domain of emergency medicine where BN are found to be an appropriate technique because of their symbolic representation, handling of uncertainty, where different scenarios are possible by given evidences.
The authors[24] have chosen thermo-gram image for detecting breast cancer as it is cheaper and safer than other methods. It can detect cancer earlier stage compared to other images or tests. They selected 18 cases with 9 abnormal and 9 normal cases. KNN classifier as used to improve accuracy. The result ere 88.88% for abnormal and 94.44% for normal cases.
In general, the whole attempts lie down either in fully automatic or semi-automatic breast cancer detection. In this research, an attempt is made to consider the integration of different level of segmentation using adaptive technique and wavelet transform will be applied for better diagnosis of breast cancer.
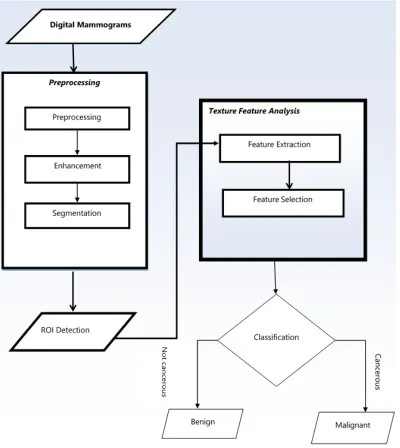
IV.THE PROPOSED SYSTEM ARCHITECTURE USING MACHINE LEARNING TECHNIQUES
component, feature selection needs to be performed in order to select the optimal subset of features from each ROI. The fifth component, classification is grouping of the region of interest as masses or non-masses through machine learning approaches. Finally, appropriate machine learning pattern identifier is selected to classify a digital mammogram in to its class.
The aim of preprocessing in the proposed architecture is to improve the quality of digital mammograms images by suppressing unnecessary parts or by enhancing major image features that are important for further processes. Preprocessing used to analysis of image-to-image transformation that is used for image enhancement that increase contrasts, for image restoration that is used to correct for geometrical distortions and non-uniform lighting in the image acquisition and for feature extraction. Median filter is a nonlinear filter used to suppress noisy images and improve the contrast of the image. The processed mammogram image is inputted to ROI detection module in order to extract one or more ROIs from background. This ROI s are regions which likely contain a massive lesion. Each detected ROIs is then labeled at true positive ROI (TP ROI) or false positive ROI (FP ROI). The underlying principle of preprocessing is to enlarge the intensity difference between objects and background and to produce reliable representations of breast tissue structures. Image enhancement can improve the radiologists’ perception to understated diagnosis, and consequently to more accurate diagnosis. Image enhancement includes techniques such as contrast and intensity manipulation, additional reduction of noise, background removal, edges sharpening and filtering. The usual task of mammogram enhancement is to increase the contrast between regions of interest (ROI) and background and to sharpen the edges or borders of regions of interest. The major problem corresponds to the under-enhancement of some regions and over-enhancement of others. Under enhancement can cause false negatives, and over-enhancement can cause false positive. Mammography lesions such as Micro-calcifications and masses are usually small and have low contrast regarding to the contiguous breast tissues, thus abnormalities are hard to detect. So the task of mammogram enhancement is to increase the contrast between regions of interest and background and to sharpen the edges or borders of regions of interest.
The segmentation can be done in order to find locations of suspicious areas to assist radiologists for diagnosis or to classify the abnormalities as benign or malignant. The segmentation component is used to separate the suspicious regions that may contain masses from the background parenchyma, i.e., to partition the mammogram into several non- overlapping regions, then extract regions of interests (ROIs), and locate the suspicious mass candidates from ROIs. The suspicious area is an area that is brighter than its surroundings, has almost uniform density, has a regular shape with varying size, and has fuzzy boundaries. Since the masses are brighter than the surrounding tissues, it makes thresholding a useful method for segmentation. The regions with abnormalities impose the extra peaks on
histogram while a healthy region has only a single peak. After noise suppression and artifact suppression, image segmentation identifies suspicious areas (ROIs) in the mammogram images. Segmentation used to obtain ROIs containing all breast abnormalities from the breast tissue and locate suspicious lesions and MCCs from the ROIs. Mammographic abnormalities such as mass lesions are extremely difficult to identify because of their radiographic and morphological characteristics resemble those of normal breast tissues. Since a digital mammogram is a projection image, mass lesions do not appear as isolated densities but as overlaid over parenchymal tissue patterns. Therefore, segmentation used in this paper is the process of dividing an image into different homogeneous regions such that the pixels in each partitioned region possess an identical set of properties or attributes. The result of segmentation is a number of homogeneous regions, each having a unique label. In this research thresholding and region based segmentation used to isolate region of interest from the background noise and wavelet transform is used to extract high level details from digital mammograms images.
Feature extraction techniques applied to digital mammography for the purpose of detection of mass lesions and micro-calcifications. The features can be calculated from the ROI characteristics such as the size, shape, density, and smoothness of borders, etc. The feature space is very large and complex due to the wide diversity of the normal tissues and the variety of the abnormalities. In feature extraction step the features are calculated from the features of the region of interest. Throughout feature extraction, features are computed from the characteristics of the segmented ROIs.
Finally, the features related to masses are extracted and
selected, the features are input into a classifier to classify the detected suspicious areas into benign masses, or malignant masses. In this research support vector machine
[image:5.612.111.511.96.544.2](SVM) and Artificial neural network (ANN) features and classification methods have been used to detect and classify the lesions as malignant or benign.
Figure 1: Architecture of Breast Cancer Detection Using Machine Learning Techniques
V.EXPERIMENTS
In this study, a total of two experiments are conducted using supervised machine learning classifier of Weka 3.8 Package and the prototype was developed using MATLAB. The first experiment is conducted on determining the appropriate test option to find out the best training and testing split options that performs better result for this study which are investigated. The second experiment was carried out to compare the accuracy of 10-fold cross validation with different percentile split option other than the default 66% split test option is investigated. As perceived from Table 1, the total number of Wisconsin Diagnosis Breast Cancer obtained from the acquired digital
recognizer, while weights are updated to obtain a desired response. Hence, I am going to design the identifier by partitioning the total dataset in to training, validation and testing data set. After the training state, the performance of the network was tested by using dataset. To evaluate the performance of developed automated breast cancer detection systems using supervised machine learning techniques such as ANNs, BN,KNN and SVM, the binary classification performance has to be measured. For this research two well-known datasets such as Wisconsin
[image:6.612.57.535.183.264.2]Breast Cancer datasets from the UCI Machine Learning Repository [20] and Mammographic image analysis society (MIAS)[21] are used. These two datasets are widely used for CAD systems and research works. This dataset distinguishes into two main classes malignant (cancerous) from benign (non-cancerous) samples with varying number of image samples. Each dataset consists of some classification instances with a set of numerical features or attributes.
TABLE 1: CONFUSION MATRIX VALUES OF SENSITIVITY AND SPECIFICITY
CLASSIFIERS
10-FOLD CV 66% SPLIT 70% SPLIT 75% SPLIT 80% SPLIT
SENS SPEC SENS SPEC SENS SPEC SENS SPEC SENS SPEC
SVM 99.7% 94.8% 100% 93.2% 99.1% 95.4% 98.8% 96.4% 100% 95.9%
ANN 97.2% 94.3% 98.3% 93.2% 98.1% 98.1% 96.5% 94.6% 96.9% 95.9%
BN 96.4% 93.4% 94.1% 94.5% 94.3% 93.8% 94.2% 92.8% 92.3% 95.9%
K-NN 95.3% 93.1% 94.3% 94.2% 94.1% 93.5% 94.3% 92.3% 92.1% 93.5%
As shown from table 1 support vector machine achieve higher sensitivity and specificity than artificial neural network and Bayesian network. Confusion matrix of sensitivity and specificity defined as True Positive (TP) is a tumor marked as malignant, which is also classified as malignant by the learning machine. False Positive (FP) is a Tumor marked as malignant, which is classified as benign by the learning machine. True Negative (FN) is a tumor marked as benign, which is also classified as benign by the learning machine. False Negative (FN) is a tumor marked as benign, which is classified as malignant by the learning machine. The performance of a binary classifier cannot be described by a single value and is usually quantified by its accuracy during the test phase, i.e., the fraction of misclassified points on the test set. The performance of a binary classifier can be best described in terms of its sensitivity and specificity, quantifying its performance to false positive (FP) and false negative (FN) instances.
VI. TEST RESULTS
Experiment I: Determining the appropriate test options It is argued by [22] that 10-fold cross validation (CV) test split option is appropriate for small datasets. The dataset used in this study has on average 210 instances per classifier which is a small data set. In order to test whether 10-fold CV outperforms the default 66% test split option in Weka, an experiment is conducted ten times for each classifier and an average accuracy is taken.
TABLE 2:COMPARISON OF10-FOLD CV AND 66% SPLIT TEST OPTIONS
Classifiers Accuracy
10-fold CV 66% split
SVM 97.8% 97.4%
ANN 96.1% 96.3%
BN 95.2% 94.3%
KNN 96.4% 95.1%
SVM 97.8% 97.4%
As presented in Table 2, 10-fold CV performs better than 66% split in all of the three classifiers. This is due to the
appropriateness of 10- fold CV for small dataset. It is because it performs the training 10 times increasing the training dataset by 10-fold.
Experiment II: Comparing 10-fold CV test option with other test split options
[image:6.612.340.536.468.557.2]In experiment II it has been found that 10-fold CV works better relative to 66% test split option for dataset used in this study. A further experiment is conducted ten times and an average accuracy is calculated to compare 10-fold CV with another test split option. The test split options are randomly taken with five ranges which are 70%, 75%, 80%, 85%, and 90%. The percent refers to the portion of the data that is allocated for training and the rest is for testing.
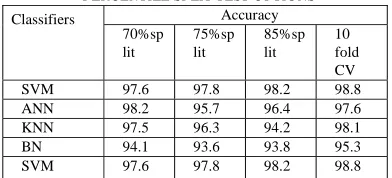
TABLE 3: COMPARISON OF 10-FOLD CV AND DIFFERENT PERCENTILE SPLIT TEST OPTIONS
Classifiers Accuracy
70%sp lit
75%sp lit
85%sp lit
10 fold CV
SVM 97.6 97.8 98.2 98.8
ANN 98.2 95.7 96.4 97.6
KNN 97.5 96.3 94.2 98.1
BN 94.1 93.6 93.8 95.3
SVM 97.6 97.8 98.2 98.8
As it is indicated in table 3 10-fold CV performs better in Bayesian network classifiers. Classifiers support vector machine 80% split and 85% split and feed forward multilayer perception neural network 70% split and 85% options achieved better result than 10-fold CV. From the experiment results for all classifier 85% split will be used as it achieved a better result relative to 10-fold CV and other test split options and support vector machine is better than artificial neural network, k-nearest neighbor and Bayesian network classifier for breast cancer detection.
VII.CONCLUSION AND FUTURE WORKS
examination, yet the detection rate endures to be very low. In this research study breast cancer detection using machine learning technique follows image acquisition, preprocessing, segmentation, feature extraction and classification and interpretation of images were introduced. The significance of the proposed system has brought change in the process of diagnosis in terms of accuracy and efficiency. The experimental results have shown that breast cancer detection using support vector machine achieved accuracy of 98.8% which is impressive accuracy for supervised pattern classifier. When this level of accuracy was compared to that of Bayesian Network, k-nearest neighbor and artificial neural network, the developed system with support vector machine was found to excel. This implies the developed system using support vector machine could improve the problems that the field faced before in its dependence on expert’s skills and experience and delay in breast cancer diagnosis.
Thus, future works that we recommended the development Identification of breast cancer type by exploring color and shape features to enhance breast cancer. In addition to supervised approach, there is also unsupervised approach need to be investigated for breast cancer detection systems.
REFERENCES
[1] J. Han and M. Kamber (2000). “Data Mining; Concepts and Techniques,” Morgan Kaufmann” Publishers.
[2] T. Mitchell (1997). “Machine Learning,” McGraw Hill. [3] Brzakovic, D., Luo, X.M., Brzakovic, P(1990). “An approach
to automated detection of tumors in mammograms.” IEEE Transactions on Medical Imaging 9(3), 233–241.
[4] Kopans, D.B. (1989) Breast Imaging. J. B. Lippincott Company
[5] Bassett, L. W. Jackson, V. P. Jahan, R. Fu Y. S., and Gold, R. H. (1997). Diagnosis of Diseases of the Breast, W. B. Saunders Company
[6] Palmer, G.M. Zhu, C. Breslin, T.M. Xu, F. Gilchrist, K.W. and Ramanujam, N. (2003). Comparison of Multiexcitation Fluorescence and Diffuse Reflectance Spectroscopy for the Diagnosis of Breast Cancer, IEEE Transactions on Biomedical Engineering, vol. 50, no. 11, pp. 1233-1242. [7] Lu, S. Bottema, M.J. (2001) Classifying lobular and DCIS
microcalcification. In Yaffe, M.J. editor, Digital Mammography 2000, in Proc. of the 5th International Workshop on Digital Mammography, Madison, Medical Physics Publishing, pp. 280–284.
[8] Duda, R.O. Hart, R.E. Stork, D.G. (2001). Pattern Classification. John Wiley & Sons
[9] MohiyHadhoud, ohamed Amin, WalidDabbour (2005) “Detection of breast cancer tumor using mathematical morphology and wavelet analysis”, in GVIP 05 conference, CICC, Cairo, Egypt.
[10]F. van Gelderen (2004). “Understanding X-Rays: A Synopsis of Radiology”. Springer.
[11]E. Pisano, M. Yaffe, B. Hemminger, R. Hendrick, L. Niklason, A. Maidment, C. Kimme-Smith, S. Feig, E. Sickles, and M. Braeuning(2000).“Current status of fueled digital mammography, Acad. Radiololgy”., vol. 7, no.4,pp.266280. [12]National Cancer Institute (2014). Mammograms. electronic.
Available on cancer.gov/cancer topics/types/breast/ mammograms-fact-sheet.
[13]Breast Cancer Surveillance Consortium (2013). “Performance measures for 1,838,372 screening mammography examinations from 2004 to 2008 by age based on BCSC data through 2009. Electronic”..
[14]SUDHIR D. SAWARKAR,GHATOL (2006), Neural network aided Breast Cancer Detection & diagnosis using Support Vector Machine, Proceeding of 7th WSEAS International conference on Neural Network,June 12-14,(pp 158-163) [15]Hu Y., Ashenayi K., Veltri, R., O'Dowd G., Miller G., Hurst
R. Bonner (1994). A comparisonof neural network and fuzzy c means methods in bladder cancer cell classification; In Proceedingsof IEEE World Congress on Computational Intelligence; 6; p. 3461 – 3466.
[16]Ali Raad, Ali Kalakech ,MohammadAyache (2012). Breast cancer classification using neuralnetworkapproach ;MLP& RBF,13th International Arab Conference on Information TechnologyACIT,ISSN.182-0857.
[17]Alaa M. Elsayad (2010). “Predicting the severity of breast masses with ensemble of Bayesian classifiers” , Journal of computer science 6(5);576-584.
[18]Miljenko, K., MatejMertik(2008). “Application of Bayesian networks in emergency medicine”.
[19]Suckling etal. (1994). “The Mammographic Image Analysis Society Digital Mammogram Database”. In: Proceedings of the 2nd International Workshop on Digital Mammography, York, England, July 1012, pp. 375–378. Elsevier Science, Amsterdam.
[20]B.Ster, and A.Dobnikar (1996). “Neural networks in medical diagnosis: Comparison with othermethods.” Proceedings of the international conference on engineering applications of neural networks pp. 427–430. 1996.
[21]S.Doyle, S.Agner, A.Madabhushi, M.Feldman, J.Tomaszewski.(2006). “A boosting cascade for automated detection of prostate cancer from digitized histology”. 13th International Conference on Medical Image Computing and Computer Assisted Intervention pp. 504–511.
[22]Sickles, E.A. (1984). Mammographic features of early breast cancer, American Journal of Roentgenology, vol. 143, pp. 61-464.
[23]Kanaga, K.C.1, Anandan, S.2, Chin, M.Y.1 &Laila(2008). “Characterization of micro- calcifications and mass on female breast using processing in full field digital mammography (FFDM)”, symposium sainskesihatankebangsaanke 7, hotel legend, Kuala Lumpur, 183-187.
[24]T.M.MejiaM.G.Perez,V.H.Andaluz and A. Conci (2015) “Automatic Segmentation and analysis of Thermogram using texture descriptors for breast cancer detection” Asia-pacific conf. comput. aided syst. Eng. pp24-29.
[25]M.Stalin and R.Kalaimagal(2016) “Breast cancer diagnosis from low intensity asymmetry thermogram breast image usingfast support vector machine” i-manager’s jornal on image processing,vol.3,no.3,pp17-26
AUTHOR’S PROFILE