DOI: http://dx.doi.org/10.26483/ijarcs.v9i1.5220
Volume 9, No. 1, January-February 2018
International Journal of Advanced Research in Computer Science
RESEARCH PAPER
Available Online at www.ijarcs.info
ISSN No. 0976‐5697
AN EFFICIENT CLASSIFICATIONS MODEL FOR BREAST CANCER
PREDICTION BASED ON DIMENSIONALITY REDUCTION TECHNIQUES
B. Tamilvanan
Research and Development Centre Bharathiar University, Coimbatore-641046, TN, India.
Dr.V. Murali Bhaskaran
Principal
Dhirajlal Gandhi College of Technology Salem- 636290, TN, India.
Abstract: Classification algorithms are efficiently utilized in the area of general medical diagnosis applications in order to identify the disorders in advance. One such disease, breast cancer is the most prevalent and earnest quandary with women in most of the developing countries. Many attempts are made in order to identify this problem with the objective of high precision and better accuracy. In this paper, an attempt is made with the most popular and efficient classification algorithms namely Naive Bayes, Multilayer Perceptron, Radial basis function network, nearest neighbour, Conjunctive rule to amend the efficiency of the detection, accuracy for the breast cancer dataset. As an objective of improving accuracy, an efficient dimensionality reduction technique is incorporated in this work. The performances of these approaches are evaluated using the metrics such as the precision, recall, f-measure, roc, Balanced Classification Rate (BCR), Matthews Correlation Coefficient (MCC) and accuracy. From these measures it is clearly observed that Naive Bayes algorithm is able to achieve high accuracy rate along with minimum error rate when compared to other algorithms. The review can be stretched out to draw the execution of other characterization systems on an extended information set with more particular ascribes to get more exact outcomes.
Keywords: Classification, Naive Bayes, Multilayer Perceptron, Radial Basis Function network, Nearest Neighbour, Conjunctive Rule.
INTRODUCTION
Data mining strategies and software are utilized in a large vary of fields, together with banking, gregarious science, inculcation, enterprise industries, bioinformatics, weather, forecasting healthcare and sizably voluminous data [1] [2]. Nowadays fitness care industry generates a massive amount of information about patients, ailment diagnosis, etc. Some exceptional types of processes to constructing correct classifications have been proposed (e.g., NB, MLP, RBFnet, NN, CJ). In classification, we supply a Breast Cancer data set of example document or the input data, called the check data set, with every document consisting of various attributes.
An attribute can be both a numerical attribute or categorical attribute. If values of an attributes belong to an authoritatively mandated domain, the attribute is referred to as numerical attribute ( e.g. Tumor-size, Deg-Malig, Menopause, Age, Inv-nodes). A categorical attribute (e.g. Irradiant, Breast, Node-cape, Breast-Quad, Class). Classification is the process of splitting a dataset into mutually exclusive groups, called a class, based on suitable attributes.
In this world, distinctive sorts of Breast Cancer maladies are a typical type of disease influencing all ladies of various ages. Bosom disease influences the bosom tissue and lobules. The classification of breast cancer is resulted from its origination, if breast cancer is originated from milk ducts then it is known as ductal carcinoma while cancer cells found in lobules makes cancer termed as “lobular carcinoma.” The screening of bosom malignancy is an essential stride which sift through the manifestations that can be utilized to analyze the patient's real obsessive
condition. Breast cancer is the most continuous reason for death in more established ladies however in the meantime, it is critical to note that more youthful ladies who don't go under tumor screening process stay in risk hover of breast cancer.
In this paper is planned accordingly: the relates works and demonstration of the focused parts of the utilized data mining methods in part 1. The details of the dataset for Breast Cancer in part 2. The experimentation outcome and conversation in part 3. And lastly, conclude the paper and future enhancements.
LITERATURE REVIEW
A multinomial logistic-regression model with a hill-like estimator generalizes logistic regression by using more than two distinct outcomes between the categorical and multinomial distributions [3].This model is mainly designed to predict the probabilities of different outcomes when using categorically dependent and independent variables.
An RBF network is an ANN that uses the K-means clustering algorithm to implement the activation functions and can study both discrete class and numeric class problem. The RBF network generally includes three layers: input, hidden, and output [4].
Nearest Neighbor classification is predominantly used when all attribute values are unbroken, although it can be suitably modified to deal with categorical attributes. The thought is to assess the arrangement of a shrouded case utilizing the characterization of the occurrence or cases that are nearest to it, in some sense that we need to define [5].
conjunctive rule approach reads a set of rules directly from a decision tree algorithm. One rule is generated for each leaf on the tree. The voyaging way hub from the root hub to that terminal hub incorporates the forerunners of the run, and this is resulting of the last terminal hub allocated class esteem. The antecedents of the rule are conjunctive with logic operator AND, and the consequents are the available class values in the attribute class[6]. In this section of Conjunctive rules, the antecedent is of the following form: a = a1 ^a2 ^a3 ^:::^an:
PROPOSED METHOD NAIVE BAYES
Naive Bayesian classifiers assume that the effect of an attribute value on a given class is independent of the values of the other attributes. This assumption is called class conditional independence. It is made to simplify the computation involved and, in this sense, is considered ”naive.”
Bayes theorem provides a way of manipulative the following probability, P(c|x), from P(c), P(x), and P(x|c). Naive Bayes classifier assumes that the outcome of the value of a predictor (x) on a given class (c) is self-determining of the values of other predictors. This statement is called class conditional independence [7].
P(c| x) =
( | ) ( )
( )
p x c p c
p x
1 2
( | )
(
| ) * (
| ) *....* ( )
p c x
p x c
p x
c
p c
P(c|x) is the subsequent probability of class (target) given predictor (attribute).
P(c) is the previous probability of class.
P(x|c) is the likelihood which is the probability of predictor given class.
P(x) is the prior probability of predictor.
BREAST CANCER DATASET
[image:2.595.49.548.639.777.2]The performance of these two algorithms namely Naive Bayes, Multilayer Perceptron, RBFnetwork, Nearest neighbour, the Conjunctive rule was tested in a medical database for Breast Cancer Disease dataset from UCI machine learning repository (available at http://archive.ics.uci.edu/ml/datasets/Breast+Cancer [8]. The data set has ten features of the attributes. Table- 1 describes the data for Breast Cancer. The medical dataset contains data from reviews conducted among patients, each of which has ten features. All features can be considered as on indicators of Breast Cancer disease for a patient. The dataset holds records of the following attributes.
Table 1: UCI Dataset of Breast Cancer
Attributes Name Attribute Type Description
Age Numeric Age (years)
Inv-Nodes Numeric 0-2, 3-5, 6-8, 9-11, 12-14, 15-17, 18-20, 21-23, 24-26, 27-29, 30-32, 33-35, 36-39
Node-Caps Discrete yes, no.
Menopause Numeric lt40, ge40, premeno
Deg-Malig Numeric 1, 2, 3.
Tumor-Size Numeric 0-4, 5-9, 10-14, 15-19, 20-24, 25-29, 30-34, 35-39, 40-44, 45-49, 50-54, 55-59
Breast Discrete left, right
Breast-Quad Discrete left-up, left-low, right-up, right-low, central.
Irradiat Discrete yes, no.
Class Discrete no-recurrence-events, recurrence-events
Using Best First Search method with 5 potential attributes which are listed in table 4 and table 5 respectively.
Attributes Name Attribute Type Description
Tumor-Size Numeric 0-4, 5-9, 10-14, 15-19, 20-24, 25-29, 30-34, 35-39, 40-44, 45-49, 50-54, 55-59
Inv-Nodes Numeric 0-2, 3-5, 6-8, 9-11, 12-14, 15-17, 18-20, 21-23, 24-26, 27-29, 30-32, 33-35, 36-39
Node-Caps Discrete yes, no.
Breast-Quad Discrete left-up, left-low, right-up, right-low, central.
CONFUSION MATRIX
Precision
It is utilized to speak to the portion of recovered information from associating datasets, which pertain to the search. Precision will be used to represent how many instance have been correctly classified in the confusion matrix table (correct classified data is true positive and incorrect classified data is error positive).
Precision =
tpA
tpA eBA
Where tpA is represented as true positive for the class A and eBA are represented as false positive.
Recall
It is utilized to speak to the portion of recovered information from associating datasets; that are important to the inquiry that is successful. It is used to find out the ratio between the true positive and both true positive and false positive values.
Recall =
tpA
tpA eAB
Where tpA is represented as true positive for the class A and eAB are represented as error positive.
F-measure This is evaluated by the harmonic mean between precision and recall.
F-Measure = 2 *
Precision Recall
*
Precision
Recall
Accuracy This is calculated as the proportion of true positive, true negatives and true results from all the given data.
Accuracy =
tpA tpB
tpA eAB eBA tpB
Error Rate= 1 - Accuracy.
Balanced Classification Rate This is calculated as the proportion of true positive, true negatives and true results from all the given data
BCR = ½ *(TP / (TP + FN) + TN / (TN + FP))
Matthews Correlation Coefficient This is calculated as the proportion of true positive, true negatives and true results from all the given data
*
TP TN
FP
FN
TP
FP TP
FN
TN
FP TN
FN
EXPERIMENT RESULTS AND DISCUSSION
In this section, we describe the test database and experimental analysis and the current evaluation results for three algorithms namely NB, MLP, RBFnet, NN, CJ classifier.
In this experimental analysis, NB, MLP, RBFnet, NN, CJ Algorithms performance were compared based on their application in medical datasets. Weka tool is is utilized for research area, banking sector, education institute and climate datasets. It helps in composed exercises in machine learning, information mining, and web mining. It supports all the mining process to get a valid and clear visualization of accurate results. five-fold cross-validation and ten-fold cross-validation with five and ten attributes were to the input datasets in the experiments.
Experimental Step Up
[image:3.595.82.514.517.650.2]A brief description of the classification process by all five algorithms, NB, MLP, RBFnet, NN, CJ are given below:
Table 2: Performance Measures: Before Feature Selection with five-fold cross validation
Method Precision Recall F-Measure ROC BCR MCC
NB 71% 72% 72% 70% 67% 31%
MLP 65% 66% 66% 64% 60% 17%
RBF 69% 72% 72% 71% 65% 31%
NN 67% 68% 67% 60% 61% 21%
CJ 64% 69% 64% 56% 59% 12%
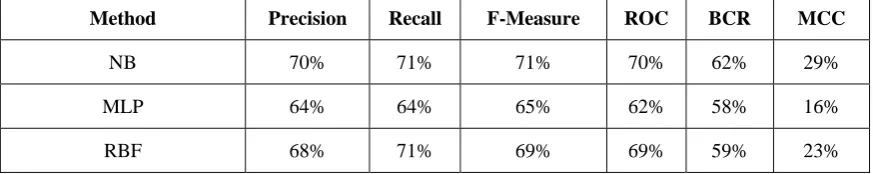
Table 3: Performance Measures: Before Feature Selection with ten-fold cross validation
Method Precision Recall F-Measure ROC BCR MCC
NB 70% 71% 71% 70% 62% 29%
MLP 64% 64% 65% 62% 58% 16%
[image:3.595.80.517.686.773.2]NN 64% 65% 65% 57% 58% 15%
[image:4.595.80.514.132.268.2]CJ 62% 65% 63% 55% 55% 9%
Table 4: Performance Measures: After Feature Selection with five-fold cross validation
Method Precision Recall F-Measure ROC BCR MCC
BFS based CFS-NB 75% 76% 75% 76% 66% 30%
BFS based CFS-MLP 69% 71% 70% 64% 57% 14%
BFS based CFS-RBF 71% 76% 75% 72% 62% 28%
BFS based CFS-NN 70% 71% 70% 57% 59% 16%
[image:4.595.79.519.300.435.2]BFS based CFS-CJ 70% 73% 71% 59% 60% 16%
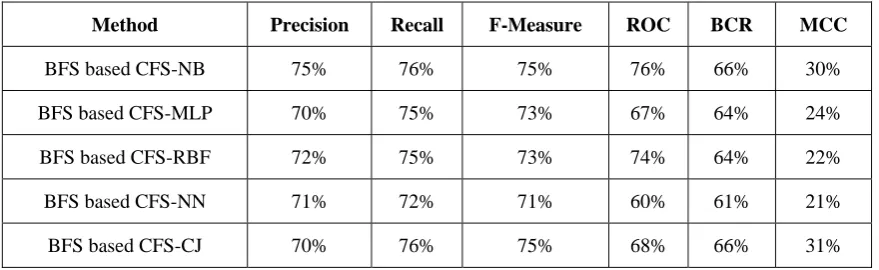
Table 5: Performance Measures: After Feature Selection with ten-fold cross validation
Method Precision Recall F-Measure ROC BCR MCC
BFS based CFS-NB 75% 76% 75% 76% 66% 30%
BFS based CFS-MLP 70% 75% 73% 67% 64% 24%
BFS based CFS-RBF 72% 75% 73% 74% 64% 22%
BFS based CFS-NN 71% 72% 71% 60% 61% 21%
BFS based CFS-CJ 70% 76% 75% 68% 66% 31%
Table 6: Five-fold cross validation Accuracy
Method Before Feature Selection After Feature Selection
NB 73% 76%
MLP 67% 71%
RBF 70% 72%
NN 68% 71%
CJ 70% 73%
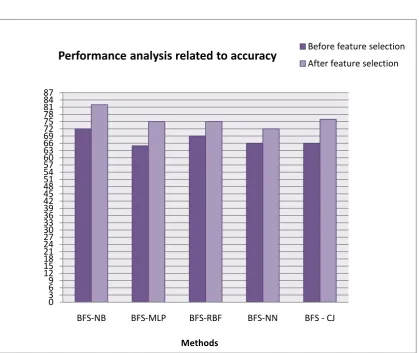
Table 7: Ten-fold cross validation Accuracy
Method Before Feature Selection After Feature Selection
NB 72% 82%
MLP 65% 75% RBF 69% 75%
NN 66% 72%
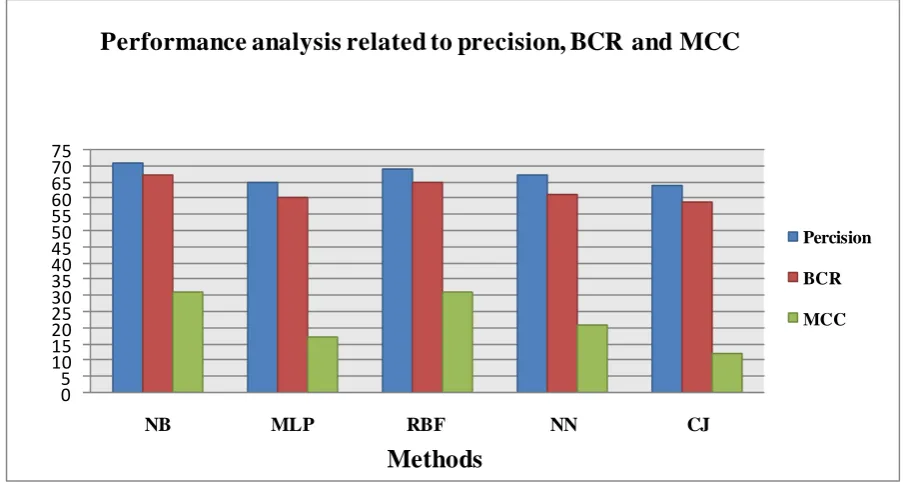
0 5 10 15 20 25 30 35 40 45 50 55 60 65 70 75
NB MLP RBF NN CJ
Methods
Performance analysis related to precision, BCR and MCC
Percision
BCR
[image:5.595.85.537.58.299.2]MCC
Figure 1. Before Feature Selection using 5 - fold cross validation
0 5 10 15 20 25 30 35 40 45 50 55 60 65 70 75
NB MLP RBF NN CJ
Methods
Performance analysis related to precision, BCR and MCC
Percision
BCR
MCC
[image:5.595.78.518.343.662.2]Performance analysis related to precision, BCR and MCC
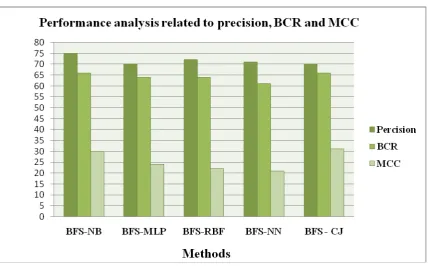
0 5 10 15 20 25 30 35 40 45 50 55 60 65 70 75 80
BFS-NB BFS-MLP BFS-RBF BFS-NN BFS - CJ
Methods
[image:6.595.89.508.64.328.2]Percision BCR MCC
Figure 3. After Feature Selection using 5 - fold cross validation
[image:6.595.85.514.362.628.2]62 63 64 65 66 67 68 69 70 71 72 73 74 75 76 77
BFS-NB BFS-MLP BFS-RBF BFS-NN BFS - CJ
Methods
Performance analysis related to accuracy
Before feature selection [image:7.595.87.509.63.296.2]After feature selection
Figure 5. Accuracy for 5 - fold cross validation
0 3 6 9 12 15 18 21 24 27 30 33 36 39 42 45 48 51 54 57 60 63 66 69 72 75 78 81 84 87
BFS‐NB BFS‐MLP BFS‐RBF BFS‐NN BFS ‐CJ
Methods
Performance
analysis
related
to
accuracy
Before feature selectionAfter feature selection
Figure 6. Accuracy for 10 - fold cross validation
CONCLUSION
In this work popular classification algorithms along with dimension reduction technique are used to predict the breast cancer detection process more efficiently. The efficient five classification algorithms namely NB, MLP, RBFnet, NN, CJ
[image:7.595.90.510.319.672.2]These five algorithms are compared, and accuracy is evaluated for true positive and false positive rate. From the experiments, it is observed that Naive Bayes classification algorithm performs compare than other classification algorithms with 82% and 72% accuracy for both after feature selection and before feature selection using ten-fold cross validations.
REFERENCES
[1] Quinlan J R, Improved use of continuous attributes in C4.5, Journal of Artificial Intelligence Research, 1996, 4: 77-90.
[2] Sitar-Taut, V.A., et al, Using machine learning algorithms in cardiovascular disease risk evaluation. Journal of Applied Computer Science & Mathematics, 2009.
[3] You-Shyang Chen, Modeling hybrid rough set-based classification procedures to identify hemodialysis adequacy for end-stage renal disease patients, Computers in Biology and Medicine, 2013, vol. 43, pp. 1590–1605.
[4] Buhmann, M. D , Radial Basis Functions:Theory and Implementations, Cambridge University Press, 2003.
[5] Bramer, M, Principles of Data Mining, Springer, 2007. [6] O¨mer, A , A rule induction algorithm for knowledge
discovery and classification, Turk.J. Elec. Eng. and Comp. Science, 2013, vol.21 pp. 1223–1241.
[7] http://www.saedsayad.com/naive_bayesian.html
[8] UCI Machine Learning Repository