a
Corresponding author: [email protected]
Status of the design of the ITER ECE diagnostic
G. Taylor1, a, M. E. Austin2, J. H. Beno3, S. Danani4, R. F. Ellis5, R. Feder1, J. L. Hesler6, A. E. Hubbard7, D. W. Johnson1, R. Kumar4, S. Kumar4, V. Kumar4, A. Ouroua3, H. K. B. Pandya4, P. E. Phillips2, C. Roman1, W. L. Rowan2, V. Udintsev8, G. Vayakis 8, and M. Walsh8
1
Princeton Plasma Physics Laboratory, Princeton, NJ 08543, USA 2
Institute for Fusion Studies, University of Texas at Austin, TX 78712, USA 3Center for Electromechanics, University of Texas at Austin, TX 78758, USA 4ITER-India/Institute for Plasma Research, Bhat 382428, Gandhinagar, India 5
University of Maryland, College Park, MD 20742, USA 6Virginia Diodes, Inc. Charlottesville, VA 22902, USA
7Plasma Science and Fusion Center, MIT, Cambridge, MA 02139, USA
8ITER Organization, Route de Vinon sur Verdon, 13115, St Paul Lez Durance, France
Abstract. The baseline design for the ITER electron cyclotron emission (ECE) diagnostic has entered the detailed preliminary design phase. Two plasma views are planned, a radial view and an oblique view that is sensitive to distortions in the electron momentum distribution near the average thermal momentum. Both views provide high spatial resolution electron temperature profiles when the momentum distribution remains Maxwellian. The ECE diagnostic system consists of the front-end optics, including two 1000 K calibration sources, in equatorial port plug EP9, the 70-1000 GHz transmission system from the front-end to the diagnostics hall, and the ECE instrumentation in the diagnostics hall. The baseline ECE instrumentation will include two Michelson interferometers that can simultaneously measure ordinary and extraordinary mode ECE from 70 to 1000 GHz, and two heterodyne radiometer systems, covering 122-230 GHz and 244-355 GHz. Significant design challenges include 1) developing highly-reliable 1000 K calibration sources and the associated shutters/mirrors, 2) providing compliant couplings between the front-end optics and the polarization splitter box that accommodate displacements of the vacuum vessel during plasma operations and bake out, 3) protecting components from damage due to stray ECH radiation and other intense millimeter wave emission and 4) providing the low-loss broadband transmission system.
1 Introduction
The ITER electron cyclotron emission (ECE) diagnostic will provide high spatial and temporal resolution measurements of the electron temperature profile evolution. These measurements are essential for successful completion of the ITER mission. ITER plasmas will be dominated by electron heating, in particular by alpha particle heating of electrons during the important deuterium-tritium phase of the mission. ECE electron temperature data will be important for evaluating the radial deposition profile and time evolution of the alpha particle heating. Furthermore, real-time ECE measurements will be used to identify magneto-hydrodynamic (MHD) modes, such as neoclassical tearing modes that can often be deleterious to plasma performance. The real-time ECE data will provide feedback signals that guide the steering of the electron cyclotron heating (ECH) launchers in order to suppress
these deleterious MHD modes. ECE radiation will play a major role in plasma energy transport in ITER [1]. For ITER plasma scenarios where the central electron temperature, Te(0) ≥ 35 keV [2] power loss due to ECE is expected to exceed the loss due to bremsstrahlung, and electron cyclotron radiation transport will be comparable to, or even exceed, the plasma energy transport. Also, a relatively small population of fast electrons with energies above the bulk of the electron thermal distribution can modify and enhance the ECE power loss [3]. The ITER ECE diagnostic system will be used to detect the presence of non-thermal electrons and to measure the loss of power from the plasma via ECE radiation.
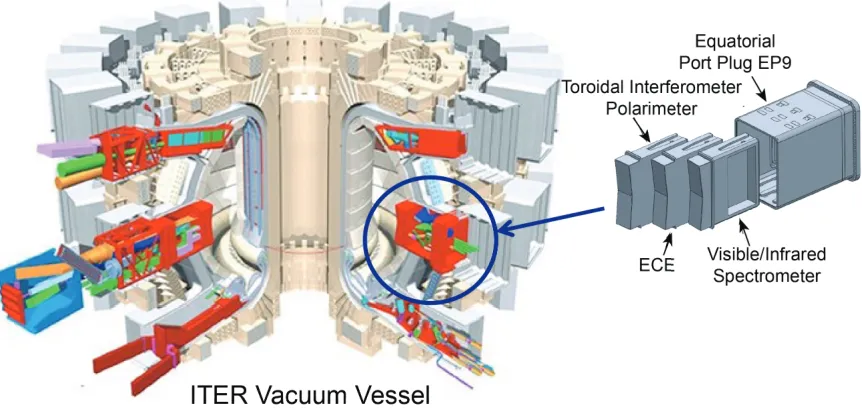
The front-end of the ECE diagnostic will be located in the central diagnostics shield module (DSM) in equatorial port plug 9 (EP9) (Fig. 1). The baseline design of the ITER ECE diagnostic system has entered the detailed preliminary design phase that will continue until a preliminary system design review in 2016.
Two plasma views are currently being planned, a radial and a moderately oblique view that is sensitive to distortions in the electron momentum distribution near the average thermal momentum [4]. There has been growing evidence that in some tokamak plasmas (eg. TFTR and JET) the electron momentum distribution can become non-Maxwellian near the average electron thermal momentum when the electron temperature exceeds 7-10 keV. Both views can provide high spatial resolution temperature profiles if the electron momentum distribution remains Maxwellian. The ECE diagnostic system can be divided into three main parts; 1) the front-end optics, including the two in-situ 1000 K calibration sources, in EP9, 2) the polarization splitter boxes and broadband transmission system that transports the ECE from the front-end and distributes it to the ECE instrumentation room in the diagnostics hall, and 3) the ECE instruments in the diagnostics hall. The baseline ECE instrumentation will include two Michelson interferometer systems that will simultaneously measure ordinary and extraordinary mode polarized ECE over a broad spectral range from 70 GHz to 1 THz, and two heterodyne radiometer systems, covering 122-230 GHz and 244-355 GHz. The US Domestic Agency (US-DA) will provide the front-end components, the 244-355 GHz radiometer system and the instrumentation in the diagnostics hall that controls and monitors the calibration sources and the associated shutters/mirrors in the front-end. The India Domestic Agency (IN-DA) will provide the remaining components of the ECE system. The control, data acquisition and analysis software will be developed jointly by the US-DA and IN-DA. The US-DA is responsible for integrating the front-end of ECE system into EP9 and the ITER organization is responsible for external interfaces, for example with buildings. Review of the final design is expected in August 2016 and will be split into several final design reviews covering
components in EP9, the port cell and galleries, and the diagnostics hall. Significant design challenges include 1) developing reliable 1000 K calibration sources and the associated remotely controlled shutters/mirrors in EP9, 2) providing compliant couplings in the millimeter wave transmission lines between the front-end optics and the polarization splitter box that can accommodate displacements of the vacuum vessel associated with thermal expansion during plasma operations and bake out, and during plasma disruptions, 3) protecting the ECE diagnostic components from stray ECH radiation and other intense millimeter wave emission, and 4) providing a low-loss broadband transmission system between the front-end and the diagnostics hall. This paper reviews the current design of the baseline ECE diagnostic, design challenges that will need to be addressed during the preliminary and final design phases, and possible future upgrades to state-of-the-art ECE instrumentation. Additional information on engineering aspects of the design of the ECE diagnostic and its integration into ITER can be found in the paper by Udintsev et al. [5]. Section 2 covers the design of the optical components in the port plug and the calibration sources, Section 3 covers the design of the double vacuum window, polarization splitter boxes and low-loss, broadband transmission line, and Section 4 discusses the instrumentation in the diagnostics hall, including possible upgrades to state-of-the-art instrumentation.
2 Design of the front-end components
2.1 Front-end optical components
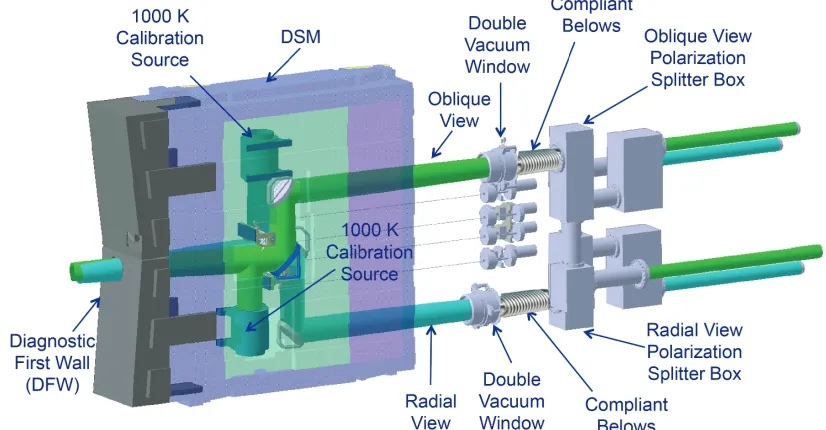
The current design of the ECE diagnostic front-end (Fig. 2) has a “radial” view that views normal to the plasma outer surface and an “oblique” view that views the plasma at 13o from normal. This “oblique” view Figure 1. The ECE diagnostic will be installed in the central diagnostic shield module (DSM) of the ITER EP9 equatorial port
measures ECE from higher energy electrons than the
“radial” view [4]. Each view includes a 1000 K
calibration source inside the port plug. The calibration source will be switched into each view by a remotely-controlled mirror/shutter. The front-end design presented
at the EC-17 workshop in 2012 [6] had the calibration sources positioned behind the port plug to improve access
for maintenance. That design had additional penetrations that increased the neutron streaming rate above the level allowed on ITER.
A redesign of the front-end optics to reduce component overcrowding and improve the neutronics was completed in 2013 [7]. This new design has the calibrations sources located in the port plug close to the first mirror in each view. As a result of this redesign the required diameter of the emissive surface of the calibration sources was reduced from 20 to 15 cm, and the sampling volume in the plasma was not changed.
The central DSM in which the ECE diagnostic front-end is located has until recently been several centimeters wider than the two adjacent DSMs. However even with this additional width the 13o
oblique view components are very close to the outer edge of the DSM (Fig. 3),
allowing insufficient space for shielding. Recently a decision was made to make all the DSMs the same width, as a result the current component design in the DSM will definitely not be compatible with the reduced DSM width. It will be necessary to reduce the angle of the
oblique view by several degrees, possibly to ~ 10o in order to have an oblique view compatible with the width Figure 2. Layout of the ECE diagnostic components in the central DSM of the EP9 port plug and the polarization splitters
mounted behind the port plug.
Figure 3. Top view of the ECE DSM in EP9 showing that for a 13o
oblique view there is little or no shield for the first mirror in the oblique view.
of the DSM and in order to meet the shielding requirements. A 10o
oblique view will be sensitive to electron energies of 5-20 keV, and it will still be most sensitive to electrons with momenta around the average thermal momentum.
The front-end optics design employs quasi-optical, Gaussian beams with no waveguides in the port plug. The design has remotely-actuated shutter/mirrors that will switch the hot calibration sources into the oblique and radial views (Fig. 4). These shutter/mirrors need to be highly reliable and compatible with electromagnetic, thermal and mechanical loads associated with an unmitigated plasma disruption. A 2-wire design connecting two linear actuators to each shutter/mirror is currently being evaluated. While this design mitigates the effect of port plug twisting under high disruption loads concerns have been raised about the designs compatibility with remote handling. A detailed analysis of electromagnetic and thermal loads on the mirror/shutter assembly and associated actuators is currently underway and there is a plan to test a prototype mirror/shutter assembly under ultra high vacuum conditions and during 200 C bake cycles.
2.2 Hot calibration sources
Early prototypes of hot calibration sources that operate in vacuum and use a silicon carbide emissive surface consisting of an array of
small pyramids are being tested on the J-TEXT and EAST plasma devices in China. These early prototypes use filament heaters, and while the filament heaters worked well enough to test the emissive surface and to perform testing of a nested cylinder insulation
approach, the design is probably not sufficiently robust for use on ITER. Some of the free-standing heaters designs showed issues with wire sagging. This was likely due to localized wire overheating. A post-mortem analysis will be conducted on these failed heaters to better characterize the problem. The ITER calibration sources are required at achieve a nominal radiation temperature of 1000 K from the emissive surface with a radiation temperature accuracy of ±10 K and a radiation temperature stability of ±3 K over 24 hours. Most challenging is the requirement that the calibration source should operate reliably in the port plug for up to 100 calibrations, implying an operating lifetime of > 5000 hours. Future prototype development will explore the use of commercial encapsulated heaters that have heating elements coated in either pyrolytic graphite or boron nitride or that are constructed from solid silicon carbide (Fig. 5). As mentioned earlier the diameter of the emissive surface of the calibration source was reduced from 20 to 15 cm through adjustments in the optics in order to be compatible with geometrical constraints in the DSM. The external diameter was reduced from 30 to 25 cm (Fig. 5(a)). The reduced hot source diameter will likely require a major re-design of the heater element, shields, supports, and cooling. Simple scaling of
components from the earlier conceptual design is not likely to be adequate and thermal management will certainly become more challenging.
3 Design of components between
the front-end and the diagnostics
hall
3.1 Vacuum window assembly and compliant coupling
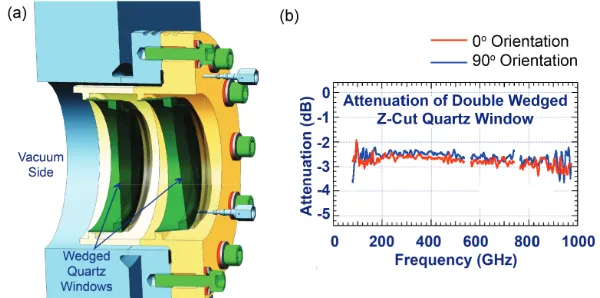
At the back of the port plug there will be a double crystal quartz vacuum window (Fig. 6(a)). Both windows will have a 130 mm diameter clear aperture. The windows will be wedged and angled to avoid interference between surfaces. The window assembles will Figure 5. (a) Hot calibration source dimensions and (b) cross-section view of
a prototype hot calibration source that will use a heating module with elements coated in either pyrolytic graphite or pyrolytic boron nitride.
be provided by ITER but the design will be guided by input from the US-DA and IN-DA. A bolted design is planned for better attachment to the compliant bellows that attaches between the window assemblies and the polarization splitter boxes. As the preliminary design phase moves forward it will be essential to model and mock-up transmission through the whole assembly to evaluate the effect of reflections.
Transmission measurements of a double z-cut crystal quartz window, consisting of two 4o
wedged windows on 15 cm diameter conflate flanges, using a Michelson interferometer at DIII-D, confirmed the expected flat and low transmission loss (< 3 dB) from 80 to 1000 GHz (Fig. 6(b)).
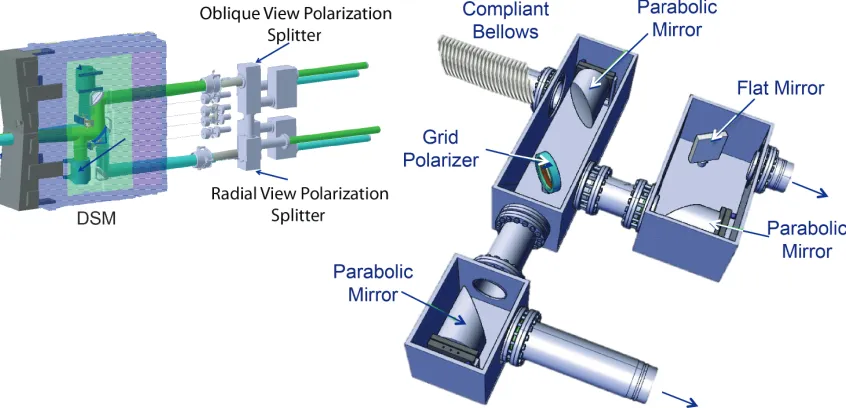
There will be significant radial displacement of the vacuum vessel associated with thermal expansion during plasma operations, consequently it will be necessary to install compliant bellows in the millimeter wave transmission lines between the vacuum window assemblies (Fig. 2) and the polarization splitter boxes (Fig. 7) to accommodate this displacement. Alignment of the optics will be performed with the front-end heated to the temperature expected during normal plasma operations in order to compensate for the displacement during plasma operations. The bellows will also serve to decouple displacements during bake out and, to some extent, during plasma disruptions, although they will not effectively decouple lateral displacements associated with disruptions.
3.2 Polarization splitters
Each polarization splitter box consists of two Gaussian beam telescopes constructed from three parabolic mirrors and one flat mirror (Fig. 7). A wire grid separates the O
and X mode polarized emission. This Gaussian telescope design allows a fixed aperture waveguide to be mapped to a variable aperture at the interface between the internal and external optics. This was key to reducing
beam diameter in the front-end and increasing neutron shielding to an acceptable level. An axial tilt of 0.1o increases the power lost to conversion by ≤ 1%. The calculated transmission efficiency of the splitter box is > 93% from 100 to 1000 GHz. The insider surfaces of the beam splitter will be coated with absorber to minimize scattering of radiation.
3.3 Transmission line
Performance requirements for the broadband transmission system present a significant design challenge, the required transmission loss ~ 15 dB from 70 to 400 GHz and 22 dB from 400 to 1000 GHz. There will be four 45-meter long transmission lines, with an internal diameter of 72 mm, between the EP9 port plug and the diagnostics hall, carrying X-mode and O-mode polarized ECE from the radial and oblique plasma views. The current design has 42 meters of straight waveguide in each transmission line, 10 miter bends in each of the radial view transmission lines and 11 miter bends in each of the oblique view transmission lines. A waveguide connection unit with power splitters will be installed in the ECE instrumentation area to guide ECE to the Michelson interferometers and radiometer systems.
4 Instrumentation in the diagnostics hall
4.1 Baseline instrumentation
The baseline instrumentation will include two, high throughput, reciprocating Martin-Puplett Fourier Transform Spectrometers with a spectral range of
70 – 1000 GHz, a frequency resolution ≤ 3.75 GHz and a scanning repetition rate ≤ 20 ms. The ECE community has a lot of experience with these instruments, however they have a significant dead time between scans. Above Figure 7. Polarization splitter box design is shown on the right. The location of the splitter boxes for the radial and oblique views
500 GHz water vapour absorption will be significant and simply flushing with dry nitrogen will not entirely mitigate the absorption, so the broadband instruments will need to operate in vacuum. An ECE Michelson interferometer on C-Mod at MIT [8] has operated reliably in vacuum in the 100-1000 GHz range, with a stable calibration, for many years. One possible option for the broadband instruments might be a large-throughput rotating Michelson, these have much less dead time between scans, but current versions have relatively low throughput. Another option could be a Mach-Zehnder interferometer, these are currently used widely by the sub-millimeter wave astronomy community. Finally measurements based on a Hilbert-transform spectral analysis of output from a high-Tc Josephson junction detector offer the possibility of much reduced calibration time below 350 GHz, a video bandwidth of 100 kHz and acquisition of a full spectrum in 10 ms [9].
The baseline instrumentation includes a set of heterodyne radiometers covering 122 – 355 GHz ECE spectra and that have a video bandwidth of 500 kHz. The
IN-DA will provide a 122 – 230 GHz radiometer system. That system is currently planned to include the following receivers: a 122 – 138 GHz receiver with sixteen 1 GHz bandwidth channels, a 138 – 168 GHz receiver with sixteen 2 GHz bandwidth channels, a 172 – 218 GHz receiver with sixteen 3 GHz bandwidth channels, and a 220 – 230 GHz receiver with three 4 GHz bandwidth channels.
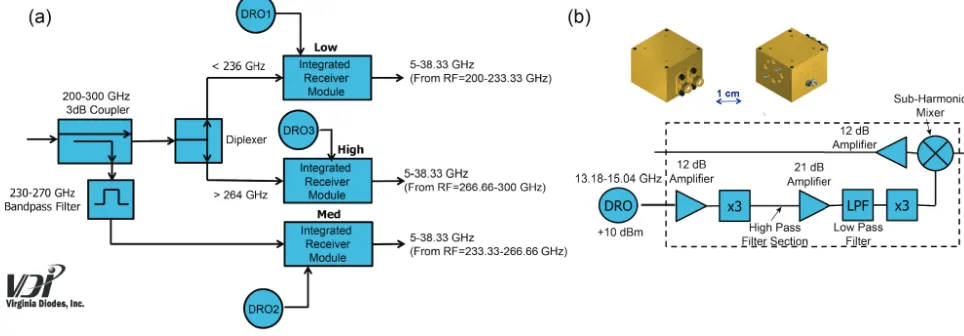
The US-DA will provide a 244 – 355 GHz radiometer system. The current plan is to provide forty-eight 2 GHz bandwidth channels and sixteen high-resolution channels with a bandwidth of 250 MHz. The US-DA is considering using a highly integrated front-end design for the 244 – 355 GHz radiometer based on a 200 – 300 GHz prototype receiver currently being developed by Virginia Diodes in the US (Fig. 8(a)).This receiver uses three identical integrated receiver modules (Fig. 8(b)).
4.2 Possible upgrades to “State-of-the-Art” instrumentation
Upgrades to the baseline instrumentation that allow increased capability and flexibility of the ECE diagnostic system need to be considered. Recent rapid advances in the speed of digital circuitry have allowed direct digitization of intermediate frequency (IF) signals in the GHz frequency regime and even microwave signals up to 30 GHz and beyond. Development of software-defined radios has been progressing well into the GHz frequency regime. We can expect these advances to continue throughout the 20-30 year lifespan of ITER.
Microwave emission measurements on TEXTOR used Fast Fourier Transform processing of IF signals to acquire 4 GHz wide spectra in the range 136-140 GHz [10]. Post-processing of the digitized data allowed the number of spectra per second, and corresponding frequency resolution (Δf), to be varied from 120 spectra/sec (Δf = 25 kHz) to 200,000 spectra/s (Δf = 100 MHz). Near-real time processing of data and flexible reconfiguration of the data acquisition system is
made possible by using Field Programmable Gate Array and Graphics Processing Unit architectures in these IF data acquisition systems.
Analog to digital convertors (ADCs) constructed from Josephson junction comparators have been used to sample frequencies up to 30 GHz in superconducting integrated circuits (ICs) operating at a temperature of 4 K. These ADCs are connected to rapid single flux quantum digital “channelizer” circuits located on the same IC to form a digital microwave receiver [11]. It may be possible to extend this technology to higher microwave frequencies in the near future.
Summary
ECE measurements will be essential for the successful completion of the ITER mission. Detailed design of the Figure 8. (a) Schematic of the prototype 200-300 GHz receiver front-end being developed by Virgina Diodes Inc. (b) Schematic of
ITER ECE diagnostic system is now underway in a collaborative effort between India and the US. The design retains a radial and oblique plasma view and in-situ calibration sources in the front-end. Several design challenges remain to be addressed during the preliminary design phase. Advances in digital and microwave technology promise to provide an opportunity to make significant upgrades to the baseline ECE instruments during the lifetime of ITER.
The views and opinions expressed herein do not necessarily reflect those of the ITER Organization.
References
1. F. Albajar, et al., Nucl. Fusion, 45, 642 (2005) 2. V. Parail, et al., Nucl. Fusion 53, 113002 (2013)
3. K. V. Cherepanov and A. B. Kukushkin, Proc. 20th Int. Conf. Fusion Energy, Vilamoura,Portugal, November 1–6, 2004, paper TH0P6-56, IAEA (2004)
4. G. Taylor and R. W. Harvey, Fus. Sci, Tech. 55, 64 (2009)
5. V. S. Udinstev, et al, “Engineering aspects of design and integration of ECE diagnostic in ITER”, Proc. 18thJointWorkshop on Electron Cyclotron Emission and Electron Cyclotron Heating, Nara, Japan (2014)
6. M. E. Austin, et al., Proc. 17thJointWorkshop on Electron Cyclotron Emission and Electron Cyclotron Heating, Deurne, The Netherlands, EPJ Web of Conferences 32, 03003 (2012)
7. W. L. Rowan, et. al. “ITER ECE Front End Optical Design Modifications”, Final Report PPPL S012583-F
8. A. E. Hubbard, T. C. Hsu, and P. J. O’Shea, Proc. 9th JointWorkshop on Electron Cyclotron Emission and Electron Cyclotron Heating, Borrego Springs, California, p. 387, World Scientific (1995)
9. H. K. B. Pandya and Y. Divin, “New approach to ECE measurements based on Hilbert-transform spectral analysis”, Proc. 18thJointWorkshop on Electron Cyclotron Emission and Electron Cyclotron Heating, Nara, Japan (2014)
10. D. J. Thoen, et al. Rev. Sci. Instrum. 80, 103504 (2009)