PSFC (Preprocessing, Segmentation, Feature Extraction
and Classification) of Lung Ct Images: A Survey
SUKRUTH GOWDA M A Research Scholar, Department of CS&E
S.J.B Institute of Technology Kengeri, Karnataka, India
Dr. A. N. KRISHNA
Professor & Head, Department of CS&E S.J.B Institute of Technology
Kengeri, Karnataka, India
ABSTRACT
The major cause of death in both men and women around the world is lung cancer. Many CAD(Computer Aided Detection/Diagnosis) systems have been developed for detection of lung tumors. General CAD system consists of preprocessing, segmentation, feature extraction and classification stages. Various screening techniques are available for identification of masses in lungs like X-Ray, MRI, CT, PET, LDCT. The major research focus is on improving the accuracy, speed and also dynamicity of the CAD system. This paper presents the survey on methodologies used for detection and diagnosis of tumors using lung CT images.
Keywords: CAD system Preprocessing, segmentation, feature extraction, classification.
I.INTRODUCTION
Lung cancer is another main cause of deaths in developing countries ther are more than 1.2 million deaths due to the lung cancer. The primary lung cancer is termed as bronchogenic carcinoma is the most common accounting of 95% of primary lung cancer. Bronchiogenic carcinoma can occur anywhere in lungs but the most common location is hilar follwed in descending frequency by pheriferal type. There are two variations, hilar type and peripheral type. In the hilar type the lung cancer arises from the main bronchus or one of its segmental branches in the hilar parts of the lung, more often on the right side. The tumor begins as a small roughened area on the bronchial mosa at bifurcation. In the peripheral type a small proposition of lung cancers, adenocarcinomas including bronchioloveolar carcinomas, originate from a peripheral bronchiole. The tumor may be a single nodule or multiple nodules in the periphery.
Image segmentation is the process of dividing the given image in the way useful for the analysis. It can be used in many area like forensic department, medical field, finger prints identification etc . For almost implemented in the applications it will be used to access the objects in the given image. The process of image segmentation mainly deals with two different regions of the image namely the object and the background of the particular image.
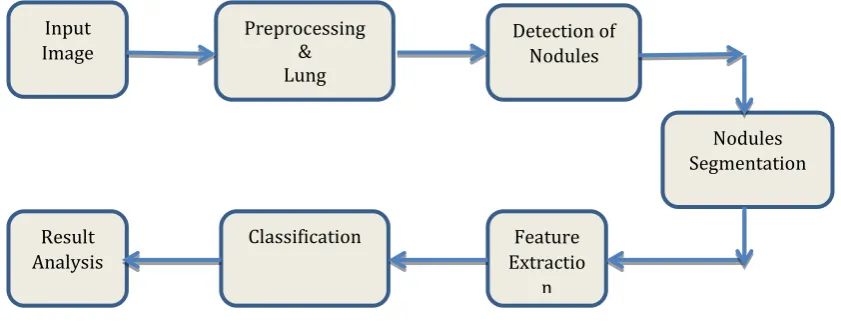
[image:1.595.85.506.513.675.2]
Figure 1: A Typical CAD System
Image segmentation can be identified through our eyes only, we can identify the image clearly and can distinguish its characteristics. During the same time we have to think about the huge amount of data that can be obtained by developing and ongoing technologies, which makes it quite difficult. And it will be more difficult to analyze the image data manually which is time consuming and may not provide accurate results. So many algorithms have been developed in this issue for performing segmentation and still the research is going on to make the algorithm to provide more accurate results and work efficiently. When we make use of segmentation
Input Image
Preprocessing & Lung Segmentation
Detection of Nodules
Nodules Segmentation
Feature Extractio
n Classification
algorithms or while developing the algorithm we should concentrate on many factors like whether we have to consider edges, interior region, background of the image etc.
The general CAD system consists the phases as shown in Figure 1.1.The input to the system is the image in particular format. Initially there will be preprocessing stage where in which the enhancements to the image are done. Along with that there may be removal of noises in the image. Then the CT image will undergo with segmentation process to identify the lung fields. Then the nodules inside the lung are segmented. After segmentation, feature extraction is done with respect to the nodules identified. Finally classify the nodules as benign or malignant.
II.PREPROCESSING AND SEGMENTATION
Preprocessing is generally the initial stage in image processing system. The main application is to enhance image features in the given image by eliminating noise and other unwanted information in the image. Many techniques are involved in the preprocessing stage like the change in the contrast of the input image, filters for noise removal like gabor filter, auto enhancement, fast fourier transform. This is the basic abstraction level. Even sometimes the initial segmentation may also be involved in the preprocessing itself. Generally the CT image is converted into gray scale image[16] making use of some available digital image processing technique and also involves resizing and normalizing.
Filtering is an approach for removal of noise in the image, many filters are available like low pass filter, high pass filter etc. Anisotropic non-linear diffusion filter [7] is one such filter which removes the noise in the CT image considering the edges of the image. Median filter[8][13] and High boost filter[8] which eliminates the noise without blurring the image and also enhances the given input image for easy identification of the features. Wiener filter[10] focus on individual pixel of the image, which calculates the local mean and variance with respect to neighboring pixel and creates pixel wise linear filtering. Contrast stretching [12] enhances the intensity of the image slices by identifying lower and upper intensity limits and then the value of resulting image is normalized. Adaptive Histogram Equalization [13] improves the image quality which helps in intelligible and clarity image.
The challenging problem in the detection of lung nodules is the lung segmentation due to the different tissue types in the region of CT image taken. Many techniques for segmentation are proposed like edge detection, thresholding, region growing, bounding boxes, hopfiled neural network, seeded region growing which can be mainly categorized into thresholding, models based on shape and edges, deformable boundaries.
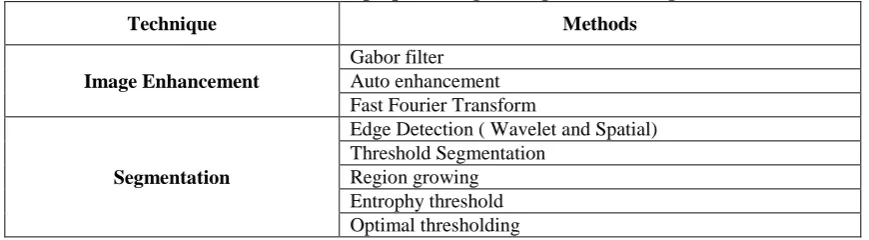
[image:2.595.81.516.645.765.2]Morphological operations [1][6][10] like connectivity, dilation, erosion, opening and closing, is used for segmenting the left and right lung from the CT image. It also helps in airways removal of lungs and also eliminates the small connected region with logical 1 and 0 in 3D segmented image of lung. Along with morphological operations border construction[6] is additionally used to for detecting the juxta-pleural nodules. Watershed transformation [3-4][8] is a technique which mainly segments the image data depending on foreground and background details of the image. BAT algorithm [4] is used for segmentation which has the rules of echo location and random velocity. Region growing approach[5][12] is another technique where in which seeds(a center pixel of region of interest or with high intensity) are identified and a region is constructed by connecting the neighboring pixels. Random walker will achieve high results with respect to segmentation if the image foreground and background is easily separable. In this technique, the user has to specify the label for both background and foreground. An improved random walker[7] makes use of additionally an automatic seed acquisition method. Hounsfiled unit [9][11] is the most used method for specifying the threshold value for segmentation. Generally -400 is selected as the safe threshold value. The below Table 1.1 shows the technique and methods used during the preprocessing and segmentation stage.
Table 1.1: Methods in preprocessing and segmentation stages
Technique Methods
Image Enhancement
Gabor filter Auto enhancement Fast Fourier Transform
Segmentation
Edge Detection ( Wavelet and Spatial) Threshold Segmentation
Bounding Box+ Threshold segmentation Standard Uptake Values
Optimal gray level threshold Hopfield neural network Seeded region growing
III.FEATURE EXTRACTION
Feature extraction mainly can be classified as shape features, texture features and intensity features along with that geometric features can also be considered. GLCM(Gray Level Co-occurrence Matrix)[3-5][7][11][13][16][18] is the most commonly used feature extraction technique which mainly contains the feature as contrast, correlation, clustering, energy, entropy ratio, homogeneity, maximum correlation coefficient. Intensity features [7][11] may be maximum and minimum intensity, skewness, kurtosis factor, standard variance and difference of variance. Texture features may be, auto correlation, fractional dimension, maximum probability, sum of squares, sum variance, sum entropy, difference entropy, information measure of correlation, inverse difference normalized. Geometric and shape based features [6-7] may be eccentricity, major axis, minor axis, area, curvature descriptor, diameter, area, aspect ratio, perimeter, circularity, margin, volume, rectangularity, roundness, surface center distance standard deviation, elongation etc.
[image:3.595.81.517.427.612.2]Amplitude Modulation and Frequency Modulation[10] is another type of feature extraction method which access the pixel based image information like instantaneous amplitude, frequency, and phase which can identify the features efficiently even with lack of resolution also. K-Means[1][19] clustering performs the segments given the number of classes or clusters to be formed in the image. The major problem is it never considers the edges and forms only the spherical shaped clusters. Other characteristics like subtelity, solidity, internal structure speculation and spherical shape are also used as feature sets[17]. Table 1.2 shows the various feature extraction and feature selection techniques.
Table 1.2: Feature Extraction and Selection methods.
Technique Methods
Feature Extraction
Absolute Grey Level Differences Histograms Grey Level Co-occurrence Matrices
Signed Grey Level Differences Histograms Grey Level Gap Length Matrix
Grey Level Histogram
Grey Level Run Length Matrix
Surrounding Region Dependence Method
Feature Selection
Sequential forward selection sequential backward selection metaheuristic strategies Genetic Algorithm
Normalized Mutual information Correlation
GA with Fuzzy
IV.CLASSIFICATION
Classification is a process of assigning the given pixel into particular category, for humans it may be easy to classify but for the machine a proper training should be carried out for the classification of the nodules in the image. Two important concepts in classification is the learning process and the feature sets. There are mainly two broad categories of learning process, supervised and unsupervised. As per CT images is concerned many techniques have been adopted by the researchers to increase the accuracy and decrease the false positive rate. Support Vector Machine [3][6][8][10-11][16] which is a supervised learning model which has the separating hyper plane. The data is plotted in dimensional space considering the number of feature set selected and then classification is done by identifying the hyperplane.
[image:4.595.82.514.252.366.2]
probablility. The conditional probability of an event is calculated from the conditional probability of event in each class and unconditional probability of event in each class. Convolution Neural Network[11-12][14][17] is unsupervised learning classifier, where depending on the winner neuron and loser neuron of each cluster the classification is done. Each time the update can also be done if any changes occurs in the cluster formation. There can be layers defined for convolutions, max pooling and full connections. k-Nearest Neighbor [10] is a lazy classification technique where a set of objects are defined in the class and the neighbors are selected within that class. But k value should be user defined. Many other techniques like Artificial Neural Networks with Backpropogation[4][13], rule based classifier[12], linear classifier [10] are also used for the classification. The table 1.3 summarizes the techniques used for classification
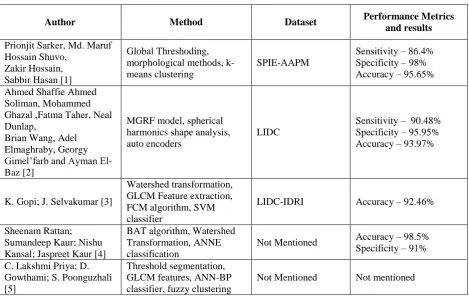
Table 1.3: classification techniques
Technique Methods
Classification
Diagnostic indicators Neuro-Fuzzy
FIS Artificial Neural Network SVM
k-NN, SVM Bayesian Random Forest
Fuzzy C-Mean Clustering
[image:4.595.64.534.451.748.2]The classification is done depending on the stages, depending on the TNM classification of Lung tumor or may be with respect to benign or malignant. The problem is to decrease the false positive rate of classification. Hybrid algorithms is the latest research for classification. The various techniques, performance metrics and results are tabulated below in Table 1.4
Table 1.4 Summary of methods, datasets and results
Author Method Dataset Performance Metrics and results
Prionjit Sarker, Md. Maruf Hossain Shuvo,
Zakir Hossain, Sabbir Hasan [1]
Global Threshoding, morphological methods, k-means clustering
SPIE-AAPM
Sensitivity – 86.4% Specificity – 98% Accuracy – 95.65%
Ahmed Shaffie Ahmed Soliman, Mohammed Ghazal ,Fatma Taher, Neal Dunlap,
Brian Wang, Adel Elmaghraby, Georgy Gimel’farb and Ayman El-Baz [2]
MGRF model, spherical harmonics shape analysis, auto encoders
LIDC
Sensitivity – 90.48% Specificity – 95.95% Accuracy – 93.97%
K. Gopi; J. Selvakumar [3]
Watershed transformation, GLCM Feature extraction, FCM algorithm, SVM classifier
LIDC-IDRI Accuracy – 92.46%
Sheenam Rattan; Sumandeep Kaur; Nishu Kansal; Jaspreet Kaur [4]
BAT algorithm, Watershed Transformation, ANNE classification
Not Mentioned Accuracy – 98.5% Specificity – 91%
C. Lakshmi Priya; D. Gowthami; S. Poonguzhali [5]
Threshold segmentation, GLCM features, ANN-BP classifier, fuzzy clustering
May Phu Paing; Somsak Choomchuay [6]
Hounsfeild unit, SVM classifier, margin and shape features
TCIA Accuracy – 90.9%
Xiang-Xia Li; Bin Li; Lian-Fang Tian; Li Zhang [7]
Anisotropic non linear diffusion filter, improved random walker, intensity, texture and geometrical feature, RF classifier
LIDC-GHGMC
Sensitivity – 92% Specificity – 83% Accuracy – 90%
Pooja R. Katre; Anuradha Thakare [8]
Median filter, high boost filter, watershed
transformation, SVM classifier.
Not mentioned Not mentioned
Taolin Jin; Hui Cui; Shan Zeng; Xiuying Wang [9]
Hounsfield threshold unit, CNN classifier
Kaggle Datascience Bowl 2017 dataset, US national Cancer
Accuracy – 87.5%
Eman Magdy, Nourhan Zayed, and Mahmoud Fakhr [10]
Wiener filtering, thresholding and morphological
operations, AM-FM feature extraction, kNN, SVM, Naïve Bayes, Linear classification
TCIA
Accuracy kNN- 64% SVM- 90% Naïve Bayes- 82% Linear- 95%
Bassma El-Sherbiny; Nardeen Nabil; Seif Hassab El-Naby; Youssef Emad; Nada Ayman; Taraggy Mohiy; Ashraf AbdelRaouf [11]
Hounsfield unit, GLCM features, border filter, Label filter, SVM, CNN, UNet
LUNA Results- 50%
Salsabil Amin El-Regaily; Mohammed Abdel Megeed Salem; Mohamed Hassan Abdel Aziz; Mohamed Ismail Roushdy [12]
Contrast stretching,
thresholding, region growing, 3D hole filling algorithm, rule based classifier and CNN
LIDC
Sensitivity – 77.77% specificity – 69.5% Accuracy – 70.53%
Lilik Anifah; Haryanto; Rina Harimurti; Zaimah Permatasari; Puput Wanarti Rusimamto; Adam
Ridiantho Muhamad [13]
Median filter, adaptive histogram equalization, GLCM features, ANN Backpropogation
Cancer Imaging
Archieve Datatbase Accuracy – 80%
QingZeng Song, Lei Zhao, XingKe Luo, and XueChen Dou [14]
CNN, Deep Neural Network,
Stacked auto encoder LIDC-IDRI
Accuracy CNN - 84.15%
Deep Neural Network – 82.37%
Stacked Auto Encoder – 82.59%
Botong Wu; Zhen Zhou; Jianwei Wang; Yizhou Wang[15]
Multitask learning CNN LIDC-IDRI
Nodule Malignancy Prediction – 97.58% Attribute prediction – 89.33%
Nodule segmentation – 73.89%
Deep Prakash Kaucha; P. W. C. Prasad; Abeer Alsadoon; A. Elchouemi; Sasikumaran Sreedharan [16]
Discrete waveform
trasnsform, GLCM features, SVM classifier
LIDC
Qi Dou; Hao Chen; Lequan Yu; Jing Qin; Pheng-Ann Heng [17]
3D CNNs LIDC Sensitivity – 67.7%
Edson Cavalcanti Neto; Paulo Cesar Cortez; Tarique Silveira
Cavalcante; Valberto Enoc Rodrigues; Pedro Pedrosa Reboucas Filho; Marcelo Alcantara Holanda[18]
Gaussian filter, post processing, features like homogeneity, energy, entropy, maximum probability
LOLA II
Coefficient similarity – 95.6%
Sensitivity – 95.6% Specificity – 71.1%
Ehsan Hosseini-Asl; Jacek M. Zurada; Georgy Gimel’farb; Ayman El-Baz[19]
Incremental Constrained Nonnegative Matrix Factorization, K-Means clustering
LOLA II Accuracy – 98.6%
Arnaud Arindra Adiyoso Setio; Francesco Ciompi; Geert Litjens; Paul Gerke; Colin Jacobs; Sarah J. van Riel; Mathilde Marie Winkler Wille; Matiullah Naqibullah; Clara I. Sánchez; Bram van Ginneken[20]
kNN, Rolling ball algorithm,
2D convnets configuration LIDC
Sensitivity – 93.3% CPM score – 0.632
Inference withdrawn: During the CAD system process, the segmentation at the top level, meaning extracting the lung region that is left lung and right lung from the airways should be done effectively. Identifying the edge region or boundary of the lung is of main focus. The existing system fails in detection of microcalcification, that is detection of nodules less than 3mm and also reducing the search space for improving time efficiency . As the shape of the tumor may be changed as per the stage no methodology has focused on the different shapes of the nodule. Classification based on the stage can further be improved as few methods focus only on T/N classification, along with benign of malignant. Challenge in improving the accuracy of the system along with sensitivity and specificity and also decreasing the false positive rate should be given. The robustness of the CAD system along with the volumetric approach and the automation level can be the research area.
V.CONCLUSION
Early detection of lung tumor may help in proper treatment of the patient and survival rates can be improved. Efficient CAD system has to be developed for detection of the tumors of different size and shape. In this paper we have discussed various methods the researchers have implemented for identification of the tumor. Even then focus has to be done in having a preprocessing technique which retains the clarity of the image along with the details of edges, such that juxta-pleural regions can also be covered. Efficient segmentation technique to be developed so as to detect the nodule of size less than 3mm also along with the tumor which can be present at the edges. Shape features can also be included and it would be better to identify dominant features of the CT image which helps in classification of CT image with respect to stage or TNM classification or benign or malignant.
REFERENCES
[1] Prionjit Sarker, Md. Maruf Hossain Shuvo, Zakir Hossain, Sabbir Hasan, “Segmentation and classification of lung tumor from 3D CT image using K-means clustering algorithm”, IEEE 4th International Conference on Advances in Electrical Engineering (ICAEE), pp 731-736, 28-30 Sept. 2017, Dhaka, Bangladesh.
[3] K. Gopi; J. Selvakumar, “Lung tumor area recognition and classification using EK-mean clustering and SVM”, IEEE International Conference on Nextgen Electronic Technologies: Silicon to Software (ICNETS2), pp 97-100, ISBN: 978-1-5090-5912-6,March 2017 VIT University, India.
[4] Sheenam Rattan; Sumandeep Kaur; Nishu Kansal; Jaspreet Kaur, “An optimized lung cancer classification system for computed tomography images”, IEEE Fourth International Conference on Image Information Processing (ICIIP), pp 1-6, ISBN: 978-1-5090-6733-6, December 2017, Jaipur, India.
[5] C. Lakshmi Priya; D. Gowthami; S. Poonguzhali, “ Lung pattern classification for interstitial lung diseases using an ANN-back propagation network”, IEEE International Conference on Communication and Signal Processing, pp 1917-1922 , ISBN: 978-1-5090-3799-5, April 2017, Tamilnadu, India. [6] May Phu Paing; Somsak Choomchuay, “Classification of margin characteristics from 3D pulmonary
nodules”, 10th Biomedical Engineering International Conference , BMEiCON – 2017, pp 1-5, ISBN: 978-1-5386-0882-1, Aug-Sep 2017, Japan.
[7] Xiang-Xia Li; Bin Li; Lian-Fang Tian; Li Zhang, “ Automatic benign and malignant classification of pulmonary nodules in thoracic computed tomography based on RF algorithm”, IET Image processing Journal , volume 12, issue 7, pp 1253-1264, 2018, Print ISSN: 1751-9659
[8] Pooja R. Katre; Anuradha Thakare, “ Detection of lung cancer stages using image processing and data classification techniques”, IEEE 2nd International Conference for Convergence in Technology (I2CT), pp 402-404, ISBN: 978-1-5090-4307-1, April 2017
[9] Taolin Jin; Hui Cui; Shan Zeng; Xiuying Wang, “Learning Deep Spatial Lung Features by 3D Convolutional Neural Network for Early Cancer Detection”, IEEE International Conference on Digital Image Computing: Techniques and Applications (DICTA), pp 1-6, ISBN: 978-1-5386-2839-3, 2017 [10]Eman Magdy, Nourhan Zayed, and Mahmoud Fakhr, “Automatic Classification of Normal and Cancer
Lung CT Images Using Multiscale AM-FM Features”, International Journal of Biomedical Imaging, Volume 2015, September 2015.
[11]Bassma El-Sherbiny; Nardeen Nabil; Seif Hassab El-Naby; Youssef Emad; Nada Ayman; Taraggy Mohiy; Ashraf AbdelRaouf, “BLB (Brain/Lung cancer detection and segmentation and Breast Dense calculation)”, IEEE First International Workshop on Deep and Representation Learning (IWDRL), pp 41 - 47 , ISBN: 978-1-5386-5083-7, March 2018, Egypt.
[12]Salsabil Amin El-Regaily; Mohammed Abdel Megeed Salem; Mohamed Hassan Abdel Aziz; Mohamed Ismail Roushdy, “ Lung nodule segmentation and detection in computed tomography”, IEEE Eighth International Conference on Intelligent Computing and Information Systems (ICICIS), pp 72-78, ISBN 977-237-172-3,December 2017, Egypt
[13]Lilik Anifah; Haryanto; Rina Harimurti; Zaimah Permatasari; Puput Wanarti Rusimamto; Adam Ridiantho Muhamad, “Cancer lungs detection on CT scan image using artificial neural network backpropagation based gray level coocurrence matrices feature”, IEEE International Conference on Advanced Computer Science and Information Systems (ICACSIS), pp 327-332, ISBN: 978-1- 5386 - 3172 – 0, October 2017, Jakarta, Indonesia.
[14]QingZeng Song, Lei Zhao, XingKe Luo, and XueChen Dou, “Using Deep Learning for Classification of Lung Nodules on Computed Tomography Images”, Journal of Healthcare Engineering, Volume 2017, August 2017
[15]Botong Wu; Zhen Zhou; Jianwei Wang; Yizhou Wang, “Joint learning for pulmonary nodule segmentation, attributes and malignancy prediction”, IEEE 15th International Symposium on Biomedical Imaging (ISBI 2018) , pp 1109 – 1113, ISBN: 978-1-5386-3635-0, April 2018, USA [16]Deep Prakash Kaucha; P. W. C. Prasad; Abeer Alsadoon; A. Elchouemi; Sasikumaran Sreedharan,
“Early detection of lung cancer using SVM classifier in biomedical image processing”, IEEE International Conference on Power, Control, Signals and Instrumentation Engineering (ICPCSI), pp 3143 – 3148, ISBN 978-1-5386-0813-5, September 2017, Tamilnadu, India.
[17]Qi Dou; Hao Chen; Lequan Yu; Jing Qin; Pheng-Ann Heng, “Multilevel Contextual 3-D CNNs for False Positive Reduction in Pulmonary Nodule Detection”, IEEE Transactions on Biomedical Engineering, Volume: 64, Issue: 7, pp 1558 – 1567, 2016
[19]Ehsan Hosseini-Asl; Jacek M. Zurada; Georgy Gimel’farb; Ayman El-Baz, “3-D Lung Segmentation by Incremental Constrained Nonnegative Matrix Factorization”, IEEE Transactions on Biomedical Engineering, Volume: 63, Issue: 5, pp: 952 – 963, 2016