Detection of Breast Cancer Using Texture
Method in Mammogram Image
A.Stephen Sagayaraj(1), G.Mohanapriya(2), R.Nivetha(3), C.Subhashini(4), V.Suganya(5)
Assistant Professor, Department of Electronics and Communication Engineering, Jay Shriram Group of Institutions,
Tirupur, Tamilnadu, India1
UG Scholar, Department of Electronics and Communication Engineering, Jay Shriram Group of Institutions, Tirupur,
Tamilnadu, India2,3,4,5
ABSTRACT: A Mammogram is an X-ray image of the breast. It is used to check for breast cancer in women who have no signs or symptoms of the diseases. It can also be used if you have a lump or other sign of breast cancer. A mammography exam, called a mammogram, aids in early detection and diagnosis of breast diseases in women. Mammogram doesn’t prevent breast cancer, but they can save lives by finding breast cancer. As per the survey of World Health Organization (WHO), American Society identified that by the end of 2012, about 2,26,000 cases were diagnosed and 40,000 resulted in death. This proposed system is used to detect and segment the cancer part from the breast. Preprocessing is used to conduct steps that will reduce the complexity and increase the accuracy of applied algorithm by using Median filter, Laplacian filter and Gaussian filter is implemented to reduce noise to reconstruct the image by removing unwanted distortion. Segmentation is done by texture method using texture filter. Feature extraction is performed by using the GLCM technique to extract the features from the segmented image. Classification is performed by using the ANFIS algorithm to improve the accuracy of the cancer detection.
KEYWORDS: Breastcancer ,WHO, Mammogram images, GLCM, ANFISalgorithm
I. INTRODUCTION
II. METHODOLOGY
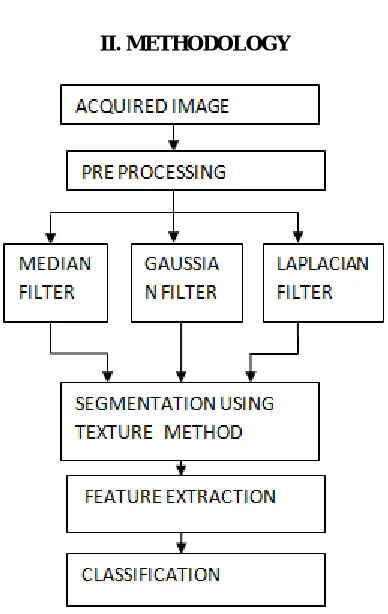
Fig 1: OUTLINE OF THE TEXTURE METHOD
In mammography image, bright region that described as cancer part. Malignant tumors can invade and destroy nearby tissue and spread to other parts of the body. Avoiding benign biopsies would spare women anxiety, discomfort, and expense [6] .Low opposition and noisy in the mammogram image. Normal tissues and malignant tissues are present in some mammogram images. The benign are non-cancerous abnormalities whereas the malignant abnormalities are reported as cancers by the radiologist[7]. Image enhancement approaches can be classified as spatial domain method and frequency domain method. Some example of image pre processing process are contrast pre processing, edge enhancement noise filtering, sharpening, magnifying. Remove the noise with the help of median filter, laplacian filter and Gaussian filter and find PSNR and MSE value for each filter for comparing the performance of filters. Texture segmentation using texture filter for segment the cancer region. Depending on the features like mean, variance and homogeneity, etc.The process and methodology for segmentation and classification for breast cancer is shown in above flow graph which shows that five process of detection and classifications of breast cancer such as collecting acquired image, preprocessing i.e. remove the noise from mammogram image, segment the affected tumor from the normal cells, feature extraction and classification of breast cancer.
III. PRE PROCESSING
3.1 MEDIAN FILTER
The median filter is a nonlinear filtering technique, often used to remove the noise. The median is defined as the percentile of a ranked set of number median filter prescription has revealed below
G (x,y)=median{f(x-a,y-b),(a,b)€W} Where W is a selected window
a,b are the constant.
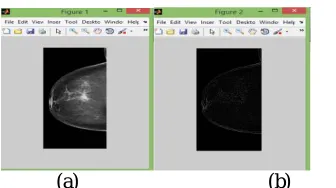
(a) (b)
Fig :2 (a) ORIGINAL IMAGE (b) OUTPUT OF MEDIAN FILTER
we have calculated PSNR and MSE values for individual image for several filter that has shown below
TABLE 1: PSNR AND MSE VALUES FOR MEDIAN FILTER
Image MSE PSNR
Img1 0.0392 62.2325 Img2 0.0364 62.5538 Img3 0.1254 57.1802 Img4 0.2496 54.1916 Img5 0.2132 54.8774
3.2 LAPLACIAN FILTER:
The Laplacian of an image highlights regions of rapid intensity change and is therefore often used for edge detection. The Laplacian L(x, y) of an image with pixels intensity values I(x, y) is given by
L(X,Y)=∂2F(X,Y)=∂2F(X,Y)/∂X2+∂2F(X,Y)/∂Y2
Where,X and Y are axis of the standard deviation Log(X,Y)=1/ᴨσ2[1-X2+Y2/2σ2]
σ= standard deviation .The laplacian filter diagram that has shown below
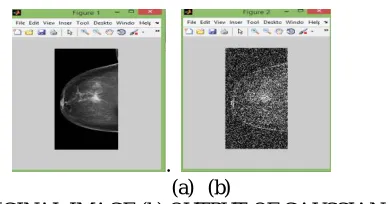
(a) (b)
Fig: 3 (a) ORIGINAL IMAGE (b) OUTPUT OF LAPLACIAN FILTER
TABLE 2: PSNR AND MSE VALUES FOR LAPLACIAN FILTER .
Image MSE PSNR
Img1 159.4659 26.1381
Img2 194.4890 25.2758
Img3 211.6170 24.9093
Img4 214.8652 24.8431
Img5 253.6208 24.1230
3.3 GAUSSIAN FILTER
Gaussian filter is a filter whose impulse response is a Gaussian function. It have the properties of having no overshoot to a step function input while minimizing the rise and fall time, Gaussian blur is also called as Gaussian smoothing is the result of blurring an image by the Gaussian function. It is a widely used effects in graphics software,typically to reduce image noise and reduce detail, equation of Gaussian filter is
F(x)=ae^-(x-b) ²/2c ²
Where a, b, c are arbitrary real constants x is the distance from the origin in the horizontal axis, y is the distance from the origin in the vertical axis and is the standard deviation of the Gaussian distribution.
. (a) (b)
Fig: 4 (a) ORIGINAL IMAGE (b) OUTPUT OF GAUSSIAN FILTER
Gaussian filter image has shown above and calculated PSNR and MSE values for individual image for several filter that has shown below.
TABLE 3: PSNR AND MSE VALUES FOR GAUSSIAN FILTER
Image MSE PSNR
Img1 82.0484 29.0241 Img2 95.0498 28.3853 Img3 98.4425 28.2330 Img4 101.2089 28.1126 Img5 119.0234 27.4085
Based on the comparison of three filters, median filter possess the accuracy of 58.20% .median filter is used to remove the noise with the accuracy of 58.20%.
IV. SEGMENTATION
environment. In short, it is a feature that describes the distinctive physical composition of the surface Texture method such as texture filter has five steps to segment the cancer image they are
1.read image
2.create texture image
3.create rough mask for the bottom texture 4.use rough mask to segment the top texture 5.display segmentation results.
The five steps involved in image segmentation is shown in below figure.
(a) (b) (c)
(d) (e) (f)
Fig:5 (a)original image(benign) (b) image under implementation (c)create texture image (d) create rough mask to segment the top texture (e)use rough mask to segment the top texture (f)display segmentation results .
Texture is one of the most important defining feature of an image.it is characterized by the spatial distribution of gray levels in the neighbourhood. Texture properties include coarseness, contrast, directionality, line-likeness, regularity, roughness.
(a) (b) (c)
(d) (e) (f)
V. FEATURE EXTRACTION
Using features of an image segmented image is classified into three types such as normal, benign, malignant. The features used to extract the cancer are mean, variance, correlation, contrast,etc., cancer image segmentation using texture method segmentation is done based on the number of pixels. This approach able to identify abnormal mass detection on the clinical database. In future ,we will work to work to diminish the constancy on stricture to make our method adaptive to poles apart images.
FEATURE EXTRACTED FROM GLCM
SUM VARIANCE
MEAN 366.96 13.52
ENTROPHY 8.4436 0.559
VARIANCE 193.574 190.462
GLCM 453.67 56.33
MEDIAN 371.66 17
VI. CONCLUSION
The texture method on dissimilar mammogram images such as benign and malignant, segmentation is done base on the number of pixels. Image texture easily seems by humans and is believed to be a rich source of visual information about the nature and three dimensional first attempt of the image. This approach able to be acquainted with abnormal mass recognition on the clinical database containing the physiognomies such as regularity, linearity, occurrence and segment directionality. In future work classification of ANFIS algorithm will be used for the better improvement and accuracy.
REFERENCES
[1]S. Kannan, N. P. Subiramaniyam, A. T. Rajamanickam, A. Balamurugan “performance comparison of noise in mammogram images“IJRET:
International Journal of Research in Engineering and Technology eISSN: 2319-1163 |
[2]K.Sivaranjani, G.Vaira Suganthi, Dr.J.Sutha Breast Cancer Diagnosis in Mammography Images Using 2D-DWT and LESH Feature Extraction
Technique DOI 10.4010/2016.1777 ,ISSN 2321 3361 © 2016 IJESC
[3]K.Yuvaraj, and U.S.Ragupathy Automatic Mammographic Mass Segmentation based on Region Growing Technique 3rd International Conference on Electronics, Biomedical Engineering and its Applications (ICEBEA'2013) April 29-30, 2013 Singapore
[4]S. Punitha*, S. Ravi** and M. Anousouya Devi*** Breast Cancer Detection in Digital Mammograms using Segmentation TechniquesI J C T A,
9(3), 2016, pp. 167-182
[5]J. Dheeba , N. Albert Singh and S. Tamil Selvi Computer-aided detection of breast cancer on mammograms: A swarm intelligence optimized wavelet neural network approach. Journal of Biomedical Informatics 49 (2014) 45–52
[6] Belal K. Elfarra1 and Ibrahim S. I. Abuhaiba2 New Feature Extraction Method for Mammogram Computer Aided Diagnosis International Journal of Signal Processing, Image Processing and Pattern Recognition Vol. 6, No. 1, February, 2013
[7] PRADEEP N *, Segmentation and Feature Extraction of Tumors from Digital Mammograms Computer Engineering and Intelligent Systems ISSN 2222-1719 (Paper) ISSN 2222-2863 (Online) Vol 3, No.4, 2012
MEAN ENTROPHY VARIANCE GLCM MEDIAN
122.17 6.12 1.7180 255 124
204 2.588 1.4863 255 255
204 4.8028 1.7180 255 204
204 2.56 7.5753 208 204
204 3.113 0.4864 194 164